|
|
市場調査レポート
商品コード
1911222
世界の航空分野における人工知能(AI)市場2026-2030年Global Artificial Intelligence (AI) In Aviation Market 2026-2030 |
||||||
|
|||||||
カスタマイズ可能
|
|||||||

| 世界の航空分野における人工知能(AI)市場2026-2030年 |
|
出版日: 2026年01月14日
発行: TechNavio
ページ情報: 英文 299 Pages
納期: 即納可能
|

概要
世界の航空分野における人工知能(AI)市場は、2025年から2030年の間に121億7,700万米ドル規模に成長し、予測期間中のCAGRは46.6%に達すると予測されております。
本報告書は、世界の航空分野における人工知能(AI)市場について、包括的な分析、市場規模と予測、動向、成長要因、課題、ならびに約25社のベンダー分析を提供します。
本レポートは、現在の市場状況、最新の動向と促進要因、市場環境全般に関する最新の分析を提供します。市場の成長は、自動化と業務効率化への需要急増、AI技術とビッグデータ分析の急速な進歩、旅客体験と安全性の向上への注力の強化によって牽引されています。
本調査は、業界の主要関係者からの情報をはじめとする一次情報と二次情報を客観的に組み合わせて実施されました。本レポートには、主要企業の分析に加え、包括的な市場規模データ、地域別分析を伴うセグメント、ベンダー情勢が含まれています。レポートには過去データと予測データが掲載されています。
| 市場範囲 | |
|---|---|
| 基準年 | 2026年 |
| 終了年 | 2030年 |
| 予測期間 | 2026-2030 |
| 成長モメンタム | 加速 |
| 前年比2026年 | 42.7% |
| CAGR | 46.6% |
| 増分額 | 121億7,700万米ドル |
本調査では、今後数年間における世界の航空分野における人工知能(AI)市場の成長を牽引する主な要因の一つとして、業務効率化への需要の高まりが航空分野におけるAI統合を推進していることを明らかにしております。また、予測保全と安全性の向上がAI導入の主要な促進要因となり、乗客体験の向上という必要性がAIイノベーションを促進することで、市場において相当な需要が生じると予測されます。
目次
第1章 エグゼクティブサマリー
- 市場概要
第2章 Technavio分析
- 価格・ライフサイクル・顧客購入バスケット・採用率・購入基準の分析
- インプットの重要性と差別化の要因
- 混乱の要因
- 促進要因と課題の影響
第3章 市場情勢
- 市場エコシステム
- 市場の特徴
- バリューチェーン分析
第4章 市場規模
- 市場の定義
- 市場セグメント分析
- 市場規模 2025
- 市場の見通し 2025-2030
第5章 市場規模実績
- 世界の航空分野における人工知能(AI)市場 2020-2024
- 部品セグメント分析 2020-2024
- 用途別セグメント分析 2020-2024
- 技術セグメント分析 2020-2024
- 地域別セグメント分析 2020-2024
- 国別セグメント分析 2020-2024
第6章 ファイブフォース分析
- ファイブフォースの要約
- 買い手の交渉力
- 供給企業の交渉力
- 新規参入業者の脅威
- 代替品の脅威
- 競争の脅威
- 市況
第7章 市場セグメンテーション:コンポーネント別
- 市場セグメント
- 比較:コンポーネント別
- ソフトウェア:市場規模と予測 2025-2030
- ハードウェア:市場規模と予測 2025-2030
- サービス:市場規模と予測 2025-2030
- 市場機会:コンポーネント別
第8章 市場セグメンテーション:用途別
- 市場セグメント
- 比較:用途別
- 航空会社運営:市場規模と予測 2025-2030
- 製造およびMRO活動:市場規模と予測 2025-2030
- 市場機会:用途別
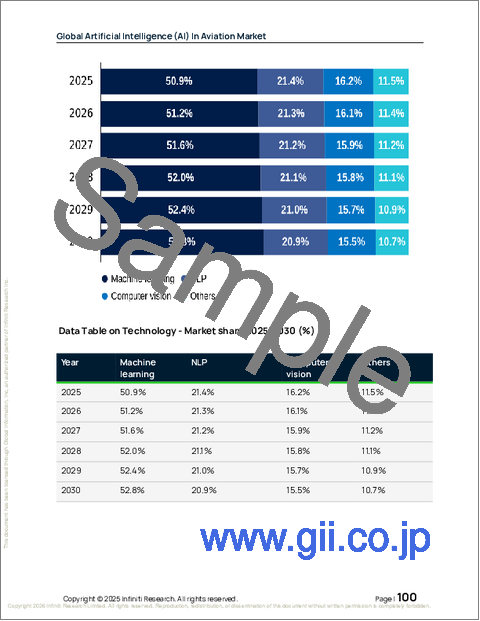
第9章 市場セグメンテーション:技術別
- 市場セグメント
- 比較:技術別
- 機械学習:市場規模と予測 2025-2030
- 自然言語処理(NLP):市場規模と予測 2025-2030
- コンピュータビジョン:市場規模と予測 2025-2030
- その他:市場規模と予測 2025-2030
- 市場機会:技術別
第10章 顧客情勢
- 顧客情勢の概要
第11章 地域別情勢
- 地域別セグメンテーション
- 地域別比較
- 北米:市場規模と予測 2025-2030
- 欧州:市場規模と予測 2025-2030
- アジア太平洋:市場規模と予測 2025-2030
- 南米:市場規模と予測 2025-2030
- 中東・アフリカ:市場規模と予測 2025-2030
- 市場機会:地域別
第12章 促進要因、課題、および機会
- 市場促進要因
- 市場の課題
- 促進要因と課題の影響
- 市場機会
第13章 競合情勢
- 概要
- 競合情勢
- 混乱の状況
- 業界のリスク
第14章 競合分析
- 企業プロファイル
- 企業ランキング指数
- 企業の市場ポジショニング
- Airbus SE
- Amadeus IT Group SA
- Astronics Corp.
- Garmin Ltd.
- General Electric Co.
- Harman International Industries Inc.
- Infosys Ltd.
- Intel Corp.
- IBM Corp.
- Microsoft Corp.
- Mphasis Ltd.
- NVIDIA Corp.
- Sabre Corp.
- Thales Group
- The Boeing Co.

