|
|
市場調査レポート
商品コード
1937247
食品接触紙の世界市場 2026年~2030年Global Food Contact Paper Market 2026-2030 |
||||||
|
|||||||
カスタマイズ可能
|
|||||||

| 食品接触紙の世界市場 2026年~2030年 |
|
出版日: 2026年02月11日
発行: TechNavio
ページ情報: 英文 305 Pages
納期: 即納可能
|

概要
世界の食品接触紙市場は、2025年から2030年の間に1,078億360万米ドル成長し、予測期間中のCAGRは11.4%と予測されております。
本報告書では、世界の食品接触紙市場に関する包括的な分析、市場規模と予測、動向、成長要因、課題に加え、約25社のベンダー分析を提供しております。
本レポートは、現在の市場状況、最新の動向と促進要因、市場環境全般に関する最新の分析を提供します。市場は、持続可能性への要請とプラスチックに対する世界の反発、外食産業と外出先での消費パターンのダイナミックな成長、厳格な世界の食品安全基準、無毒素材への注目によって牽引されています。
本調査は、業界の主要関係者からの情報を含む、一次情報と二次情報の客観的な組み合わせを用いて実施されました。本レポートには、主要企業の分析に加え、包括的な市場規模データ、地域別分析を伴うセグメント、ベンダー情勢が含まれています。レポートには過去データと予測データが掲載されています。
| 市場範囲 | |
|---|---|
| 基準年 | 2026年 |
| 終了年 | 2030年 |
| 予測期間 | 2026年~2030年 |
| 成長モメンタム | 加速 |
| 前年比2026年 | 10.4% |
| CAGR | 11.4% |
| 増分額 | 1,078億360万米ドル |
本調査では、今後数年間における世界の食品接触紙市場の成長を牽引する主要な要因の一つとして、先進的なバイオベースおよび機能性バリア技術の出現を挙げております。また、サプライチェーンにおける徹底的な透明性と強化されたトレーサビリティへの需要、ならびにデジタル印刷とマスカスタマイゼーションの普及が、市場において相当な需要を生み出すと予測されます。
目次
第1章 エグゼクティブサマリー
第2章 Technavio分析
- 価格・ライフサイクル・顧客購入バスケット・採用率・購入基準の分析
- インプットの重要性と差別化の要因
- 混乱の要因
- 促進要因と課題の影響
第3章 市場情勢
- 市場エコシステム
- 市場の特徴
- バリューチェーン分析
第4章 市場規模
- 市場の定義
- 市場セグメント分析
- 市場規模、2025年
- 市場の見通し、2025年~2030年
第5章 市場規模実績
- 食品接触紙の世界市場、2020年~2024年
- タイプセグメント分析、2020年~2024年
- 素材セグメント分析、2020年~2024年
- エンドユーザーセグメント分析、2020年~2024年
- 地域別セグメント分析、2020年~2024年
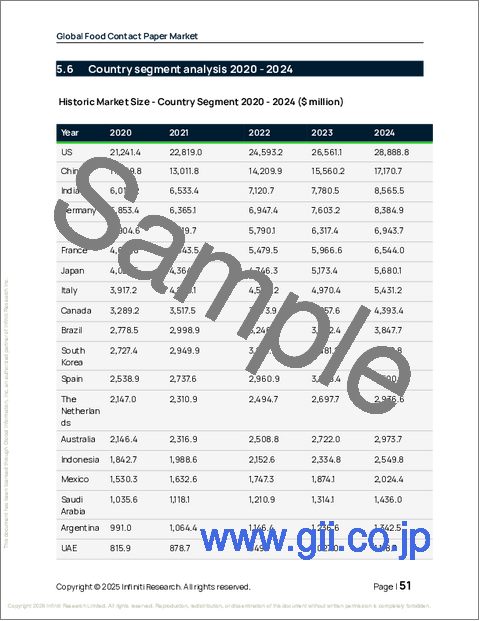
- 国別セグメント分析、2020年~2024年
第6章 定性分析
- AIの影響:食品接触紙の世界市場
第7章 ファイブフォース分析
- ファイブフォースの要約
- 買い手の交渉力
- 供給企業の交渉力
- 新規参入業者の脅威
- 代替品の脅威
- 競争の脅威
- 市況
第8章 市場セグメンテーション:タイプ別
- 比較:タイプ別
- 非ポリコーティング
- ポリコーティング
- 市場機会:タイプ別
第9章 市場セグメンテーション:素材別
- 比較:素材別
- クラフト紙
- 特殊紙
- 再生紙
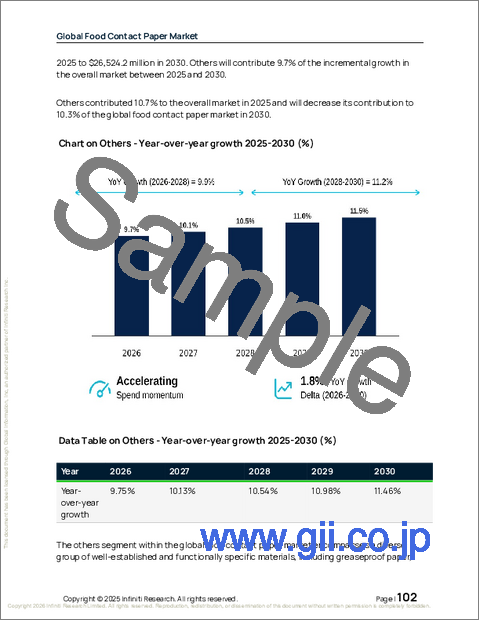
- その他
- 市場機会:素材別
第10章 市場セグメンテーション:エンドユーザー別
- 比較:エンドユーザー別
- 外食産業
- レストラン
- 一般家庭
- 市場機会:エンドユーザー別
第11章 顧客情勢
第12章 地域別情勢
- 地域別セグメンテーション
- 地域別比較
- アジア太平洋
- 中国
- インド
- 日本
- 韓国
- オーストラリア
- インドネシア
- 欧州
- ドイツ
- 英国
- フランス
- イタリア
- スペイン
- オランダ
- 北米
- 米国
- カナダ
- メキシコ
- 南米
- ブラジル
- アルゼンチン
- チリ
- 中東・アフリカ
- サウジアラビア
- アラブ首長国連邦
- 南アフリカ
- エジプト
- トルコ
- 市場機会:地域別
第13章 促進要因・課題・機会
- 市場促進要因
- 市場の課題
- 促進要因と課題の影響
- 市場機会
第14章 競合情勢
- 概要
- 競合情勢
- 混乱の状況
- 業界のリスク
第15章 競合分析
- 企業プロファイル
- 企業ランキング指標
- 企業の市場ポジショニング
- Ahlstrom Oyj
- Billerud AB
- Georgia Pacific LLC
- International Paper Co.
- ITC Ltd.
- JK Paper Ltd.
- Mondi Plc
- Nordic Paper AS
- Oji Holdings Corp.
- Sappi Ltd.
- Seaman Paper Co.
- Smurfit Westrock plc
- Stora Enso Oyj
- Twin Rivers Paper Co.
- UPM Kymmene Corp.
