|
|
市場調査レポート
商品コード
1583605
酸化インジウムスズ (ITO) の世界市場 (2024~2028年)Global Indium Tin Oxide (ITO) Market 2024-2028 |
||||||
|
|||||||
カスタマイズ可能
|
|||||||

| 酸化インジウムスズ (ITO) の世界市場 (2024~2028年) |
|
出版日: 2024年10月11日
発行: TechNavio
ページ情報: 英文 183 Pages
納期: 即納可能
|

全表示
- 概要
- 図表
- 目次
酸化インジウムスズ (ITO) 市場 (2024~2028年)
酸化インジウムスズ (ITO) 市場は2023年から2028年に2億3,980万米ドル分拡大し、予測期間中に5.6%のCAGRで成長すると予測されます。当レポートでは、酸化インジウムスズ (ITO) 市場の全体的な分析、市場規模・予測、動向、成長促進要因、課題、約25社のベンダーを網羅したベンダー分析などを掲載しています。
当レポートでは、現在の市場シナリオ、最新動向と促進要因、市場環境全体に関する最新分析を提供しています。この市場は、再生可能エネルギー源への依存度の増加、最先端のITOの用途、タッチスクリーンデバイスの使用増加によって牽引されています。
| 市場範囲 | |
|---|---|
| 基準年 | 2024年 |
| 終了年 | 2028年 |
| 予測期間 | 2024~2028年 |
| 成長モメンタム | 加速 |
| 前年比 (2024年) | 5.2% |
| CAGR | 5.6% |
| 増分額 | 2億3,980万米ドル |
当レポートでは、今後数年間の酸化インジウムスズ (ITO) 市場成長を牽引する主な要因の一つとして、銀ナノ粒子のITOへの蒸着の増加を挙げています。また、酸化インジウムスズ (ITO) の次世代グラフェンへの置き換えや、生産効率の向上も、同市場の大きな需要につながると思われます。
目次
第1章 エグゼクティブサマリー
- 市場概要
第2章 市場情勢
- 市場エコシステム
- 市場の特徴
- バリューチェーン分析
第3章 市場規模の評価
- 市場の定義
- 市場セグメント分析
- 市場規模 (2023年)
- 市場の見通し (2023~2028年)
第4章 市場規模実績
- 酸化インジウムスズ (ITO) の世界市場 (2018~2022年)
- 技術別分析 (2018~2022年)
- 用途別分析 (2018~2022年)
- 地域別分析 (2018~2022年)
- 国別分析 (2018~2022年)
第5章 ファイブフォース分析
- ファイブフォースの要約
- 買い手の交渉力
- 供給企業の交渉力
- 新規参入業者の脅威
- 代替品の脅威
- 競争の脅威
- 市況
第6章 技術別市場セグメンテーション
- 市場セグメンテーション
- 比較:技術別
- スパッタリング:市場規模と予測 (2023~2028年)
- 真空蒸発:市場規模と予測 (2023~2028年)
- 化学蒸着:市場規模と予測 (2023~2028年)
- スプレー熱分解:市場規模と予測 (2023~2028年)
- その他:市場規模と予測 (2023~2028年)
- 技術別の市場機会
第7章 用途別の市場セグメンテーション
- 市場セグメンテーション
- 比較:用途別
- エレクトロクロミックディスプレイ・LCD:市場規模と予測 (2023~2028年)
- タッチパネル:市場規模と予測 (2023~2028年)
- 太陽光発電:市場規模と予測 (2023~2028年)
- 透明電極:市場規模と予測 (2023~2028年)
- その他:市場規模と予測 (2023~2028年)
- 用途別の市場機会
第8章 顧客情勢
- 顧客情勢の概要
第9章 地域別情勢
- 地域別セグメンテーション
- 地域別比較
- アジア太平洋:市場規模と予測 (2023~2028年)
- 北米:市場規模と予測 (2023~2028年)
- 欧州:市場規模と予測 (2023~2028年)
- 南米:市場規模と予測 (2023~2028年)
- 中東・アフリカ:市場規模と予測 (2023~2028年)
- 中国:市場規模と予測 (2023~2028年)
- 日本:市場規模と予測 (2023~2028年)
- 韓国:市場規模と予測 (2023~2028年)
- 米国:市場規模と予測 (2023~2028年)
- カナダ:市場規模と予測 (2023~2028年)
- 地域別の市場機会
第10章 促進要因・課題・機会・抑制要因
- 市場促進要因
- 市場の課題
- 促進要因と課題の影響
- 市場の機会・抑制要因
第11章 競合情勢
- 概要
- 競合情勢
- 混乱の状況
- 業界のリスク
第12章 競合分析
- 企業プロファイル
- 企業の市場ポジショニング
- Amalgamated Metal Corp. PLC
- American Elements
- Diamond Coatings Inc.
- ENAM OPTOELECTRONIC MATERIAL CO. LTD.
- ENEOS Holdings Inc.
- Guangxi Crystal Union Photoelectric Materials Co. Ltd.
- Indium Corp.
- Knight Optical Ltd.
- MITSUI MINING and SMELTING CO. LTD.
- Nitto Denko Corp.
- OPCO Laboratory Inc.
- Otto Chemie Pvt. Ltd.
- Tosoh Corp.
- Ulvac Inc.
- Umicore SA
第13章 付録
Exhibits:
- Exhibits1: Executive Summary - Chart on Market Overview
- Exhibits2: Executive Summary - Data Table on Market Overview
- Exhibits3: Executive Summary - Chart on Global Market Characteristics
- Exhibits4: Executive Summary - Chart on Market By Geographical Landscape
- Exhibits5: Executive Summary - Chart on Market Segmentation by Technology
- Exhibits6: Executive Summary - Chart on Market Segmentation by Application
- Exhibits7: Executive Summary - Chart on Incremental Growth
- Exhibits8: Executive Summary - Data Table on Incremental Growth
- Exhibits9: Executive Summary - Chart on Company Market Positioning
- Exhibits10: Parent Market
- Exhibits11: Data Table on - Parent Market
- Exhibits12: Market characteristics analysis
- Exhibits13: Value Chain Analysis
- Exhibits14: Offerings of companies included in the market definition
- Exhibits15: Market segments
- Exhibits16: Chart on Global - Market size and forecast 2023-2028 ($ million)
- Exhibits17: Data Table on Global - Market size and forecast 2023-2028 ($ million)
- Exhibits18: Chart on Global Market: Year-over-year growth 2023-2028 (%)
- Exhibits19: Data Table on Global Market: Year-over-year growth 2023-2028 (%)
- Exhibits20: Historic Market Size - Data Table on Global Indium Tin Oxide (ITO) Market 2018 - 2022 ($ million)
- Exhibits21: Historic Market Size - Technology Segment 2018 - 2022 ($ million)
- Exhibits22: Historic Market Size - Application Segment 2018 - 2022 ($ million)
- Exhibits23: Historic Market Size - Geography Segment 2018 - 2022 ($ million)
- Exhibits24: Historic Market Size - Country Segment 2018 - 2022 ($ million)
- Exhibits25: Five forces analysis - Comparison between 2023 and 2028
- Exhibits26: Bargaining power of buyers - Impact of key factors 2023 and 2028
- Exhibits27: Bargaining power of suppliers - Impact of key factors in 2023 and 2028
- Exhibits28: Threat of new entrants - Impact of key factors in 2023 and 2028
- Exhibits29: Threat of substitutes - Impact of key factors in 2023 and 2028
- Exhibits30: Threat of rivalry - Impact of key factors in 2023 and 2028
- Exhibits31: Chart on Market condition - Five forces 2023 and 2028
- Exhibits32: Chart on Technology - Market share 2023-2028 (%)
- Exhibits33: Data Table on Technology - Market share 2023-2028 (%)
- Exhibits34: Chart on Comparison by Technology
- Exhibits35: Data Table on Comparison by Technology
- Exhibits36: Chart on Sputtering - Market size and forecast 2023-2028 ($ million)
- Exhibits37: Data Table on Sputtering - Market size and forecast 2023-2028 ($ million)
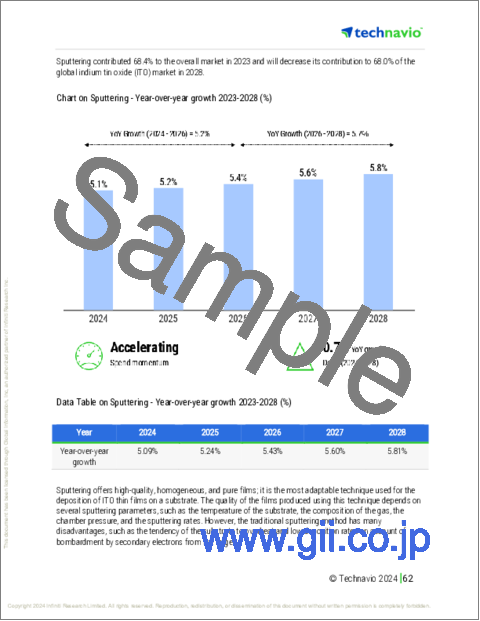
- Exhibits38: Chart on Sputtering - Year-over-year growth 2023-2028 (%)
- Exhibits39: Data Table on Sputtering - Year-over-year growth 2023-2028 (%)
- Exhibits40: Chart on Vacuum evaporation - Market size and forecast 2023-2028 ($ million)
- Exhibits41: Data Table on Vacuum evaporation - Market size and forecast 2023-2028 ($ million)
- Exhibits42: Chart on Vacuum evaporation - Year-over-year growth 2023-2028 (%)
- Exhibits43: Data Table on Vacuum evaporation - Year-over-year growth 2023-2028 (%)
- Exhibits44: Chart on Chemical vapor deposition - Market size and forecast 2023-2028 ($ million)
- Exhibits45: Data Table on Chemical vapor deposition - Market size and forecast 2023-2028 ($ million)
- Exhibits46: Chart on Chemical vapor deposition - Year-over-year growth 2023-2028 (%)
- Exhibits47: Data Table on Chemical vapor deposition - Year-over-year growth 2023-2028 (%)
- Exhibits48: Chart on Spray pyrolysis - Market size and forecast 2023-2028 ($ million)
- Exhibits49: Data Table on Spray pyrolysis - Market size and forecast 2023-2028 ($ million)
- Exhibits50: Chart on Spray pyrolysis - Year-over-year growth 2023-2028 (%)
- Exhibits51: Data Table on Spray pyrolysis - Year-over-year growth 2023-2028 (%)
- Exhibits52: Chart on Others - Market size and forecast 2023-2028 ($ million)
- Exhibits53: Data Table on Others - Market size and forecast 2023-2028 ($ million)
- Exhibits54: Chart on Others - Year-over-year growth 2023-2028 (%)
- Exhibits55: Data Table on Others - Year-over-year growth 2023-2028 (%)
- Exhibits56: Market opportunity by Technology ($ million)
- Exhibits57: Data Table on Market opportunity by Technology ($ million)
- Exhibits58: Chart on Application - Market share 2023-2028 (%)
- Exhibits59: Data Table on Application - Market share 2023-2028 (%)
- Exhibits60: Chart on Comparison by Application
- Exhibits61: Data Table on Comparison by Application
- Exhibits62: Chart on Electrochromic displays and LCDs - Market size and forecast 2023-2028 ($ million)
- Exhibits63: Data Table on Electrochromic displays and LCDs - Market size and forecast 2023-2028 ($ million)
- Exhibits64: Chart on Electrochromic displays and LCDs - Year-over-year growth 2023-2028 (%)
- Exhibits65: Data Table on Electrochromic displays and LCDs - Year-over-year growth 2023-2028 (%)
- Exhibits66: Chart on Touch panels - Market size and forecast 2023-2028 ($ million)
- Exhibits67: Data Table on Touch panels - Market size and forecast 2023-2028 ($ million)
- Exhibits68: Chart on Touch panels - Year-over-year growth 2023-2028 (%)
- Exhibits69: Data Table on Touch panels - Year-over-year growth 2023-2028 (%)
- Exhibits70: Chart on Photovoltaics - Market size and forecast 2023-2028 ($ million)
- Exhibits71: Data Table on Photovoltaics - Market size and forecast 2023-2028 ($ million)
- Exhibits72: Chart on Photovoltaics - Year-over-year growth 2023-2028 (%)
- Exhibits73: Data Table on Photovoltaics - Year-over-year growth 2023-2028 (%)
- Exhibits74: Chart on Transparent electrodes - Market size and forecast 2023-2028 ($ million)
- Exhibits75: Data Table on Transparent electrodes - Market size and forecast 2023-2028 ($ million)
- Exhibits76: Chart on Transparent electrodes - Year-over-year growth 2023-2028 (%)
- Exhibits77: Data Table on Transparent electrodes - Year-over-year growth 2023-2028 (%)
- Exhibits78: Chart on Others - Market size and forecast 2023-2028 ($ million)
- Exhibits79: Data Table on Others - Market size and forecast 2023-2028 ($ million)
- Exhibits80: Chart on Others - Year-over-year growth 2023-2028 (%)
- Exhibits81: Data Table on Others - Year-over-year growth 2023-2028 (%)
- Exhibits82: Market opportunity by Application ($ million)
- Exhibits83: Data Table on Market opportunity by Application ($ million)
- Exhibits84: Analysis of price sensitivity, lifecycle, customer purchase basket, adoption rates, and purchase criteria
- Exhibits85: Chart on Market share By Geographical Landscape 2023-2028 (%)
- Exhibits86: Data Table on Market share By Geographical Landscape 2023-2028 (%)
- Exhibits87: Chart on Geographic comparison
- Exhibits88: Data Table on Geographic comparison
- Exhibits89: Chart on APAC - Market size and forecast 2023-2028 ($ million)
- Exhibits90: Data Table on APAC - Market size and forecast 2023-2028 ($ million)
- Exhibits91: Chart on APAC - Year-over-year growth 2023-2028 (%)
- Exhibits92: Data Table on APAC - Year-over-year growth 2023-2028 (%)
- Exhibits93: Chart on North America - Market size and forecast 2023-2028 ($ million)
- Exhibits94: Data Table on North America - Market size and forecast 2023-2028 ($ million)
- Exhibits95: Chart on North America - Year-over-year growth 2023-2028 (%)
- Exhibits96: Data Table on North America - Year-over-year growth 2023-2028 (%)
- Exhibits97: Chart on Europe - Market size and forecast 2023-2028 ($ million)
- Exhibits98: Data Table on Europe - Market size and forecast 2023-2028 ($ million)
- Exhibits99: Chart on Europe - Year-over-year growth 2023-2028 (%)
- Exhibits100: Data Table on Europe - Year-over-year growth 2023-2028 (%)
- Exhibits101: Chart on South America - Market size and forecast 2023-2028 ($ million)
- Exhibits102: Data Table on South America - Market size and forecast 2023-2028 ($ million)
- Exhibits103: Chart on South America - Year-over-year growth 2023-2028 (%)
- Exhibits104: Data Table on South America - Year-over-year growth 2023-2028 (%)
- Exhibits105: Chart on Middle East and Africa - Market size and forecast 2023-2028 ($ million)
- Exhibits106: Data Table on Middle East and Africa - Market size and forecast 2023-2028 ($ million)
- Exhibits107: Chart on Middle East and Africa - Year-over-year growth 2023-2028 (%)
- Exhibits108: Data Table on Middle East and Africa - Year-over-year growth 2023-2028 (%)
- Exhibits109: Chart on China - Market size and forecast 2023-2028 ($ million)
- Exhibits110: Data Table on China - Market size and forecast 2023-2028 ($ million)
- Exhibits111: Chart on China - Year-over-year growth 2023-2028 (%)
- Exhibits112: Data Table on China - Year-over-year growth 2023-2028 (%)
- Exhibits113: Chart on Japan - Market size and forecast 2023-2028 ($ million)
- Exhibits114: Data Table on Japan - Market size and forecast 2023-2028 ($ million)
- Exhibits115: Chart on Japan - Year-over-year growth 2023-2028 (%)
- Exhibits116: Data Table on Japan - Year-over-year growth 2023-2028 (%)
- Exhibits117: Chart on South Korea - Market size and forecast 2023-2028 ($ million)
- Exhibits118: Data Table on South Korea - Market size and forecast 2023-2028 ($ million)
- Exhibits119: Chart on South Korea - Year-over-year growth 2023-2028 (%)
- Exhibits120: Data Table on South Korea - Year-over-year growth 2023-2028 (%)
- Exhibits121: Chart on US - Market size and forecast 2023-2028 ($ million)
- Exhibits122: Data Table on US - Market size and forecast 2023-2028 ($ million)
- Exhibits123: Chart on US - Year-over-year growth 2023-2028 (%)
- Exhibits124: Data Table on US - Year-over-year growth 2023-2028 (%)
- Exhibits125: Chart on Canada - Market size and forecast 2023-2028 ($ million)
- Exhibits126: Data Table on Canada - Market size and forecast 2023-2028 ($ million)
- Exhibits127: Chart on Canada - Year-over-year growth 2023-2028 (%)
- Exhibits128: Data Table on Canada - Year-over-year growth 2023-2028 (%)
- Exhibits129: Market opportunity By Geographical Landscape ($ million)
- Exhibits130: Data Tables on Market opportunity By Geographical Landscape ($ million)
- Exhibits131: Impact of drivers and challenges in 2023 and 2028
- Exhibits132: Overview on criticality of inputs and factors of differentiation
- Exhibits133: Overview on factors of disruption
- Exhibits134: Impact of key risks on business
- Exhibits135: Companies covered
- Exhibits136: Matrix on companies position and classification
- Exhibits137: Amalgamated Metal Corp. PLC - Overview
- Exhibits138: Amalgamated Metal Corp. PLC - Product / Service
- Exhibits139: Amalgamated Metal Corp. PLC - Key offerings
- Exhibits140: American Elements - Overview
- Exhibits141: American Elements - Product / Service
- Exhibits142: American Elements - Key offerings
- Exhibits143: Diamond Coatings Inc. - Overview
- Exhibits144: Diamond Coatings Inc. - Product / Service
- Exhibits145: Diamond Coatings Inc. - Key offerings
- Exhibits146: ENAM OPTOELECTRONIC MATERIAL CO. LTD. - Overview
- Exhibits147: ENAM OPTOELECTRONIC MATERIAL CO. LTD. - Product / Service
- Exhibits148: ENAM OPTOELECTRONIC MATERIAL CO. LTD. - Key offerings
- Exhibits149: ENEOS Holdings Inc. - Overview
- Exhibits150: ENEOS Holdings Inc. - Business segments
- Exhibits151: ENEOS Holdings Inc. - Key offerings
- Exhibits152: ENEOS Holdings Inc. - Segment focus
- Exhibits153: Guangxi Crystal Union Photoelectric Materials Co. Ltd. - Overview
- Exhibits154: Guangxi Crystal Union Photoelectric Materials Co. Ltd. - Product / Service
- Exhibits155: Guangxi Crystal Union Photoelectric Materials Co. Ltd. - Key offerings
- Exhibits156: Indium Corp. - Overview
- Exhibits157: Indium Corp. - Product / Service
- Exhibits158: Indium Corp. - Key news
- Exhibits159: Indium Corp. - Key offerings
- Exhibits160: Knight Optical Ltd. - Overview
- Exhibits161: Knight Optical Ltd. - Product / Service
- Exhibits162: Knight Optical Ltd. - Key offerings
- Exhibits163: MITSUI MINING and SMELTING CO. LTD. - Overview
- Exhibits164: MITSUI MINING and SMELTING CO. LTD. - Product / Service
- Exhibits165: MITSUI MINING and SMELTING CO. LTD. - Key offerings
- Exhibits166: Nitto Denko Corp. - Overview
- Exhibits167: Nitto Denko Corp. - Business segments
- Exhibits168: Nitto Denko Corp. - Key news
- Exhibits169: Nitto Denko Corp. - Key offerings
- Exhibits170: Nitto Denko Corp. - Segment focus
- Exhibits171: OPCO Laboratory Inc. - Overview
- Exhibits172: OPCO Laboratory Inc. - Product / Service
- Exhibits173: OPCO Laboratory Inc. - Key offerings
- Exhibits174: Otto Chemie Pvt. Ltd. - Overview
- Exhibits175: Otto Chemie Pvt. Ltd. - Product / Service
- Exhibits176: Otto Chemie Pvt. Ltd. - Key offerings
- Exhibits177: Tosoh Corp. - Overview
- Exhibits178: Tosoh Corp. - Business segments
- Exhibits179: Tosoh Corp. - Key offerings
- Exhibits180: Tosoh Corp. - Segment focus
- Exhibits181: Ulvac Inc. - Overview
- Exhibits182: Ulvac Inc. - Business segments
- Exhibits183: Ulvac Inc. - Key offerings
- Exhibits184: Ulvac Inc. - Segment focus
- Exhibits185: Umicore SA - Overview
- Exhibits186: Umicore SA - Business segments
- Exhibits187: Umicore SA - Key news
- Exhibits188: Umicore SA - Key offerings
- Exhibits189: Umicore SA - Segment focus
- Exhibits190: Inclusions checklist
- Exhibits191: Exclusions checklist
- Exhibits192: Currency conversion rates for US$
- Exhibits193: Research methodology
- Exhibits194: Information sources
- Exhibits195: Data validation
- Exhibits196: Validation techniques employed for market sizing
- Exhibits197: Data synthesis
- Exhibits198: 360 degree market analysis
- Exhibits199: List of abbreviations
Indium Tin Oxide (ITO) Market 2024-2028
The indium tin oxide (ITO) market is forecasted to grow by USD 239.8 mn during 2023-2028, accelerating at a CAGR of 5.6% during the forecast period. The report on the indium tin oxide (ITO) market provides a holistic analysis, market size and forecast, trends, growth drivers, and challenges, as well as vendor analysis covering around 25 vendors.
The report offers an up-to-date analysis regarding the current market scenario, the latest trends and drivers, and the overall market environment. The market is driven by increasing dependency on renewable energy sources, advanced applications of ito, and increasing usage of touchscreen devices.
| Market Scope | |
|---|---|
| Base Year | 2024 |
| End Year | 2028 |
| Series Year | 2024-2028 |
| Growth Momentum | Accelerate |
| YOY 2024 | 5.2% |
| CAGR | 5.6% |
| Incremental Value | $239.8 mn |
Technavio's indium tin oxide (ITO) market is segmented as below:
By Technology
- Sputtering
- Vacuum evaporation
- Chemical vapor deposition
- Spray pyrolysis
- Others
By Application
- Electrochromic displays and LCDs
- Touch panels
- Photovoltaics
- Transparent electrodes
- Others
By Geographical Landscape
- APAC
- North America
- Europe
- South America
- Middle East and Africa
This study identifies the increased deposition of silver nanoparticles on ito as one of the prime reasons driving the indium tin oxide (ITO) market growth during the next few years. Also, replacing indium tin oxide (ITO) with next-generation graphene and increased production efficiency will lead to sizable demand in the market.
The report on the indium tin oxide (ITO) market covers the following areas:
- Indium Tin Oxide (ITO) Market sizing
- Indium Tin Oxide (ITO) Market forecast
- Indium Tin Oxide (ITO) Market industry analysis
The robust vendor analysis is designed to help clients improve their market position, and in line with this, this report provides a detailed analysis of several leading indium tin oxide (ITO) market vendors that include Amalgamated Metal Corp. PLC, American Elements, Diamond Coatings Inc., ENAM OPTOELECTRONIC MATERIAL CO. LTD., ENEOS Holdings Inc., Guangxi Crystal Union Photoelectric Materials Co. Ltd., Indium Corp., Knight Optical Ltd., Kurt J Lesker Co., Merck KGaA, MITSUI MINING and SMELTING CO. LTD., NANOGRAFI Co. Inc., Nanoshel LLC, Nitto Denko Corp., NYACOL Nano Technologies Inc., OPCO Laboratory Inc., Otto Chemie Pvt. Ltd., Tosoh Corp., Ulvac Inc., and Umicore SA. Also, the indium tin oxide (ITO) market analysis report includes information on upcoming trends and challenges that will influence market growth. This is to help companies strategize and leverage all forthcoming growth opportunities.
The study was conducted using an objective combination of primary and secondary information including inputs from key participants in the industry. The report contains a comprehensive market and vendor landscape in addition to an analysis of the key vendors.
The publisher presents a detailed picture of the market by the way of study, synthesis, and summation of data from multiple sources by an analysis of key parameters such as profit, pricing, competition, and promotions. It presents various market facets by identifying the key industry influencers. The data presented is comprehensive, reliable, and a result of extensive primary and secondary research. The market research reports provide a complete competitive landscape and an in-depth vendor selection methodology and analysis using qualitative and quantitative research to forecast accurate market growth.
Table of Contents
1 Executive Summary
- 1.1 Market overview
- Executive Summary - Chart on Market Overview
- Executive Summary - Data Table on Market Overview
- Executive Summary - Chart on Global Market Characteristics
- Executive Summary - Chart on Market By Geographical Landscape
- Executive Summary - Chart on Market Segmentation by Technology
- Executive Summary - Chart on Market Segmentation by Application
- Executive Summary - Chart on Incremental Growth
- Executive Summary - Data Table on Incremental Growth
- Executive Summary - Chart on Company Market Positioning
2 Market Landscape
- 2.1 Market ecosystem
- Parent Market
- Data Table on - Parent Market
- 2.2 Market characteristics
- Market characteristics analysis
- 2.3 Value chain analysis
- Value Chain Analysis
3 Market Sizing
- 3.1 Market definition
- Offerings of companies included in the market definition
- 3.2 Market segment analysis
- Market segments
- 3.3 Market size 2023
- 3.4 Market outlook: Forecast for 2023-2028
- Chart on Global - Market size and forecast 2023-2028 ($ million)
- Data Table on Global - Market size and forecast 2023-2028 ($ million)
- Chart on Global Market: Year-over-year growth 2023-2028 (%)
- Data Table on Global Market: Year-over-year growth 2023-2028 (%)
4 Historic Market Size
- 4.1 Global Indium Tin Oxide (ITO) Market 2018 - 2022
- Historic Market Size - Data Table on Global Indium Tin Oxide (ITO) Market 2018 - 2022 ($ million)
- 4.2 Technology segment analysis 2018 - 2022
- Historic Market Size - Technology Segment 2018 - 2022 ($ million)
- 4.3 Application segment analysis 2018 - 2022
- Historic Market Size - Application Segment 2018 - 2022 ($ million)
- 4.4 Geography segment analysis 2018 - 2022
- Historic Market Size - Geography Segment 2018 - 2022 ($ million)
- 4.5 Country segment analysis 2018 - 2022
- Historic Market Size - Country Segment 2018 - 2022 ($ million)
5 Five Forces Analysis
- 5.1 Five forces summary
- Five forces analysis - Comparison between 2023 and 2028
- 5.2 Bargaining power of buyers
- Bargaining power of buyers - Impact of key factors 2023 and 2028
- 5.3 Bargaining power of suppliers
- Bargaining power of suppliers - Impact of key factors in 2023 and 2028
- 5.4 Threat of new entrants
- Threat of new entrants - Impact of key factors in 2023 and 2028
- 5.5 Threat of substitutes
- Threat of substitutes - Impact of key factors in 2023 and 2028
- 5.6 Threat of rivalry
- Threat of rivalry - Impact of key factors in 2023 and 2028
- 5.7 Market condition
- Chart on Market condition - Five forces 2023 and 2028
6 Market Segmentation by Technology
- 6.1 Market segments
- Chart on Technology - Market share 2023-2028 (%)
- Data Table on Technology - Market share 2023-2028 (%)
- 6.2 Comparison by Technology
- Chart on Comparison by Technology
- Data Table on Comparison by Technology
- 6.3 Sputtering - Market size and forecast 2023-2028
- Chart on Sputtering - Market size and forecast 2023-2028 ($ million)
- Data Table on Sputtering - Market size and forecast 2023-2028 ($ million)
- Chart on Sputtering - Year-over-year growth 2023-2028 (%)
- Data Table on Sputtering - Year-over-year growth 2023-2028 (%)
- 6.4 Vacuum evaporation - Market size and forecast 2023-2028
- Chart on Vacuum evaporation - Market size and forecast 2023-2028 ($ million)
- Data Table on Vacuum evaporation - Market size and forecast 2023-2028 ($ million)
- Chart on Vacuum evaporation - Year-over-year growth 2023-2028 (%)
- Data Table on Vacuum evaporation - Year-over-year growth 2023-2028 (%)
- 6.5 Chemical vapor deposition - Market size and forecast 2023-2028
- Chart on Chemical vapor deposition - Market size and forecast 2023-2028 ($ million)
- Data Table on Chemical vapor deposition - Market size and forecast 2023-2028 ($ million)
- Chart on Chemical vapor deposition - Year-over-year growth 2023-2028 (%)
- Data Table on Chemical vapor deposition - Year-over-year growth 2023-2028 (%)
- 6.6 Spray pyrolysis - Market size and forecast 2023-2028
- Chart on Spray pyrolysis - Market size and forecast 2023-2028 ($ million)
- Data Table on Spray pyrolysis - Market size and forecast 2023-2028 ($ million)
- Chart on Spray pyrolysis - Year-over-year growth 2023-2028 (%)
- Data Table on Spray pyrolysis - Year-over-year growth 2023-2028 (%)
- 6.7 Others - Market size and forecast 2023-2028
- Chart on Others - Market size and forecast 2023-2028 ($ million)
- Data Table on Others - Market size and forecast 2023-2028 ($ million)
- Chart on Others - Year-over-year growth 2023-2028 (%)
- Data Table on Others - Year-over-year growth 2023-2028 (%)
- 6.8 Market opportunity by Technology
- Market opportunity by Technology ($ million)
- Data Table on Market opportunity by Technology ($ million)
7 Market Segmentation by Application
- 7.1 Market segments
- Chart on Application - Market share 2023-2028 (%)
- Data Table on Application - Market share 2023-2028 (%)
- 7.2 Comparison by Application
- Chart on Comparison by Application
- Data Table on Comparison by Application
- 7.3 Electrochromic displays and LCDs - Market size and forecast 2023-2028
- Chart on Electrochromic displays and LCDs - Market size and forecast 2023-2028 ($ million)
- Data Table on Electrochromic displays and LCDs - Market size and forecast 2023-2028 ($ million)
- Chart on Electrochromic displays and LCDs - Year-over-year growth 2023-2028 (%)
- Data Table on Electrochromic displays and LCDs - Year-over-year growth 2023-2028 (%)
- 7.4 Touch panels - Market size and forecast 2023-2028
- Chart on Touch panels - Market size and forecast 2023-2028 ($ million)
- Data Table on Touch panels - Market size and forecast 2023-2028 ($ million)
- Chart on Touch panels - Year-over-year growth 2023-2028 (%)
- Data Table on Touch panels - Year-over-year growth 2023-2028 (%)
- 7.5 Photovoltaics - Market size and forecast 2023-2028
- Chart on Photovoltaics - Market size and forecast 2023-2028 ($ million)
- Data Table on Photovoltaics - Market size and forecast 2023-2028 ($ million)
- Chart on Photovoltaics - Year-over-year growth 2023-2028 (%)
- Data Table on Photovoltaics - Year-over-year growth 2023-2028 (%)
- 7.6 Transparent electrodes - Market size and forecast 2023-2028
- Chart on Transparent electrodes - Market size and forecast 2023-2028 ($ million)
- Data Table on Transparent electrodes - Market size and forecast 2023-2028 ($ million)
- Chart on Transparent electrodes - Year-over-year growth 2023-2028 (%)
- Data Table on Transparent electrodes - Year-over-year growth 2023-2028 (%)
- 7.7 Others - Market size and forecast 2023-2028
- Chart on Others - Market size and forecast 2023-2028 ($ million)
- Data Table on Others - Market size and forecast 2023-2028 ($ million)
- Chart on Others - Year-over-year growth 2023-2028 (%)
- Data Table on Others - Year-over-year growth 2023-2028 (%)
- 7.8 Market opportunity by Application
- Market opportunity by Application ($ million)
- Data Table on Market opportunity by Application ($ million)
8 Customer Landscape
- 8.1 Customer landscape overview
- Analysis of price sensitivity, lifecycle, customer purchase basket, adoption rates, and purchase criteria
9 Geographic Landscape
- 9.1 Geographic segmentation
- Chart on Market share By Geographical Landscape 2023-2028 (%)
- Data Table on Market share By Geographical Landscape 2023-2028 (%)
- 9.2 Geographic comparison
- Chart on Geographic comparison
- Data Table on Geographic comparison
- 9.3 APAC - Market size and forecast 2023-2028
- Chart on APAC - Market size and forecast 2023-2028 ($ million)
- Data Table on APAC - Market size and forecast 2023-2028 ($ million)
- Chart on APAC - Year-over-year growth 2023-2028 (%)
- Data Table on APAC - Year-over-year growth 2023-2028 (%)
- 9.4 North America - Market size and forecast 2023-2028
- Chart on North America - Market size and forecast 2023-2028 ($ million)
- Data Table on North America - Market size and forecast 2023-2028 ($ million)
- Chart on North America - Year-over-year growth 2023-2028 (%)
- Data Table on North America - Year-over-year growth 2023-2028 (%)
- 9.5 Europe - Market size and forecast 2023-2028
- Chart on Europe - Market size and forecast 2023-2028 ($ million)
- Data Table on Europe - Market size and forecast 2023-2028 ($ million)
- Chart on Europe - Year-over-year growth 2023-2028 (%)
- Data Table on Europe - Year-over-year growth 2023-2028 (%)
- 9.6 South America - Market size and forecast 2023-2028
- Chart on South America - Market size and forecast 2023-2028 ($ million)
- Data Table on South America - Market size and forecast 2023-2028 ($ million)
- Chart on South America - Year-over-year growth 2023-2028 (%)
- Data Table on South America - Year-over-year growth 2023-2028 (%)
- 9.7 Middle East and Africa - Market size and forecast 2023-2028
- Chart on Middle East and Africa - Market size and forecast 2023-2028 ($ million)
- Data Table on Middle East and Africa - Market size and forecast 2023-2028 ($ million)
- Chart on Middle East and Africa - Year-over-year growth 2023-2028 (%)
- Data Table on Middle East and Africa - Year-over-year growth 2023-2028 (%)
- 9.8 China - Market size and forecast 2023-2028
- Chart on China - Market size and forecast 2023-2028 ($ million)
- Data Table on China - Market size and forecast 2023-2028 ($ million)
- Chart on China - Year-over-year growth 2023-2028 (%)
- Data Table on China - Year-over-year growth 2023-2028 (%)
- 9.9 Japan - Market size and forecast 2023-2028
- Chart on Japan - Market size and forecast 2023-2028 ($ million)
- Data Table on Japan - Market size and forecast 2023-2028 ($ million)
- Chart on Japan - Year-over-year growth 2023-2028 (%)
- Data Table on Japan - Year-over-year growth 2023-2028 (%)
- 9.10 South Korea - Market size and forecast 2023-2028
- Chart on South Korea - Market size and forecast 2023-2028 ($ million)
- Data Table on South Korea - Market size and forecast 2023-2028 ($ million)
- Chart on South Korea - Year-over-year growth 2023-2028 (%)
- Data Table on South Korea - Year-over-year growth 2023-2028 (%)
- 9.11 US - Market size and forecast 2023-2028
- Chart on US - Market size and forecast 2023-2028 ($ million)
- Data Table on US - Market size and forecast 2023-2028 ($ million)
- Chart on US - Year-over-year growth 2023-2028 (%)
- Data Table on US - Year-over-year growth 2023-2028 (%)
- 9.12 Canada - Market size and forecast 2023-2028
- Chart on Canada - Market size and forecast 2023-2028 ($ million)
- Data Table on Canada - Market size and forecast 2023-2028 ($ million)
- Chart on Canada - Year-over-year growth 2023-2028 (%)
- Data Table on Canada - Year-over-year growth 2023-2028 (%)
- 9.13 Market opportunity By Geographical Landscape
- Market opportunity By Geographical Landscape ($ million)
- Data Tables on Market opportunity By Geographical Landscape ($ million)
10 Drivers, Challenges, and Opportunity/Restraints
- 10.1 Market drivers
- 10.2 Market challenges
- 10.3 Impact of drivers and challenges
- Impact of drivers and challenges in 2023 and 2028
- 10.4 Market opportunities/restraints
11 Competitive Landscape
- 11.1 Overview
- 11.2 Competitive Landscape
- Overview on criticality of inputs and factors of differentiation
- 11.3 Landscape disruption
- Overview on factors of disruption
- 11.4 Industry risks
- Impact of key risks on business
12 Competitive Analysis
- 12.1 Companies profiled
- Companies covered
- 12.2 Market positioning of companies
- Matrix on companies position and classification
- 12.3 Amalgamated Metal Corp. PLC
- Amalgamated Metal Corp. PLC - Overview
- Amalgamated Metal Corp. PLC - Product / Service
- Amalgamated Metal Corp. PLC - Key offerings
- 12.4 American Elements
- American Elements - Overview
- American Elements - Product / Service
- American Elements - Key offerings
- 12.5 Diamond Coatings Inc.
- Diamond Coatings Inc. - Overview
- Diamond Coatings Inc. - Product / Service
- Diamond Coatings Inc. - Key offerings
- 12.6 ENAM OPTOELECTRONIC MATERIAL CO. LTD.
- ENAM OPTOELECTRONIC MATERIAL CO. LTD. - Overview
- ENAM OPTOELECTRONIC MATERIAL CO. LTD. - Product / Service
- ENAM OPTOELECTRONIC MATERIAL CO. LTD. - Key offerings
- 12.7 ENEOS Holdings Inc.
- ENEOS Holdings Inc. - Overview
- ENEOS Holdings Inc. - Business segments
- ENEOS Holdings Inc. - Key offerings
- ENEOS Holdings Inc. - Segment focus
- 12.8 Guangxi Crystal Union Photoelectric Materials Co. Ltd.
- Guangxi Crystal Union Photoelectric Materials Co. Ltd. - Overview
- Guangxi Crystal Union Photoelectric Materials Co. Ltd. - Product / Service
- Guangxi Crystal Union Photoelectric Materials Co. Ltd. - Key offerings
- 12.9 Indium Corp.
- Indium Corp. - Overview
- Indium Corp. - Product / Service
- Indium Corp. - Key news
- Indium Corp. - Key offerings
- 12.10 Knight Optical Ltd.
- Knight Optical Ltd. - Overview
- Knight Optical Ltd. - Product / Service
- Knight Optical Ltd. - Key offerings
- 12.11 MITSUI MINING and SMELTING CO. LTD.
- MITSUI MINING and SMELTING CO. LTD. - Overview
- MITSUI MINING and SMELTING CO. LTD. - Product / Service
- MITSUI MINING and SMELTING CO. LTD. - Key offerings
- 12.12 Nitto Denko Corp.
- Nitto Denko Corp. - Overview
- Nitto Denko Corp. - Business segments
- Nitto Denko Corp. - Key news
- Nitto Denko Corp. - Key offerings
- Nitto Denko Corp. - Segment focus
- 12.13 OPCO Laboratory Inc.
- OPCO Laboratory Inc. - Overview
- OPCO Laboratory Inc. - Product / Service
- OPCO Laboratory Inc. - Key offerings
- 12.14 Otto Chemie Pvt. Ltd.
- Otto Chemie Pvt. Ltd. - Overview
- Otto Chemie Pvt. Ltd. - Product / Service
- Otto Chemie Pvt. Ltd. - Key offerings
- 12.15 Tosoh Corp.
- Tosoh Corp. - Overview
- Tosoh Corp. - Business segments
- Tosoh Corp. - Key offerings
- Tosoh Corp. - Segment focus
- 12.16 Ulvac Inc.
- Ulvac Inc. - Overview
- Ulvac Inc. - Business segments
- Ulvac Inc. - Key offerings
- Ulvac Inc. - Segment focus
- 12.17 Umicore SA
- Umicore SA - Overview
- Umicore SA - Business segments
- Umicore SA - Key news
- Umicore SA - Key offerings
- Umicore SA - Segment focus
13 Appendix
- 13.1 Scope of the report
- 13.2 Inclusions and exclusions checklist
- Inclusions checklist
- Exclusions checklist
- 13.3 Currency conversion rates for US$
- Currency conversion rates for US$
- 13.4 Research methodology
- Research methodology
- 13.5 Data procurement
- Information sources
- 13.6 Data validation
- Data validation
- 13.7 Validation techniques employed for market sizing
- Validation techniques employed for market sizing
- 13.8 Data synthesis
- Data synthesis
- 13.9 360 degree market analysis
- 360 degree market analysis
- 13.10 List of abbreviations
- List of abbreviations
