|
|
市場調査レポート
商品コード
1911225
世界の先進的エネルギー貯蔵システム(AESS)市場2026-2030年Global Advanced Energy Storage Systems (AESS) Market 2026-2030 |
||||||

|
|||||||
カスタマイズ可能
|
|||||||

| 世界の先進的エネルギー貯蔵システム(AESS)市場2026-2030年 |
|
出版日: 2026年01月14日
発行: TechNavio
ページ情報: 英文 290 Pages
納期: 即納可能
|

概要
世界の先進的エネルギー貯蔵システム(AESS)市場は、2025年から2030年にかけて121億8,620万米ドルの成長が見込まれており、予測期間中のCAGRは11.3%と予測されております。
本報告書は、世界の先進的エネルギー貯蔵システム(AESS)市場に関する包括的な分析、市場規模と予測、動向、成長要因、課題、ならびに約25社のベンダー分析を提供します。
本レポートは、現在の市場状況、最新の動向と促進要因、市場環境全般に関する最新の分析を提供します。市場は、再生可能エネルギー源の採用拡大、安定かつ信頼性の高い電力供給への需要増加、エネルギー自立への志向によって牽引されています。
本調査は、業界の主要関係者からの情報をはじめ、一次情報と二次情報を客観的に組み合わせて実施されました。本レポートには、主要企業の分析に加え、包括的な市場規模データ、地域別分析を伴うセグメント、ベンダー情勢が含まれています。レポートには過去データと予測データが掲載されています。
| 市場範囲 | |
|---|---|
| 基準年 | 2026年 |
| 終了年 | 2030年 |
| 予測期間 | 2026-2030 |
| 成長モメンタム | 加速 |
| 前年比2026年 | 10.3% |
| CAGR | 11.3% |
| 増分額 | 121億8,620万米ドル |
本調査では、今後数年間における世界の先進的エネルギー貯蔵システム(AESS)市場の成長を牽引する主要要因の一つとして、リチウムイオン電池の支配力拡大を特定しております。また、複数の貯蔵技術の統合と地域密着型エネルギー貯蔵ソリューションへの需要増加が、市場における相当な需要創出につながると見込まれます。
目次
第1章 エグゼクティブサマリー
- 市場概要
第2章 Technavio分析
- 価格・ライフサイクル・顧客購入バスケット・採用率・購入基準の分析
- インプットの重要性と差別化の要因
- 混乱の要因
- 促進要因と課題の影響
第3章 市場情勢
- 市場エコシステム
- 市場の特徴
- バリューチェーン分析
第4章 市場規模
- 市場の定義
- 市場セグメント分析
- 市場規模 2025
- 市場の見通し 2025-2030
第5章 市場規模実績
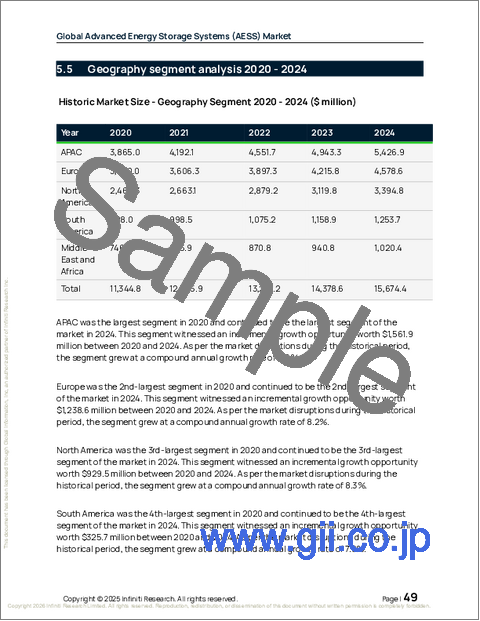
- 世界の先進的エネルギー貯蔵システム(AESS)市場 2020-2024
- 用途別セグメント分析 2020-2024
- エンドユーザーセグメント分析 2020-2024
- タイプセグメント分析 2020-2024
- 地域別セグメント分析 2020-2024
- 国別セグメント分析 2020-2024
第6章 定性分析
- AIの影響:世界の先進的エネルギー貯蔵システム(AESS)市場
第7章 ファイブフォース分析
- ファイブフォースの要約
- 買い手の交渉力
- 供給企業の交渉力
- 新規参入業者の脅威
- 代替品の脅威
- 競争の脅威
- 市況
第8章 市場セグメンテーション:用途別
- 市場セグメント
- 比較:用途別
- グリッドストレージ:市場規模と予測 2025-2030
- 交通機関:市場規模と予測 2025-2030
- 市場機会:用途別
第9章 市場セグメンテーション:エンドユーザー別
- 市場セグメント
- 比較:エンドユーザー別
- 非住宅:市場規模と予測 2025-2030
- 住宅用:市場規模と予測 2025-2030
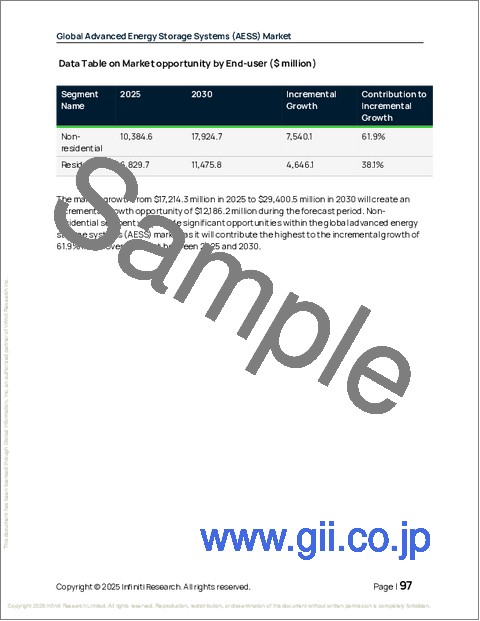
- 市場機会:エンドユーザー別
第10章 市場セグメンテーション:タイプ別
- 市場セグメント
- 比較:タイプ別
- 電気化学式:市場規模と予測 2025-2030
- 機械式:市場規模と予測 2025-2030
- 熱式:市場規模と予測 2025-2030
- その他:市場規模と予測 2025-2030
- 市場機会:タイプ別
第11章 顧客情勢
- 顧客情勢の概要
第12章 地域別情勢
- 地域別セグメンテーション
- 地域別比較
- アジア太平洋:市場規模と予測 2025-2030
- 欧州:市場規模と予測 2025-2030
- 北米:市場規模と予測 2025-2030
- 南米:市場規模と予測 2025-2030
- 中東・アフリカ:市場規模と予測 2025-2030
- 市場機会:地域別
第13章 促進要因、課題、および機会
- 市場促進要因
- 市場の課題
- 促進要因と課題の影響
- 市場機会
第14章 競合情勢
- 概要
- 競合情勢
- 混乱の状況
- 業界のリスク
第15章 競合分析
- 企業プロファイル
- 企業ランキング指標
- 企業の市場ポジショニング
- Aquion Energy
- BYD Co. Ltd.
- EOS Energy Enterprises Inc.
- General Electric Co.
- GS Yuasa International Ltd.
- Hitachi High Tech Corp.
- Leclanche SA
- LG Chem Ltd.
- Panasonic Holdings Corp.
- S and C Electric Co.
- Samsung SDI Co. Ltd.
- Siemens Energy AG
- Tesla Inc.
- TotalEnergies SE
- Wartsila Corp.

