|
|
市場調査レポート
商品コード
1911135
世界の帆船市場2026-2030年Global Sailboat Market 2026-2030 |
||||||
|
|||||||
カスタマイズ可能
|
|||||||

| 世界の帆船市場2026-2030年 |
|
出版日: 2026年01月14日
発行: TechNavio
ページ情報: 英文 277 Pages
納期: 即納可能
|

概要
世界のヨット市場は、2025年から2030年の間に5億1,460万米ドルの成長が見込まれており、予測期間中のCAGRは1.5%と予測されています。
本報告書では、世界のヨット市場に関する包括的な分析、市場規模と予測、動向、成長要因、課題に加え、約25社のベンダー分析を提供しております。
本レポートは、現在の市場状況、最新の動向と促進要因、市場環境全般に関する最新の分析を提供します。市場は、レクリエーション観光の増加、デジタルマーケティングとソーシャルメディアの利用拡大、富裕層人口の増加によって牽引されています。
本調査は、業界の主要関係者からの情報を含む、一次情報と二次情報の客観的な組み合わせを用いて実施されました。本レポートには、主要企業の分析に加え、包括的な市場規模データ、地域別分析を伴うセグメント、ベンダー情勢が含まれています。レポートには過去データと予測データが掲載されています。
| 市場範囲 | |
|---|---|
| 基準年 | 2026年 |
| 終了年 | 2030年 |
| 予測期間 | 2026-2030 |
| 成長モメンタム | 加速 |
| 前年比2026年 | 1.5% |
| CAGR | 1.5% |
| 増分額 | 5億1,460万米ドル |
本調査では、電子貨物書類の導入が今後数年間における世界のヨット市場成長を牽引する主要要因の一つであると特定しております。また、海運分野におけるブロックチェーン技術の導入とモーターヨットの販売増加が、市場における相当な需要創出につながると見込まれます。
目次
第1章 エグゼクティブサマリー
- 市場概要
第2章 Technavio分析
- 価格・ライフサイクル・顧客購入バスケット・採用率・購入基準の分析
- インプットの重要性と差別化の要因
- 混乱の要因
- 促進要因と課題の影響
第3章 市場情勢
- 市場エコシステム
- 市場の特徴
- バリューチェーン分析
第4章 市場規模
- 市場の定義
- 市場セグメント分析
- 市場規模 2025
- 市場の見通し 2025-2030
第5章 市場規模実績
- 世界の帆船市場 2020-2024
- タイプセグメント分析 2020-2024
- 製品セグメント分析 2020-2024
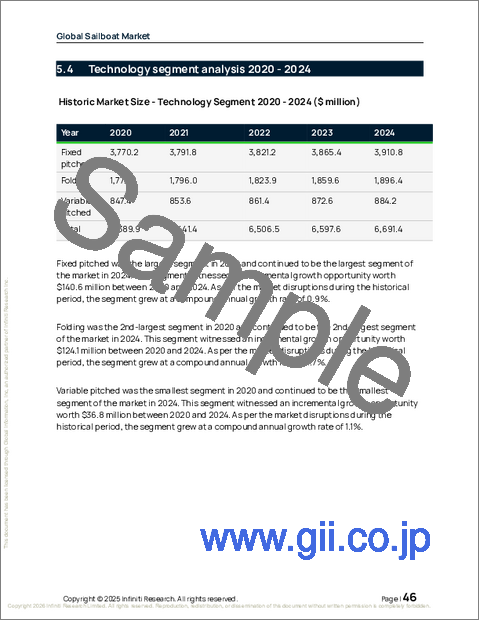
- 技術セグメント分析 2020-2024
- 地域別セグメント分析 2020-2024
- 国別セグメント分析 2020-2024
第6章 定性分析
- AIの影響:世界の帆船市場
第7章 ファイブフォース分析
- ファイブフォースの要約
- 買い手の交渉力
- 供給企業の交渉力
- 新規参入業者の脅威
- 代替品の脅威
- 競争の脅威
- 市況
第8章 市場セグメンテーション:タイプ別
- 市場セグメント
- 比較:タイプ別
- モノハル:市場規模と予測 2025-2030
- マルチハル:市場規模と予測 2025-2030
- 市場機会:タイプ別
第9章 市場セグメンテーション:製品別
- 市場セグメント
- 比較:製品別
- 20~50フィート:市場規模と予測 2025-2030
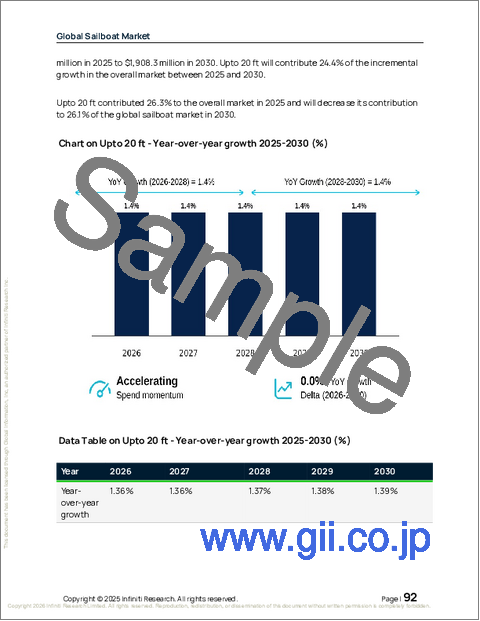
- 20フィート以下:市場規模と予測 2025-2030
- 50フィート超:市場規模と予測 2025-2030
- 市場機会:製品別
第10章 市場セグメンテーション:技術別
- 市場セグメント
- 比較:技術別
- 固定ピッチ:市場規模と予測 2025-2030
- 折り畳み式:市場規模と予測 2025-2030
- 可変ピッチ:市場規模と予測 2025-2030
- 市場機会:技術別
第11章 顧客情勢
- 顧客情勢の概要
第12章 地域別情勢
- 地域別セグメンテーション
- 地域別比較
- 北米:市場規模と予測 2025-2030
- 欧州:市場規模と予測 2025-2030
- アジア太平洋:市場規模と予測 2025-2030
- 南米:市場規模と予測 2025-2030
- 中東・アフリカ:市場規模と予測 2025-2030
- 市場機会:地域別
第13章 促進要因、課題、および機会
- 市場促進要因
- 市場の課題
- 促進要因と課題の影響
- 市場機会
第14章 競合情勢
- 概要
- 競合情勢
- 混乱の状況
- 業界のリスク
第15章 競合分析
- 企業プロファイル
- 企業ランキング指数
- 企業の市場ポジショニング
- Arcona Yachts AB
- Bavaria Yachtbau GmbH
- Black Pepper Yachts
- Cantiere del Pardo Spa
- Doomernik Yachts
- FAR EAST YACHTS Australia
- Fountaine Pajot SA
- Groupe Beneteau
- Hallberg Rassy Varvs AB
- HanseYachts AG
- Marlow Hunter LLC
- McConaght Boats
- MCP YACHTS
- QUANTBOATS AG
- WeiChai Holding Group Co. Ltd.

