|
|
市場調査レポート
商品コード
1908828
自動車用インテリジェントバックミラーの世界市場、2026年~2030年Global Automotive Intelligent Rearview Mirror Market 2026-2030 |
||||||

|
|||||||
カスタマイズ可能
|
|||||||

| 自動車用インテリジェントバックミラーの世界市場、2026年~2030年 |
|
出版日: 2026年01月14日
発行: TechNavio
ページ情報: 英文 297 Pages
納期: 即納可能
|

概要
世界の自動車用インテリジェントバックミラー市場は、2025年から2030年の間に22億9,810万米ドル規模で成長し、予測期間中のCAGRは21.0%に達すると予測されています。
本報告書では、世界の自動車用インテリジェントバックミラー市場に関する包括的な分析、市場規模と予測、動向、成長要因、課題に加え、約25社のベンダー分析を提供しています。
本レポートは、現在の市場状況、最新の市場動向と促進要因、市場環境全般に関する最新の分析を提供します。市場の成長は、高級車の普及拡大、ADAS(先進運転支援システム)およびセンサーフュージョンとの統合、空力効率の向上、自動車セクターの電動化によって牽引されています。
本調査は、業界の主要関係者からの情報を含む、一次情報と二次情報の客観的な組み合わせを用いて実施されました。本レポートには、主要企業の分析に加え、包括的な市場規模データ、地域別分析を伴うセグメント、ベンダー情勢が含まれています。レポートには過去データと予測データが掲載されています。
| 市場範囲 | |
|---|---|
| 基準年 | 2026年 |
| 終了年 | 2030年 |
| 予測期間 | 2026年~2030年 |
| 成長モメンタム | 加速 |
| 前年比2026年 | 19% |
| CAGR | 21% |
| 増分額 | 22億9,810万米ドル |
本調査では、生体認証とドライバー監視システムの統合が、今後数年間における世界の自動車用インテリジェントバックミラー市場の成長を牽引する主要な要因の一つであると特定しています。また、拡張現実(AR)オーバーレイ、強化されたナビゲーションディスプレイ、クラウド接続性、および無線更新(OTA)機能も、市場において相当な需要を生み出すと予想されます。
目次
第1章 エグゼクティブサマリー
第2章 Technavio分析
- 価格反応性・ライフサイクル・顧客購入バスケット・採用率・購入基準の分析
- インプットの重要性と差別化の要因
- 混乱の要因
- 促進要因と課題の影響
第3章 市場情勢
- 市場エコシステム
- 市場の特徴
- バリューチェーン分析
第4章 市場規模
- 市場の定義
- 市場セグメント分析
- 市場規模、2025年
- 市場の見通し、2025年~2030年
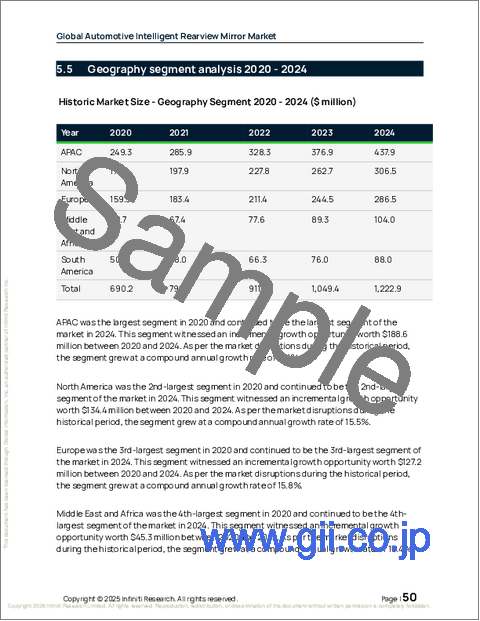
第5章 市場規模実績
- 世界の自動車用インテリジェントバックミラー市場、2020年~2024年
- 用途別セグメント分析、2020年~2024年
- チャネルセグメント分析、2020年~2024年
- パワートレインタイプセグメント分析、2020年~2024年
- 地域別セグメント分析、2020年~2024年
- 国別セグメント分析、2020年~2024年
第6章 定性分析
- 世界の自動車用インテリジェントバックミラー市場へのAIの影響
第7章 ファイブフォース分析
- ファイブフォースの要約
- 買い手の交渉力
- 供給企業の交渉力
- 新規参入業者の脅威
- 代替品の脅威
- 競争の脅威
- 市況
第8章 市場セグメンテーション:用途別
- 比較:用途別
- 乗用車
- 商用車
- 市場機会:用途別
第9章 市場セグメンテーション:チャネル別
- 比較:チャネル別
- OEM
- アフターマーケット
- 市場機会:チャネル別
第10章 市場セグメンテーション:パワートレインタイプ別
- 比較:パワートレインタイプ別
- 内燃機関(ICE)
- 電気式
- 市場機会:パワートレインタイプ別
第11章 顧客情勢
第12章 地域別情勢
- 地域別セグメンテーション
- 地域別比較
- アジア太平洋地域
- 中国
- 日本
- インド
- 韓国
- オーストラリア
- インドネシア
- 北米
- 米国
- カナダ
- メキシコ
- 欧州
- ドイツ
- イギリス
- フランス
- イタリア
- スペイン
- オランダ
- 中東・アフリカ
- サウジアラビア
- 南アフリカ
- UAE
- トルコ
- エジプト
- 南米
- ブラジル
- アルゼンチン
- チリ
- 市場機会:地域別
第13章 促進要因、課題、機会
- 市場促進要因
- 市場の課題
- 促進要因と課題の影響
- 市場機会
第14章 競合情勢
- 概要
- 競合情勢
- 混乱の状況
- 業界のリスク
第15章 競合分析
- 企業プロファイル
- 企業ランキング指標
- 企業の市場ポジショニング
- Continental AG
- Ford Motor Co.
- Gentex Corp.
- KDC Auto Industry Co.
- Magna International Inc.
- MEKRA Lang GmbH and Co. KG
- Murakami Corp.
- Nissan Motor Co. Ltd.
- Panasonic Holdings Corp.
- Pioneer Corp.
- Robert Bosch GmbH
- Samsung Electronics Co. Ltd.
- Valeo SA
- Varroc Engineering Ltd.
- VOXX International Corp.
