|
|
市場調査レポート
商品コード
1583027
熱処理用空気濾過の世界市場、2024~2028年Global Thermal Treatment Air Filtration Market 2024-2028 |
||||||

|
|||||||
カスタマイズ可能
|
|||||||


| 熱処理用空気濾過の世界市場、2024~2028年 |
|
出版日: 2024年08月19日
発行: TechNavio
ページ情報: 英文 179 Pages
納期: 即納可能
|

全表示
- 概要
- 図表
- 目次
熱処理用空気濾過市場、2024~2028年
熱処理用空気濾過市場は2023~2028年に14億6,590万米ドル、予測期間中のCAGRは6.35%で成長すると予測されます。当レポートでは、熱処理用空気濾過市場の全体的な分析、市場規模・予測、動向、成長促進要因、課題、約25のベンダーを網羅したベンダー分析などを掲載しています。
現在の市場シナリオ、最新動向と促進要因、市場環境全体に関する最新分析を提供しています。厳しい環境規制、上下水道処理の拡大、高効率化へのニーズが市場を牽引しています。
| 市場範囲 | |
|---|---|
| 基準年 | 2024年 |
| 終了年 | 2028年 |
| 予測期間 | 2024~2028年 |
| 成長モメンタム | 加速 |
| 前年比[2024年] | 5.55% |
| CAGR | 6.35% |
| 増分額 | 14億6,590万米ドル |
本調査では、今後数年間の熱処理用空気濾過市場成長を牽引する主要要因の一つとして、石油精製の拡大を挙げています。また、原油価格の低迷とエンド・ツー・エンドサービスに対する需要の高さも、市場の大きな需要につながると考えられます。
目次
第1章 エグゼクティブサマリー
- 市場概要
第2章 市場情勢
- 市場エコシステム
- 市場の特徴
- バリューチェーン分析
第3章 市場規模の評価
- 市場の定義
- 市場セグメント分析
- 市場規模 2023年
- 市場の展望 2023~2028年
第4章 市場規模実績
- 熱処理用空気濾過の世界市場 2018~2022年
- エンドユーザー別セグメント分析 2018~2022年
- タイプ別セグメント分析 2018~2022年
- 地域別セグメント分析 2018~2022年
- 国別セグメント分析 2018~2022年
第5章 ファイブフォース分析
- ファイブフォースの要約
- 買い手の交渉力
- 供給企業の交渉力
- 新規参入業者の脅威
- 代替品の脅威
- 競争の脅威
- 市況
第6章 エンドユーザー別市場セグメンテーション
- 市場セグメンテーション
- 比較:エンドユーザー別
- 石油・ガス:市場規模と予測 2023~2028年
- 化学薬品:市場規模と予測 2023~2028年
- 輸送:市場規模と予測 2023~2028年
- パルプと紙:市場規模と予測 2023~2028年
- その他:市場規模と予測 2023~2028年
- エンドユーザー別の市場機会
第7章 タイプ別市場セグメンテーション
- 市場セグメンテーション
- 比較:タイプ別
- RTO:市場規模と予測 2023~2028年
- 熱酸化装置:市場規模と予測 2023~2028年
- 触媒酸化装置:市場規模と予測 2023~2028年
- RCO:市場規模と予測 2023~2028年
- タイプ別の市場機会
第8章 顧客情勢
- 顧客情勢概要
第9章 地域別情勢
- 地域別セグメンテーション
- 比較:地域別
- アジア太平洋:市場規模と予測 2023~2028年
- 北米:市場規模と予測 2023~2028年
- 欧州:市場規模と予測 2023~2028年
- 中東・アフリカ:市場規模と予測 2023~2028年
- 南米:市場規模と予測 2023~2028年
- 中国:市場規模と予測 2023~2028年
- 米国:市場規模と予測 2023~2028年
- インド:市場規模と予測 2023~2028年
- ドイツ:市場規模と予測 2023~2028年
- 英国:市場規模と予測 2023~2028年
- 地域情勢別の市場機会
第10章 促進要因・課題・機会・抑制要因
- 市場促進要因
- 市場課題
- 促進要因と課題の影響
- 市場機会・抑制要因
第11章 競合情勢
- 概要
- 競合情勢
- 混乱の状況
- 業界のリスク
第12章 競合分析
- 企業プロファイル
- 企業の市場ポジショニング
- Accurate Thermal Systems LLC
- Air Clear LLC
- Anguil Environmental Systems Inc.
- CECO Environmental Corp.
- COLT TECHNOLOGIES INC.
- CTP Chemisch Thermische Prozesstechnik GmbH.
- Deuring Group GmbH.
- Durr AG
- Freudenberg and Co. KG
- Glenro Inc.
- Koch Industries Inc.
- Taikisha Ltd.
- Tellkamp Systems Inc.
- The CMM Group
- Zeeco Inc.
第13章 付録
Exhibits:
- Exhibits1: Executive Summary - Chart on Market Overview
- Exhibits2: Executive Summary - Data Table on Market Overview
- Exhibits3: Executive Summary - Chart on Global Market Characteristics
- Exhibits4: Executive Summary - Chart on Market By Geographical Landscape
- Exhibits5: Executive Summary - Chart on Market Segmentation by End-user
- Exhibits6: Executive Summary - Chart on Market Segmentation by Type
- Exhibits7: Executive Summary - Chart on Incremental Growth
- Exhibits8: Executive Summary - Data Table on Incremental Growth
- Exhibits9: Executive Summary - Chart on Company Market Positioning
- Exhibits10: Parent Market
- Exhibits11: Data Table on - Parent Market
- Exhibits12: Market characteristics analysis
- Exhibits13: Value Chain Analysis
- Exhibits14: Offerings of companies included in the market definition
- Exhibits15: Market segments
- Exhibits16: Chart on Global - Market size and forecast 2023-2028 ($ million)
- Exhibits17: Data Table on Global - Market size and forecast 2023-2028 ($ million)
- Exhibits18: Chart on Global Market: Year-over-year growth 2023-2028 (%)
- Exhibits19: Data Table on Global Market: Year-over-year growth 2023-2028 (%)
- Exhibits20: Historic Market Size - Data Table on Global Thermal Treatment Air Filtration Market 2018 - 2022 ($ million)
- Exhibits21: Historic Market Size - End-user Segment 2018 - 2022 ($ million)
- Exhibits22: Historic Market Size - Type Segment 2018 - 2022 ($ million)
- Exhibits23: Historic Market Size - Geography Segment 2018 - 2022 ($ million)
- Exhibits24: Historic Market Size - Country Segment 2018 - 2022 ($ million)
- Exhibits25: Five forces analysis - Comparison between 2023 and 2028
- Exhibits26: Bargaining power of buyers - Impact of key factors 2023 and 2028
- Exhibits27: Bargaining power of suppliers - Impact of key factors in 2023 and 2028
- Exhibits28: Threat of new entrants - Impact of key factors in 2023 and 2028
- Exhibits29: Threat of substitutes - Impact of key factors in 2023 and 2028
- Exhibits30: Threat of rivalry - Impact of key factors in 2023 and 2028
- Exhibits31: Chart on Market condition - Five forces 2023 and 2028
- Exhibits32: Chart on End-user - Market share 2023-2028 (%)
- Exhibits33: Data Table on End-user - Market share 2023-2028 (%)
- Exhibits34: Chart on Comparison by End-user
- Exhibits35: Data Table on Comparison by End-user
- Exhibits36: Chart on Oil and gas - Market size and forecast 2023-2028 ($ million)
- Exhibits37: Data Table on Oil and gas - Market size and forecast 2023-2028 ($ million)
- Exhibits38: Chart on Oil and gas - Year-over-year growth 2023-2028 (%)
- Exhibits39: Data Table on Oil and gas - Year-over-year growth 2023-2028 (%)
- Exhibits40: Chart on Chemicals - Market size and forecast 2023-2028 ($ million)
- Exhibits41: Data Table on Chemicals - Market size and forecast 2023-2028 ($ million)
- Exhibits42: Chart on Chemicals - Year-over-year growth 2023-2028 (%)
- Exhibits43: Data Table on Chemicals - Year-over-year growth 2023-2028 (%)
- Exhibits44: Chart on Transportation - Market size and forecast 2023-2028 ($ million)
- Exhibits45: Data Table on Transportation - Market size and forecast 2023-2028 ($ million)
- Exhibits46: Chart on Transportation - Year-over-year growth 2023-2028 (%)
- Exhibits47: Data Table on Transportation - Year-over-year growth 2023-2028 (%)
- Exhibits48: Chart on Pulp and paper - Market size and forecast 2023-2028 ($ million)
- Exhibits49: Data Table on Pulp and paper - Market size and forecast 2023-2028 ($ million)
- Exhibits50: Chart on Pulp and paper - Year-over-year growth 2023-2028 (%)
- Exhibits51: Data Table on Pulp and paper - Year-over-year growth 2023-2028 (%)
- Exhibits52: Chart on Others - Market size and forecast 2023-2028 ($ million)
- Exhibits53: Data Table on Others - Market size and forecast 2023-2028 ($ million)
- Exhibits54: Chart on Others - Year-over-year growth 2023-2028 (%)
- Exhibits55: Data Table on Others - Year-over-year growth 2023-2028 (%)
- Exhibits56: Market opportunity by End-user ($ million)
- Exhibits57: Data Table on Market opportunity by End-user ($ million)
- Exhibits58: Chart on Type - Market share 2023-2028 (%)
- Exhibits59: Data Table on Type - Market share 2023-2028 (%)
- Exhibits60: Chart on Comparison by Type
- Exhibits61: Data Table on Comparison by Type
- Exhibits62: Chart on RTO - Market size and forecast 2023-2028 ($ million)
- Exhibits63: Data Table on RTO - Market size and forecast 2023-2028 ($ million)
- Exhibits64: Chart on RTO - Year-over-year growth 2023-2028 (%)
- Exhibits65: Data Table on RTO - Year-over-year growth 2023-2028 (%)
- Exhibits66: Chart on Thermal oxidizer - Market size and forecast 2023-2028 ($ million)
- Exhibits67: Data Table on Thermal oxidizer - Market size and forecast 2023-2028 ($ million)
- Exhibits68: Chart on Thermal oxidizer - Year-over-year growth 2023-2028 (%)
- Exhibits69: Data Table on Thermal oxidizer - Year-over-year growth 2023-2028 (%)
- Exhibits70: Chart on Catalytic oxidizer - Market size and forecast 2023-2028 ($ million)
- Exhibits71: Data Table on Catalytic oxidizer - Market size and forecast 2023-2028 ($ million)
- Exhibits72: Chart on Catalytic oxidizer - Year-over-year growth 2023-2028 (%)
- Exhibits73: Data Table on Catalytic oxidizer - Year-over-year growth 2023-2028 (%)
- Exhibits74: Chart on RCO - Market size and forecast 2023-2028 ($ million)
- Exhibits75: Data Table on RCO - Market size and forecast 2023-2028 ($ million)
- Exhibits76: Chart on RCO - Year-over-year growth 2023-2028 (%)
- Exhibits77: Data Table on RCO - Year-over-year growth 2023-2028 (%)
- Exhibits78: Market opportunity by Type ($ million)
- Exhibits79: Data Table on Market opportunity by Type ($ million)
- Exhibits80: Analysis of price sensitivity, lifecycle, customer purchase basket, adoption rates, and purchase criteria
- Exhibits81: Chart on Market share By Geographical Landscape 2023-2028 (%)
- Exhibits82: Data Table on Market share By Geographical Landscape 2023-2028 (%)
- Exhibits83: Chart on Geographic comparison
- Exhibits84: Data Table on Geographic comparison
- Exhibits85: Chart on APAC - Market size and forecast 2023-2028 ($ million)
- Exhibits86: Data Table on APAC - Market size and forecast 2023-2028 ($ million)
- Exhibits87: Chart on APAC - Year-over-year growth 2023-2028 (%)
- Exhibits88: Data Table on APAC - Year-over-year growth 2023-2028 (%)
- Exhibits89: Chart on North America - Market size and forecast 2023-2028 ($ million)
- Exhibits90: Data Table on North America - Market size and forecast 2023-2028 ($ million)
- Exhibits91: Chart on North America - Year-over-year growth 2023-2028 (%)
- Exhibits92: Data Table on North America - Year-over-year growth 2023-2028 (%)
- Exhibits93: Chart on Europe - Market size and forecast 2023-2028 ($ million)
- Exhibits94: Data Table on Europe - Market size and forecast 2023-2028 ($ million)
- Exhibits95: Chart on Europe - Year-over-year growth 2023-2028 (%)
- Exhibits96: Data Table on Europe - Year-over-year growth 2023-2028 (%)
- Exhibits97: Chart on Middle East and Africa - Market size and forecast 2023-2028 ($ million)
- Exhibits98: Data Table on Middle East and Africa - Market size and forecast 2023-2028 ($ million)
- Exhibits99: Chart on Middle East and Africa - Year-over-year growth 2023-2028 (%)
- Exhibits100: Data Table on Middle East and Africa - Year-over-year growth 2023-2028 (%)
- Exhibits101: Chart on South America - Market size and forecast 2023-2028 ($ million)
- Exhibits102: Data Table on South America - Market size and forecast 2023-2028 ($ million)
- Exhibits103: Chart on South America - Year-over-year growth 2023-2028 (%)
- Exhibits104: Data Table on South America - Year-over-year growth 2023-2028 (%)
- Exhibits105: Chart on China - Market size and forecast 2023-2028 ($ million)
- Exhibits106: Data Table on China - Market size and forecast 2023-2028 ($ million)
- Exhibits107: Chart on China - Year-over-year growth 2023-2028 (%)
- Exhibits108: Data Table on China - Year-over-year growth 2023-2028 (%)
- Exhibits109: Chart on US - Market size and forecast 2023-2028 ($ million)
- Exhibits110: Data Table on US - Market size and forecast 2023-2028 ($ million)
- Exhibits111: Chart on US - Year-over-year growth 2023-2028 (%)
- Exhibits112: Data Table on US - Year-over-year growth 2023-2028 (%)
- Exhibits113: Chart on India - Market size and forecast 2023-2028 ($ million)
- Exhibits114: Data Table on India - Market size and forecast 2023-2028 ($ million)
- Exhibits115: Chart on India - Year-over-year growth 2023-2028 (%)
- Exhibits116: Data Table on India - Year-over-year growth 2023-2028 (%)
- Exhibits117: Chart on Germany - Market size and forecast 2023-2028 ($ million)
- Exhibits118: Data Table on Germany - Market size and forecast 2023-2028 ($ million)
- Exhibits119: Chart on Germany - Year-over-year growth 2023-2028 (%)
- Exhibits120: Data Table on Germany - Year-over-year growth 2023-2028 (%)
- Exhibits121: Chart on UK - Market size and forecast 2023-2028 ($ million)
- Exhibits122: Data Table on UK - Market size and forecast 2023-2028 ($ million)
- Exhibits123: Chart on UK - Year-over-year growth 2023-2028 (%)
- Exhibits124: Data Table on UK - Year-over-year growth 2023-2028 (%)
- Exhibits125: Market opportunity By Geographical Landscape ($ million)
- Exhibits126: Data Tables on Market opportunity By Geographical Landscape ($ million)
- Exhibits127: Impact of drivers and challenges in 2023 and 2028
- Exhibits128: Overview on criticality of inputs and factors of differentiation
- Exhibits129: Overview on factors of disruption
- Exhibits130: Impact of key risks on business
- Exhibits131: Companies covered
- Exhibits132: Matrix on companies position and classification
- Exhibits133: Accurate Thermal Systems LLC - Overview
- Exhibits134: Accurate Thermal Systems LLC - Product / Service
- Exhibits135: Accurate Thermal Systems LLC - Key offerings
- Exhibits136: Air Clear LLC - Overview
- Exhibits137: Air Clear LLC - Product / Service
- Exhibits138: Air Clear LLC - Key offerings
- Exhibits139: Anguil Environmental Systems Inc. - Overview
- Exhibits140: Anguil Environmental Systems Inc. - Product / Service
- Exhibits141: Anguil Environmental Systems Inc. - Key offerings
- Exhibits142: CECO Environmental Corp. - Overview
- Exhibits143: CECO Environmental Corp. - Business segments
- Exhibits144: CECO Environmental Corp. - Key offerings
- Exhibits145: CECO Environmental Corp. - Segment focus
- Exhibits146: COLT TECHNOLOGIES INC. - Overview
- Exhibits147: COLT TECHNOLOGIES INC. - Product / Service
- Exhibits148: COLT TECHNOLOGIES INC. - Key offerings
- Exhibits149: CTP Chemisch Thermische Prozesstechnik GmbH. - Overview
- Exhibits150: CTP Chemisch Thermische Prozesstechnik GmbH. - Product / Service
- Exhibits151: CTP Chemisch Thermische Prozesstechnik GmbH. - Key offerings
- Exhibits152: Deuring Group GmbH. - Overview
- Exhibits153: Deuring Group GmbH. - Product / Service
- Exhibits154: Deuring Group GmbH. - Key offerings
- Exhibits155: Durr AG - Overview
- Exhibits156: Durr AG - Business segments
- Exhibits157: Durr AG - Key offerings
- Exhibits158: Durr AG - Segment focus
- Exhibits159: Freudenberg and Co. KG - Overview
- Exhibits160: Freudenberg and Co. KG - Product / Service
- Exhibits161: Freudenberg and Co. KG - Key news
- Exhibits162: Freudenberg and Co. KG - Key offerings
- Exhibits163: Glenro Inc. - Overview
- Exhibits164: Glenro Inc. - Product / Service
- Exhibits165: Glenro Inc. - Key offerings
- Exhibits166: Koch Industries Inc. - Overview
- Exhibits167: Koch Industries Inc. - Product / Service
- Exhibits168: Koch Industries Inc. - Key offerings
- Exhibits169: Taikisha Ltd. - Overview
- Exhibits170: Taikisha Ltd. - Product / Service
- Exhibits171: Taikisha Ltd. - Key offerings
- Exhibits172: Tellkamp Systems Inc. - Overview
- Exhibits173: Tellkamp Systems Inc. - Product / Service
- Exhibits174: Tellkamp Systems Inc. - Key offerings
- Exhibits175: The CMM Group - Overview
- Exhibits176: The CMM Group - Product / Service
- Exhibits177: The CMM Group - Key offerings
- Exhibits178: Zeeco Inc. - Overview
- Exhibits179: Zeeco Inc. - Product / Service
- Exhibits180: Zeeco Inc. - Key offerings
- Exhibits181: Inclusions checklist
- Exhibits182: Exclusions checklist
- Exhibits183: Currency conversion rates for US$
- Exhibits184: Research methodology
- Exhibits185: Information sources
- Exhibits186: Data validation
- Exhibits187: Validation techniques employed for market sizing
- Exhibits188: Data synthesis
- Exhibits189: 360 degree market analysis
- Exhibits190: List of abbreviations
Thermal Treatment Air Filtration Market 2024-2028
The thermal treatment air filtration market is forecasted to grow by USD 1465.9 mn during 2023-2028, accelerating at a CAGR of 6.35% during the forecast period. The report on the thermal treatment air filtration market provides a holistic analysis, market size and forecast, trends, growth drivers, and challenges, as well as vendor analysis covering around 25 vendors.
The report offers an up-to-date analysis regarding the current market scenario, the latest trends and drivers, and the overall market environment. The market is driven by stringent environmental regulations, expanding water and wastewater treatment, and need for high efficiency.
| Market Scope | |
|---|---|
| Base Year | 2024 |
| End Year | 2028 |
| Series Year | 2024-2028 |
| Growth Momentum | Accelerate |
| YOY 2024 | 5.55% |
| CAGR | 6.35% |
| Incremental Value | $1465.9 mn |
Technavio's thermal treatment air filtration market is segmented as below:
By End-user
- Oil and gas
- Chemicals
- Transportation
- Pulp and paper
- Others
By Type
- RTO
- Thermal oxidizer
- Catalytic oxidizer
- RCO
By Geographical Landscape
- APAC
- North America
- Europe
- Middle East and Africa
- South America
This study identifies the growing petroleum refining as one of the prime reasons driving the thermal treatment air filtration market growth during the next few years. Also, low oil prices and high demand for end-to-end services will lead to sizable demand in the market.
The report on the thermal treatment air filtration market covers the following areas:
- Thermal treatment air filtration market sizing
- Thermal treatment air filtration market forecast
- Thermal treatment air filtration market industry analysis
The vendor analysis is designed to help clients improve their market position, and in line with this, this report provides a detailed analysis of several leading thermal treatment air filtration market vendors that include Accurate Thermal Systems LLC, Air Clear LLC, Anguil Environmental Systems Inc., APC Technologies Inc., Catalytic Products International Inc., CECO Environmental Corp., COLT TECHNOLOGIES INC., CTP Chemisch Thermische Prozesstechnik GmbH., Deuring Group GmbH., Durr AG, FIVES SAS, Freudenberg and Co. KG, Glenro Inc., Koch Industries Inc., Taikisha Ltd., Tellkamp Systems Inc., The CMM Group, and Zeeco Inc.. Also, the thermal treatment air filtration market analysis report includes information on upcoming trends and challenges that will influence market growth. This is to help companies strategize and leverage all forthcoming growth opportunities.
The study was conducted using an objective combination of primary and secondary information including inputs from key participants in the industry. The report contains a comprehensive market and vendor landscape in addition to an analysis of the key vendors.
It presents various market facets by identifying the key industry influencers. The data presented is comprehensive, reliable, and a result of extensive research - both primary and secondary. The market research reports provide a complete competitive landscape and an in-depth vendor selection methodology and analysis using qualitative and quantitative research to forecast the accurate market growth.
Table of Contents
1 Executive Summary
- 1.1 Market overview
- Executive Summary - Chart on Market Overview
- Executive Summary - Data Table on Market Overview
- Executive Summary - Chart on Global Market Characteristics
- Executive Summary - Chart on Market By Geographical Landscape
- Executive Summary - Chart on Market Segmentation by End-user
- Executive Summary - Chart on Market Segmentation by Type
- Executive Summary - Chart on Incremental Growth
- Executive Summary - Data Table on Incremental Growth
- Executive Summary - Chart on Company Market Positioning
2 Market Landscape
- 2.1 Market ecosystem
- Parent Market
- Data Table on - Parent Market
- 2.2 Market characteristics
- Market characteristics analysis
- 2.3 Value chain analysis
- Value Chain Analysis
3 Market Sizing
- 3.1 Market definition
- Offerings of companies included in the market definition
- 3.2 Market segment analysis
- Market segments
- 3.3 Market size 2023
- 3.4 Market outlook: Forecast for 2023-2028
- Chart on Global - Market size and forecast 2023-2028 ($ million)
- Data Table on Global - Market size and forecast 2023-2028 ($ million)
- Chart on Global Market: Year-over-year growth 2023-2028 (%)
- Data Table on Global Market: Year-over-year growth 2023-2028 (%)
4 Historic Market Size
- 4.1 Global Thermal Treatment Air Filtration Market 2018 - 2022
- Historic Market Size - Data Table on Global Thermal Treatment Air Filtration Market 2018 - 2022 ($ million)
- 4.2 End-user segment analysis 2018 - 2022
- Historic Market Size - End-user Segment 2018 - 2022 ($ million)
- 4.3 Type segment analysis 2018 - 2022
- Historic Market Size - Type Segment 2018 - 2022 ($ million)
- 4.4 Geography segment analysis 2018 - 2022
- Historic Market Size - Geography Segment 2018 - 2022 ($ million)
- 4.5 Country segment analysis 2018 - 2022
- Historic Market Size - Country Segment 2018 - 2022 ($ million)
5 Five Forces Analysis
- 5.1 Five forces summary
- Five forces analysis - Comparison between 2023 and 2028
- 5.2 Bargaining power of buyers
- Bargaining power of buyers - Impact of key factors 2023 and 2028
- 5.3 Bargaining power of suppliers
- Bargaining power of suppliers - Impact of key factors in 2023 and 2028
- 5.4 Threat of new entrants
- Threat of new entrants - Impact of key factors in 2023 and 2028
- 5.5 Threat of substitutes
- Threat of substitutes - Impact of key factors in 2023 and 2028
- 5.6 Threat of rivalry
- Threat of rivalry - Impact of key factors in 2023 and 2028
- 5.7 Market condition
- Chart on Market condition - Five forces 2023 and 2028
6 Market Segmentation by End-user
- 6.1 Market segments
- Chart on End-user - Market share 2023-2028 (%)
- Data Table on End-user - Market share 2023-2028 (%)
- 6.2 Comparison by End-user
- Chart on Comparison by End-user
- Data Table on Comparison by End-user
- 6.3 Oil and gas - Market size and forecast 2023-2028
- Chart on Oil and gas - Market size and forecast 2023-2028 ($ million)
- Data Table on Oil and gas - Market size and forecast 2023-2028 ($ million)
- Chart on Oil and gas - Year-over-year growth 2023-2028 (%)
- Data Table on Oil and gas - Year-over-year growth 2023-2028 (%)
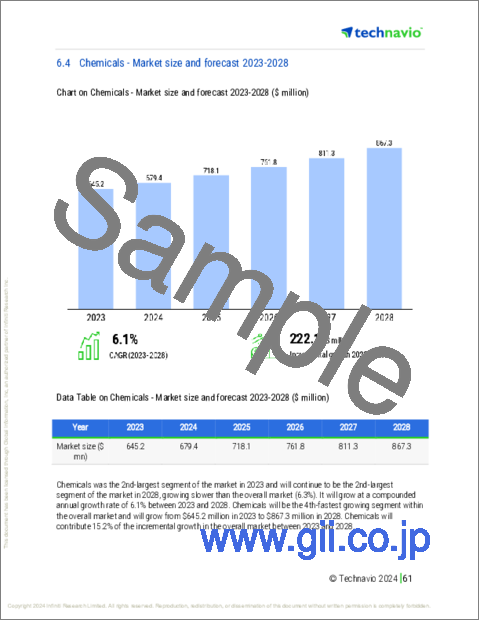
- 6.4 Chemicals - Market size and forecast 2023-2028
- Chart on Chemicals - Market size and forecast 2023-2028 ($ million)
- Data Table on Chemicals - Market size and forecast 2023-2028 ($ million)
- Chart on Chemicals - Year-over-year growth 2023-2028 (%)
- Data Table on Chemicals - Year-over-year growth 2023-2028 (%)
- 6.5 Transportation - Market size and forecast 2023-2028
- Chart on Transportation - Market size and forecast 2023-2028 ($ million)
- Data Table on Transportation - Market size and forecast 2023-2028 ($ million)
- Chart on Transportation - Year-over-year growth 2023-2028 (%)
- Data Table on Transportation - Year-over-year growth 2023-2028 (%)
- 6.6 Pulp and paper - Market size and forecast 2023-2028
- Chart on Pulp and paper - Market size and forecast 2023-2028 ($ million)
- Data Table on Pulp and paper - Market size and forecast 2023-2028 ($ million)
- Chart on Pulp and paper - Year-over-year growth 2023-2028 (%)
- Data Table on Pulp and paper - Year-over-year growth 2023-2028 (%)
- 6.7 Others - Market size and forecast 2023-2028
- Chart on Others - Market size and forecast 2023-2028 ($ million)
- Data Table on Others - Market size and forecast 2023-2028 ($ million)
- Chart on Others - Year-over-year growth 2023-2028 (%)
- Data Table on Others - Year-over-year growth 2023-2028 (%)
- 6.8 Market opportunity by End-user
- Market opportunity by End-user ($ million)
- Data Table on Market opportunity by End-user ($ million)
7 Market Segmentation by Type
- 7.1 Market segments
- Chart on Type - Market share 2023-2028 (%)
- Data Table on Type - Market share 2023-2028 (%)
- 7.2 Comparison by Type
- Chart on Comparison by Type
- Data Table on Comparison by Type
- 7.3 RTO - Market size and forecast 2023-2028
- Chart on RTO - Market size and forecast 2023-2028 ($ million)
- Data Table on RTO - Market size and forecast 2023-2028 ($ million)
- Chart on RTO - Year-over-year growth 2023-2028 (%)
- Data Table on RTO - Year-over-year growth 2023-2028 (%)
- 7.4 Thermal oxidizer - Market size and forecast 2023-2028
- Chart on Thermal oxidizer - Market size and forecast 2023-2028 ($ million)
- Data Table on Thermal oxidizer - Market size and forecast 2023-2028 ($ million)
- Chart on Thermal oxidizer - Year-over-year growth 2023-2028 (%)
- Data Table on Thermal oxidizer - Year-over-year growth 2023-2028 (%)
- 7.5 Catalytic oxidizer - Market size and forecast 2023-2028
- Chart on Catalytic oxidizer - Market size and forecast 2023-2028 ($ million)
- Data Table on Catalytic oxidizer - Market size and forecast 2023-2028 ($ million)
- Chart on Catalytic oxidizer - Year-over-year growth 2023-2028 (%)
- Data Table on Catalytic oxidizer - Year-over-year growth 2023-2028 (%)
- 7.6 RCO - Market size and forecast 2023-2028
- Chart on RCO - Market size and forecast 2023-2028 ($ million)
- Data Table on RCO - Market size and forecast 2023-2028 ($ million)
- Chart on RCO - Year-over-year growth 2023-2028 (%)
- Data Table on RCO - Year-over-year growth 2023-2028 (%)
- 7.7 Market opportunity by Type
- Market opportunity by Type ($ million)
- Data Table on Market opportunity by Type ($ million)
8 Customer Landscape
- 8.1 Customer landscape overview
- Analysis of price sensitivity, lifecycle, customer purchase basket, adoption rates, and purchase criteria
9 Geographic Landscape
- 9.1 Geographic segmentation
- Chart on Market share By Geographical Landscape 2023-2028 (%)
- Data Table on Market share By Geographical Landscape 2023-2028 (%)
- 9.2 Geographic comparison
- Chart on Geographic comparison
- Data Table on Geographic comparison
- 9.3 APAC - Market size and forecast 2023-2028
- Chart on APAC - Market size and forecast 2023-2028 ($ million)
- Data Table on APAC - Market size and forecast 2023-2028 ($ million)
- Chart on APAC - Year-over-year growth 2023-2028 (%)
- Data Table on APAC - Year-over-year growth 2023-2028 (%)
- 9.4 North America - Market size and forecast 2023-2028
- Chart on North America - Market size and forecast 2023-2028 ($ million)
- Data Table on North America - Market size and forecast 2023-2028 ($ million)
- Chart on North America - Year-over-year growth 2023-2028 (%)
- Data Table on North America - Year-over-year growth 2023-2028 (%)
- 9.5 Europe - Market size and forecast 2023-2028
- Chart on Europe - Market size and forecast 2023-2028 ($ million)
- Data Table on Europe - Market size and forecast 2023-2028 ($ million)
- Chart on Europe - Year-over-year growth 2023-2028 (%)
- Data Table on Europe - Year-over-year growth 2023-2028 (%)
- 9.6 Middle East and Africa - Market size and forecast 2023-2028
- Chart on Middle East and Africa - Market size and forecast 2023-2028 ($ million)
- Data Table on Middle East and Africa - Market size and forecast 2023-2028 ($ million)
- Chart on Middle East and Africa - Year-over-year growth 2023-2028 (%)
- Data Table on Middle East and Africa - Year-over-year growth 2023-2028 (%)
- 9.7 South America - Market size and forecast 2023-2028
- Chart on South America - Market size and forecast 2023-2028 ($ million)
- Data Table on South America - Market size and forecast 2023-2028 ($ million)
- Chart on South America - Year-over-year growth 2023-2028 (%)
- Data Table on South America - Year-over-year growth 2023-2028 (%)
- 9.8 China - Market size and forecast 2023-2028
- Chart on China - Market size and forecast 2023-2028 ($ million)
- Data Table on China - Market size and forecast 2023-2028 ($ million)
- Chart on China - Year-over-year growth 2023-2028 (%)
- Data Table on China - Year-over-year growth 2023-2028 (%)
- 9.9 US - Market size and forecast 2023-2028
- Chart on US - Market size and forecast 2023-2028 ($ million)
- Data Table on US - Market size and forecast 2023-2028 ($ million)
- Chart on US - Year-over-year growth 2023-2028 (%)
- Data Table on US - Year-over-year growth 2023-2028 (%)
- 9.10 India - Market size and forecast 2023-2028
- Chart on India - Market size and forecast 2023-2028 ($ million)
- Data Table on India - Market size and forecast 2023-2028 ($ million)
- Chart on India - Year-over-year growth 2023-2028 (%)
- Data Table on India - Year-over-year growth 2023-2028 (%)
- 9.11 Germany - Market size and forecast 2023-2028
- Chart on Germany - Market size and forecast 2023-2028 ($ million)
- Data Table on Germany - Market size and forecast 2023-2028 ($ million)
- Chart on Germany - Year-over-year growth 2023-2028 (%)
- Data Table on Germany - Year-over-year growth 2023-2028 (%)
- 9.12 UK - Market size and forecast 2023-2028
- Chart on UK - Market size and forecast 2023-2028 ($ million)
- Data Table on UK - Market size and forecast 2023-2028 ($ million)
- Chart on UK - Year-over-year growth 2023-2028 (%)
- Data Table on UK - Year-over-year growth 2023-2028 (%)
- 9.13 Market opportunity By Geographical Landscape
- Market opportunity By Geographical Landscape ($ million)
- Data Tables on Market opportunity By Geographical Landscape ($ million)
10 Drivers, Challenges, and Opportunity/Restraints
- 10.1 Market drivers
- 10.2 Market challenges
- 10.3 Impact of drivers and challenges
- Impact of drivers and challenges in 2023 and 2028
- 10.4 Market opportunities/restraints
11 Competitive Landscape
- 11.1 Overview
- 11.2 Competitive Landscape
- Overview on criticality of inputs and factors of differentiation
- 11.3 Landscape disruption
- Overview on factors of disruption
- 11.4 Industry risks
- Impact of key risks on business
12 Competitive Analysis
- 12.1 Companies profiled
- Companies covered
- 12.2 Market positioning of companies
- Matrix on companies position and classification
- 12.3 Accurate Thermal Systems LLC
- Accurate Thermal Systems LLC - Overview
- Accurate Thermal Systems LLC - Product / Service
- Accurate Thermal Systems LLC - Key offerings
- 12.4 Air Clear LLC
- Air Clear LLC - Overview
- Air Clear LLC - Product / Service
- Air Clear LLC - Key offerings
- 12.5 Anguil Environmental Systems Inc.
- Anguil Environmental Systems Inc. - Overview
- Anguil Environmental Systems Inc. - Product / Service
- Anguil Environmental Systems Inc. - Key offerings
- 12.6 CECO Environmental Corp.
- CECO Environmental Corp. - Overview
- CECO Environmental Corp. - Business segments
- CECO Environmental Corp. - Key offerings
- CECO Environmental Corp. - Segment focus
- 12.7 COLT TECHNOLOGIES INC.
- COLT TECHNOLOGIES INC. - Overview
- COLT TECHNOLOGIES INC. - Product / Service
- COLT TECHNOLOGIES INC. - Key offerings
- 12.8 CTP Chemisch Thermische Prozesstechnik GmbH.
- CTP Chemisch Thermische Prozesstechnik GmbH. - Overview
- CTP Chemisch Thermische Prozesstechnik GmbH. - Product / Service
- CTP Chemisch Thermische Prozesstechnik GmbH. - Key offerings
- 12.9 Deuring Group GmbH.
- Deuring Group GmbH. - Overview
- Deuring Group GmbH. - Product / Service
- Deuring Group GmbH. - Key offerings
- 12.10 Durr AG
- Durr AG - Overview
- Durr AG - Business segments
- Durr AG - Key offerings
- Durr AG - Segment focus
- 12.11 Freudenberg and Co. KG
- Freudenberg and Co. KG - Overview
- Freudenberg and Co. KG - Product / Service
- Freudenberg and Co. KG - Key news
- Freudenberg and Co. KG - Key offerings
- 12.12 Glenro Inc.
- Glenro Inc. - Overview
- Glenro Inc. - Product / Service
- Glenro Inc. - Key offerings
- 12.13 Koch Industries Inc.
- Koch Industries Inc. - Overview
- Koch Industries Inc. - Product / Service
- Koch Industries Inc. - Key offerings
- 12.14 Taikisha Ltd.
- Taikisha Ltd. - Overview
- Taikisha Ltd. - Product / Service
- Taikisha Ltd. - Key offerings
- 12.15 Tellkamp Systems Inc.
- Tellkamp Systems Inc. - Overview
- Tellkamp Systems Inc. - Product / Service
- Tellkamp Systems Inc. - Key offerings
- 12.16 The CMM Group
- The CMM Group - Overview
- The CMM Group - Product / Service
- The CMM Group - Key offerings
- 12.17 Zeeco Inc.
- Zeeco Inc. - Overview
- Zeeco Inc. - Product / Service
- Zeeco Inc. - Key offerings
13 Appendix
- 13.1 Scope of the report
- 13.2 Inclusions and exclusions checklist
- Inclusions checklist
- Exclusions checklist
- 13.3 Currency conversion rates for US$
- Currency conversion rates for US$
- 13.4 Research methodology
- Research methodology
- 13.5 Data procurement
- Information sources
- 13.6 Data validation
- Data validation
- 13.7 Validation techniques employed for market sizing
- Validation techniques employed for market sizing
- 13.8 Data synthesis
- Data synthesis
- 13.9 360 degree market analysis
- 360 degree market analysis
- 13.10 List of abbreviations
- List of abbreviations
