|
|
市場調査レポート
商品コード
1583017
スピルリナ・チョコレートの世界市場 2024-2028年Global Spirulina Chocolates Market 2024-2028 |
||||||
|
|||||||
カスタマイズ可能
|
|||||||


| スピルリナ・チョコレートの世界市場 2024-2028年 |
|
出版日: 2024年08月15日
発行: TechNavio
ページ情報: 英文 160 Pages
納期: 即納可能
|

全表示
- 概要
- 図表
- 目次
スピルリナ・チョコレート市場は2023-2028年に2億5,200万米ドル、予測期間中のCAGRは10.87%で成長すると予測されます。
当レポートでは、スピルリナ・チョコレート市場の全体的な分析、市場規模・予測、動向、成長促進要因、課題、約25のベンダーを網羅したベンダー分析などを掲載しています。
現在の市場シナリオ、最新動向と促進要因、市場環境全体に関する最新分析を提供しています。市場は、栄養失調の有病率の増加、スピルリナ製品に関連付けられている健康上の利点、およびスピルリナの生産を促進するための政府の支援によって駆動されます。
| 市場範囲 | |
|---|---|
| 基準年 | 2024 |
| 終了年 | 2028 |
| 予測期間 | 2024-2028 |
| 成長モメンタム | 加速 |
| 前年比2024年 | 9.54% |
| CAGR | 10.87% |
| 増分額 | 2億5,200万米ドル |
本調査では、今後数年間のスピルリナ・チョコレート市場の成長を促進する主な要因の1つとして、ベンダーが採用するビジネス戦略を挙げています。また、個人消費の増加やオンライン小売の普及が、市場の大きな需要につながると思われます。
目次
第1章 エグゼクティブサマリー
- 市場概要
第2章 市場情勢
- 市場エコシステム
- 市場の特徴
- バリューチェーン分析
第3章 市場規模の評価
- 市場の定義
- 市場セグメント分析
- 市場規模 2023
- 市場の見通し 2023-2028
第4章 市場規模実績
- スピルリナ・チョコレートの世界市場 2018-2022
- 流通チャネル別セグメント分析 2018-2022
- タイプ別セグメント分析 2018-2022
- 地域別セグメント分析 2018-2022
- 国別セグメント分析 2018-2022
第5章 ファイブフォース分析
- ファイブフォースの要約
- 買い手の交渉力
- 供給企業の交渉力
- 新規参入業者の脅威
- 代替品の脅威
- 競争の脅威
- 市況
第6章 市場セグメンテーション:流通チャネル別
- 市場セグメンテーション
- 比較:流通チャネル別
- オフライン:市場規模と予測 2023-2028
- オンライン:市場規模と予測 2023-2028
- 流通チャネル別の市場機会
第7章 市場セグメンテーション:タイプ別
- 市場セグメンテーション
- 比較:タイプ別
- チョコレートバー:市場規模と予測 2023-2028
- チョコレートパウダー:市場規模と予測 2023-2028
- タイプ別の市場機会
第8章 顧客情勢
- 顧客情勢の概要
第9章 地域別情勢
- 地域別セグメンテーション
- 地域別比較
- 欧州:市場規模と予測 2023-2028
- 北米:市場規模と予測 2023-2028
- アジア太平洋:市場規模と予測 2023-2028
- 南米:市場規模と予測 2023-2028
- 中東・アフリカ:市場規模と予測 2023-2028
- 米国:市場規模と予測 2023-2028
- ドイツ:市場規模と予測 2023-2028
- 英国:市場規模と予測 2023-2028
- フランス:市場規模と予測 2023-2028
- 中国:市場規模と予測 2023-2028
- 地域情勢別市場機会
第10章 促進要因・課題・機会・抑制要因
- 市場促進要因
- 市場の課題
- 促進要因と課題の影響
- 市場の機会・抑制要因
第11章 競合情勢
- 概要
- 競合情勢
- 混乱の状況
- 業界のリスク
第12章 競合分析
- 企業プロファイル
- 企業の市場ポジショニング
- Akal
- Bio Benjamin
- Giddy Yoyo Inc.
- Healthy Little Vittles
- Landish
- Lifestream NZ
- LUCHINO SRL
- MERAVIGLIE Srl
- Nestle SA
- Nurture Brands Ltd.
- Sari Foods Co
- Sonalis Consumer Product Ltd.
- The Algae Factory BV
- Vosges Haut Chocolat Ltd.
- ZEON BIOTECH PVT LTD.
第13章 付録
Exhibits:
- Exhibits1: Executive Summary - Chart on Market Overview
- Exhibits2: Executive Summary - Data Table on Market Overview
- Exhibits3: Executive Summary - Chart on Global Market Characteristics
- Exhibits4: Executive Summary - Chart on Market By Geographical Landscape
- Exhibits5: Executive Summary - Chart on Market Segmentation by Distribution Channel
- Exhibits6: Executive Summary - Chart on Market Segmentation by Type
- Exhibits7: Executive Summary - Chart on Incremental Growth
- Exhibits8: Executive Summary - Data Table on Incremental Growth
- Exhibits9: Executive Summary - Chart on Company Market Positioning
- Exhibits10: Parent Market
- Exhibits11: Data Table on - Parent Market
- Exhibits12: Market characteristics analysis
- Exhibits13: Value Chain Analysis
- Exhibits14: Offerings of companies included in the market definition
- Exhibits15: Market segments
- Exhibits16: Chart on Global - Market size and forecast 2023-2028 ($ million)
- Exhibits17: Data Table on Global - Market size and forecast 2023-2028 ($ million)
- Exhibits18: Chart on Global Market: Year-over-year growth 2023-2028 (%)
- Exhibits19: Data Table on Global Market: Year-over-year growth 2023-2028 (%)
- Exhibits20: Historic Market Size - Data Table on Global Spirulina Chocolates Market 2018 - 2022 ($ million)
- Exhibits21: Historic Market Size - Distribution Channel Segment 2018 - 2022 ($ million)
- Exhibits22: Historic Market Size - Type Segment 2018 - 2022 ($ million)
- Exhibits23: Historic Market Size - Geography Segment 2018 - 2022 ($ million)
- Exhibits24: Historic Market Size - Country Segment 2018 - 2022 ($ million)
- Exhibits25: Five forces analysis - Comparison between 2023 and 2028
- Exhibits26: Bargaining power of buyers - Impact of key factors 2023 and 2028
- Exhibits27: Bargaining power of suppliers - Impact of key factors in 2023 and 2028
- Exhibits28: Threat of new entrants - Impact of key factors in 2023 and 2028
- Exhibits29: Threat of substitutes - Impact of key factors in 2023 and 2028
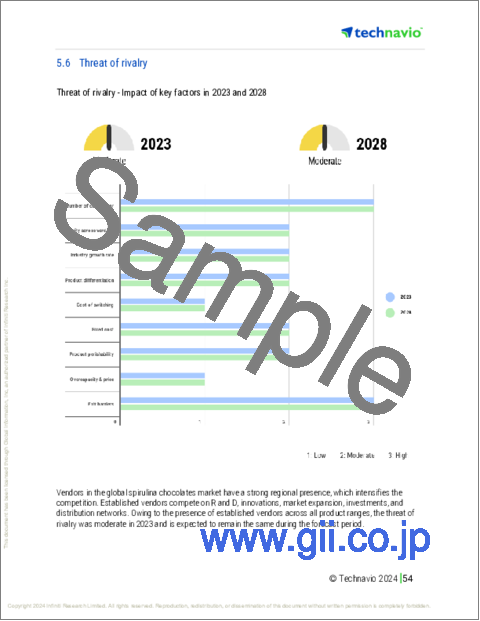
- Exhibits30: Threat of rivalry - Impact of key factors in 2023 and 2028
- Exhibits31: Chart on Market condition - Five forces 2023 and 2028
- Exhibits32: Chart on Distribution Channel - Market share 2023-2028 (%)
- Exhibits33: Data Table on Distribution Channel - Market share 2023-2028 (%)
- Exhibits34: Chart on Comparison by Distribution Channel
- Exhibits35: Data Table on Comparison by Distribution Channel
- Exhibits36: Chart on Offline - Market size and forecast 2023-2028 ($ million)
- Exhibits37: Data Table on Offline - Market size and forecast 2023-2028 ($ million)
- Exhibits38: Chart on Offline - Year-over-year growth 2023-2028 (%)
- Exhibits39: Data Table on Offline - Year-over-year growth 2023-2028 (%)
- Exhibits40: Chart on Online - Market size and forecast 2023-2028 ($ million)
- Exhibits41: Data Table on Online - Market size and forecast 2023-2028 ($ million)
- Exhibits42: Chart on Online - Year-over-year growth 2023-2028 (%)
- Exhibits43: Data Table on Online - Year-over-year growth 2023-2028 (%)
- Exhibits44: Market opportunity by Distribution Channel ($ million)
- Exhibits45: Data Table on Market opportunity by Distribution Channel ($ million)
- Exhibits46: Chart on Type - Market share 2023-2028 (%)
- Exhibits47: Data Table on Type - Market share 2023-2028 (%)
- Exhibits48: Chart on Comparison by Type
- Exhibits49: Data Table on Comparison by Type
- Exhibits50: Chart on Chocolate bars - Market size and forecast 2023-2028 ($ million)
- Exhibits51: Data Table on Chocolate bars - Market size and forecast 2023-2028 ($ million)
- Exhibits52: Chart on Chocolate bars - Year-over-year growth 2023-2028 (%)
- Exhibits53: Data Table on Chocolate bars - Year-over-year growth 2023-2028 (%)
- Exhibits54: Chart on Chocolate powder - Market size and forecast 2023-2028 ($ million)
- Exhibits55: Data Table on Chocolate powder - Market size and forecast 2023-2028 ($ million)
- Exhibits56: Chart on Chocolate powder - Year-over-year growth 2023-2028 (%)
- Exhibits57: Data Table on Chocolate powder - Year-over-year growth 2023-2028 (%)
- Exhibits58: Market opportunity by Type ($ million)
- Exhibits59: Data Table on Market opportunity by Type ($ million)
- Exhibits60: Analysis of price sensitivity, lifecycle, customer purchase basket, adoption rates, and purchase criteria
- Exhibits61: Chart on Market share By Geographical Landscape 2023-2028 (%)
- Exhibits62: Data Table on Market share By Geographical Landscape 2023-2028 (%)
- Exhibits63: Chart on Geographic comparison
- Exhibits64: Data Table on Geographic comparison
- Exhibits65: Chart on Europe - Market size and forecast 2023-2028 ($ million)
- Exhibits66: Data Table on Europe - Market size and forecast 2023-2028 ($ million)
- Exhibits67: Chart on Europe - Year-over-year growth 2023-2028 (%)
- Exhibits68: Data Table on Europe - Year-over-year growth 2023-2028 (%)
- Exhibits69: Chart on North America - Market size and forecast 2023-2028 ($ million)
- Exhibits70: Data Table on North America - Market size and forecast 2023-2028 ($ million)
- Exhibits71: Chart on North America - Year-over-year growth 2023-2028 (%)
- Exhibits72: Data Table on North America - Year-over-year growth 2023-2028 (%)
- Exhibits73: Chart on APAC - Market size and forecast 2023-2028 ($ million)
- Exhibits74: Data Table on APAC - Market size and forecast 2023-2028 ($ million)
- Exhibits75: Chart on APAC - Year-over-year growth 2023-2028 (%)
- Exhibits76: Data Table on APAC - Year-over-year growth 2023-2028 (%)
- Exhibits77: Chart on South America - Market size and forecast 2023-2028 ($ million)
- Exhibits78: Data Table on South America - Market size and forecast 2023-2028 ($ million)
- Exhibits79: Chart on South America - Year-over-year growth 2023-2028 (%)
- Exhibits80: Data Table on South America - Year-over-year growth 2023-2028 (%)
- Exhibits81: Chart on Middle East and Africa - Market size and forecast 2023-2028 ($ million)
- Exhibits82: Data Table on Middle East and Africa - Market size and forecast 2023-2028 ($ million)
- Exhibits83: Chart on Middle East and Africa - Year-over-year growth 2023-2028 (%)
- Exhibits84: Data Table on Middle East and Africa - Year-over-year growth 2023-2028 (%)
- Exhibits85: Chart on US - Market size and forecast 2023-2028 ($ million)
- Exhibits86: Data Table on US - Market size and forecast 2023-2028 ($ million)
- Exhibits87: Chart on US - Year-over-year growth 2023-2028 (%)
- Exhibits88: Data Table on US - Year-over-year growth 2023-2028 (%)
- Exhibits89: Chart on Germany - Market size and forecast 2023-2028 ($ million)
- Exhibits90: Data Table on Germany - Market size and forecast 2023-2028 ($ million)
- Exhibits91: Chart on Germany - Year-over-year growth 2023-2028 (%)
- Exhibits92: Data Table on Germany - Year-over-year growth 2023-2028 (%)
- Exhibits93: Chart on UK - Market size and forecast 2023-2028 ($ million)
- Exhibits94: Data Table on UK - Market size and forecast 2023-2028 ($ million)
- Exhibits95: Chart on UK - Year-over-year growth 2023-2028 (%)
- Exhibits96: Data Table on UK - Year-over-year growth 2023-2028 (%)
- Exhibits97: Chart on France - Market size and forecast 2023-2028 ($ million)
- Exhibits98: Data Table on France - Market size and forecast 2023-2028 ($ million)
- Exhibits99: Chart on France - Year-over-year growth 2023-2028 (%)
- Exhibits100: Data Table on France - Year-over-year growth 2023-2028 (%)
- Exhibits101: Chart on China - Market size and forecast 2023-2028 ($ million)
- Exhibits102: Data Table on China - Market size and forecast 2023-2028 ($ million)
- Exhibits103: Chart on China - Year-over-year growth 2023-2028 (%)
- Exhibits104: Data Table on China - Year-over-year growth 2023-2028 (%)
- Exhibits105: Market opportunity By Geographical Landscape ($ million)
- Exhibits106: Data Tables on Market opportunity By Geographical Landscape ($ million)
- Exhibits107: Impact of drivers and challenges in 2023 and 2028
- Exhibits108: Overview on criticality of inputs and factors of differentiation
- Exhibits109: Overview on factors of disruption
- Exhibits110: Impact of key risks on business
- Exhibits111: Companies covered
- Exhibits112: Matrix on companies position and classification
- Exhibits113: Akal - Overview
- Exhibits114: Akal - Product / Service
- Exhibits115: Akal - Key offerings
- Exhibits116: Bio Benjamin - Overview
- Exhibits117: Bio Benjamin - Product / Service
- Exhibits118: Bio Benjamin - Key offerings
- Exhibits119: Giddy Yoyo Inc. - Overview
- Exhibits120: Giddy Yoyo Inc. - Product / Service
- Exhibits121: Giddy Yoyo Inc. - Key offerings
- Exhibits122: Healthy Little Vittles - Overview
- Exhibits123: Healthy Little Vittles - Product / Service
- Exhibits124: Healthy Little Vittles - Key offerings
- Exhibits125: Landish - Overview
- Exhibits126: Landish - Product / Service
- Exhibits127: Landish - Key offerings
- Exhibits128: Lifestream NZ - Overview
- Exhibits129: Lifestream NZ - Product / Service
- Exhibits130: Lifestream NZ - Key offerings
- Exhibits131: LUCHINO SRL - Overview
- Exhibits132: LUCHINO SRL - Product / Service
- Exhibits133: LUCHINO SRL - Key offerings
- Exhibits134: MERAVIGLIE Srl - Overview
- Exhibits135: MERAVIGLIE Srl - Product / Service
- Exhibits136: MERAVIGLIE Srl - Key offerings
- Exhibits137: Nestle SA - Overview
- Exhibits138: Nestle SA - Business segments
- Exhibits139: Nestle SA - Key news
- Exhibits140: Nestle SA - Key offerings
- Exhibits141: Nestle SA - Segment focus
- Exhibits142: Nurture Brands Ltd. - Overview
- Exhibits143: Nurture Brands Ltd. - Product / Service
- Exhibits144: Nurture Brands Ltd. - Key offerings
- Exhibits145: Sari Foods Co - Overview
- Exhibits146: Sari Foods Co - Product / Service
- Exhibits147: Sari Foods Co - Key offerings
- Exhibits148: Sonalis Consumer Product Ltd. - Overview
- Exhibits149: Sonalis Consumer Product Ltd. - Product / Service
- Exhibits150: Sonalis Consumer Product Ltd. - Key offerings
- Exhibits151: The Algae Factory BV - Overview
- Exhibits152: The Algae Factory BV - Product / Service
- Exhibits153: The Algae Factory BV - Key offerings
- Exhibits154: Vosges Haut Chocolat Ltd. - Overview
- Exhibits155: Vosges Haut Chocolat Ltd. - Product / Service
- Exhibits156: Vosges Haut Chocolat Ltd. - Key offerings
- Exhibits157: ZEON BIOTECH PVT LTD. - Overview
- Exhibits158: ZEON BIOTECH PVT LTD. - Product / Service
- Exhibits159: ZEON BIOTECH PVT LTD. - Key offerings
- Exhibits160: Inclusions checklist
- Exhibits161: Exclusions checklist
- Exhibits162: Currency conversion rates for US$
- Exhibits163: Research methodology
- Exhibits164: Information sources
- Exhibits165: Data validation
- Exhibits166: Validation techniques employed for market sizing
- Exhibits167: Data synthesis
- Exhibits168: 360 degree market analysis
- Exhibits169: List of abbreviations
The spirulina chocolates market is forecasted to grow by USD 252 mn during 2023-2028, accelerating at a CAGR of 10.87% during the forecast period. The report on the spirulina chocolates market provides a holistic analysis, market size and forecast, trends, growth drivers, and challenges, as well as vendor analysis covering around 25 vendors.
The report offers an up-to-date analysis regarding the current market scenario, the latest trends and drivers, and the overall market environment. The market is driven by growing prevalence of malnutrition, health benefits associated with spirulina products, and government support in promoting the production of spirulina.
Technavio's spirulina chocolates market is segmented as below:
| Market Scope | |
|---|---|
| Base Year | 2024 |
| End Year | 2028 |
| Series Year | 2024-2028 |
| Growth Momentum | Accelerate |
| YOY 2024 | 9.54% |
| CAGR | 10.87% |
| Incremental Value | $252 mn |
By Distribution Channel
- Offline
- Online
By Type
- Chocolate bars
- Chocolate powder
By Geographical Landscape
- Europe
- North America
- APAC
- South America
- Middle East and Africa
This study identifies the business strategies adopted by vendors as one of the prime reasons driving the spirulina chocolates market growth during the next few years. Also, increasing consumer spending and increasing popularity of online retailing will lead to sizable demand in the market.
The report on the spirulina chocolates market covers the following areas:
- Spirulina chocolates market sizing
- Spirulina chocolates market forecast
- Spirulina chocolates market industry analysis
The robust vendor analysis is designed to help clients improve their market position, and in line with this, this report provides a detailed analysis of several leading spirulina chocolates market vendors that include Akal, Bio Benjamin, Bloom Delight, Giddy Yoyo Inc., Healthy Little Vittles, Hello Chocolate, Landish, Lifestream NZ, LUCHINO SRL, MERAVIGLIE Srl, Nestle SA, Nurture Brands Ltd., Nutrezy, Pierre Marcolini Group, Sari Foods Co, Sonalis Consumer Product Ltd., Suncore Foods Inc., The Algae Factory BV, Vosges Haut Chocolat Ltd., and ZEON BIOTECH PVT LTD.. Also, the spirulina chocolates market analysis report includes information on upcoming trends and challenges that will influence market growth. This is to help companies strategize and leverage all forthcoming growth opportunities.
The study was conducted using an objective combination of primary and secondary information including inputs from key participants in the industry. The report contains a comprehensive market and vendor landscape in addition to an analysis of the key vendors.
The publisher presents a detailed picture of the market by the way of study, synthesis, and summation of data from multiple sources by an analysis of key parameters such as profit, pricing, competition, and promotions. It presents various market facets by identifying the key industry influencers. The data presented is comprehensive, reliable, and a result of extensive primary and secondary research. The market research reports provide a complete competitive landscape and an in-depth vendor selection methodology and analysis using qualitative and quantitative research to forecast accurate market growth.
Table of Contents
1 Executive Summary
- 1.1 Market overview
- Executive Summary - Chart on Market Overview
- Executive Summary - Data Table on Market Overview
- Executive Summary - Chart on Global Market Characteristics
- Executive Summary - Chart on Market By Geographical Landscape
- Executive Summary - Chart on Market Segmentation by Distribution Channel
- Executive Summary - Chart on Market Segmentation by Type
- Executive Summary - Chart on Incremental Growth
- Executive Summary - Data Table on Incremental Growth
- Executive Summary - Chart on Company Market Positioning
2 Market Landscape
- 2.1 Market ecosystem
- Parent Market
- Data Table on - Parent Market
- 2.2 Market characteristics
- Market characteristics analysis
- 2.3 Value chain analysis
- Value Chain Analysis
3 Market Sizing
- 3.1 Market definition
- Offerings of companies included in the market definition
- 3.2 Market segment analysis
- Market segments
- 3.3 Market size 2023
- 3.4 Market outlook: Forecast for 2023-2028
- Chart on Global - Market size and forecast 2023-2028 ($ million)
- Data Table on Global - Market size and forecast 2023-2028 ($ million)
- Chart on Global Market: Year-over-year growth 2023-2028 (%)
- Data Table on Global Market: Year-over-year growth 2023-2028 (%)
4 Historic Market Size
- 4.1 Global Spirulina Chocolates Market 2018 - 2022
- Historic Market Size - Data Table on Global Spirulina Chocolates Market 2018 - 2022 ($ million)
- 4.2 Distribution Channel segment analysis 2018 - 2022
- Historic Market Size - Distribution Channel Segment 2018 - 2022 ($ million)
- 4.3 Type segment analysis 2018 - 2022
- Historic Market Size - Type Segment 2018 - 2022 ($ million)
- 4.4 Geography segment analysis 2018 - 2022
- Historic Market Size - Geography Segment 2018 - 2022 ($ million)
- 4.5 Country segment analysis 2018 - 2022
- Historic Market Size - Country Segment 2018 - 2022 ($ million)
5 Five Forces Analysis
- 5.1 Five forces summary
- Five forces analysis - Comparison between 2023 and 2028
- 5.2 Bargaining power of buyers
- Bargaining power of buyers - Impact of key factors 2023 and 2028
- 5.3 Bargaining power of suppliers
- Bargaining power of suppliers - Impact of key factors in 2023 and 2028
- 5.4 Threat of new entrants
- Threat of new entrants - Impact of key factors in 2023 and 2028
- 5.5 Threat of substitutes
- Threat of substitutes - Impact of key factors in 2023 and 2028
- 5.6 Threat of rivalry
- Threat of rivalry - Impact of key factors in 2023 and 2028
- 5.7 Market condition
- Chart on Market condition - Five forces 2023 and 2028
6 Market Segmentation by Distribution Channel
- 6.1 Market segments
- Chart on Distribution Channel - Market share 2023-2028 (%)
- Data Table on Distribution Channel - Market share 2023-2028 (%)
- 6.2 Comparison by Distribution Channel
- Chart on Comparison by Distribution Channel
- Data Table on Comparison by Distribution Channel
- 6.3 Offline - Market size and forecast 2023-2028
- Chart on Offline - Market size and forecast 2023-2028 ($ million)
- Data Table on Offline - Market size and forecast 2023-2028 ($ million)
- Chart on Offline - Year-over-year growth 2023-2028 (%)
- Data Table on Offline - Year-over-year growth 2023-2028 (%)
- 6.4 Online - Market size and forecast 2023-2028
- Chart on Online - Market size and forecast 2023-2028 ($ million)
- Data Table on Online - Market size and forecast 2023-2028 ($ million)
- Chart on Online - Year-over-year growth 2023-2028 (%)
- Data Table on Online - Year-over-year growth 2023-2028 (%)
- 6.5 Market opportunity by Distribution Channel
- Market opportunity by Distribution Channel ($ million)
- Data Table on Market opportunity by Distribution Channel ($ million)
7 Market Segmentation by Type
- 7.1 Market segments
- Chart on Type - Market share 2023-2028 (%)
- Data Table on Type - Market share 2023-2028 (%)
- 7.2 Comparison by Type
- Chart on Comparison by Type
- Data Table on Comparison by Type
- 7.3 Chocolate bars - Market size and forecast 2023-2028
- Chart on Chocolate bars - Market size and forecast 2023-2028 ($ million)
- Data Table on Chocolate bars - Market size and forecast 2023-2028 ($ million)
- Chart on Chocolate bars - Year-over-year growth 2023-2028 (%)
- Data Table on Chocolate bars - Year-over-year growth 2023-2028 (%)
- 7.4 Chocolate powder - Market size and forecast 2023-2028
- Chart on Chocolate powder - Market size and forecast 2023-2028 ($ million)
- Data Table on Chocolate powder - Market size and forecast 2023-2028 ($ million)
- Chart on Chocolate powder - Year-over-year growth 2023-2028 (%)
- Data Table on Chocolate powder - Year-over-year growth 2023-2028 (%)
- 7.5 Market opportunity by Type
- Market opportunity by Type ($ million)
- Data Table on Market opportunity by Type ($ million)
8 Customer Landscape
- 8.1 Customer landscape overview
- Analysis of price sensitivity, lifecycle, customer purchase basket, adoption rates, and purchase criteria
9 Geographic Landscape
- 9.1 Geographic segmentation
- Chart on Market share By Geographical Landscape 2023-2028 (%)
- Data Table on Market share By Geographical Landscape 2023-2028 (%)
- 9.2 Geographic comparison
- Chart on Geographic comparison
- Data Table on Geographic comparison
- 9.3 Europe - Market size and forecast 2023-2028
- Chart on Europe - Market size and forecast 2023-2028 ($ million)
- Data Table on Europe - Market size and forecast 2023-2028 ($ million)
- Chart on Europe - Year-over-year growth 2023-2028 (%)
- Data Table on Europe - Year-over-year growth 2023-2028 (%)
- 9.4 North America - Market size and forecast 2023-2028
- Chart on North America - Market size and forecast 2023-2028 ($ million)
- Data Table on North America - Market size and forecast 2023-2028 ($ million)
- Chart on North America - Year-over-year growth 2023-2028 (%)
- Data Table on North America - Year-over-year growth 2023-2028 (%)
- 9.5 APAC - Market size and forecast 2023-2028
- Chart on APAC - Market size and forecast 2023-2028 ($ million)
- Data Table on APAC - Market size and forecast 2023-2028 ($ million)
- Chart on APAC - Year-over-year growth 2023-2028 (%)
- Data Table on APAC - Year-over-year growth 2023-2028 (%)
- 9.6 South America - Market size and forecast 2023-2028
- Chart on South America - Market size and forecast 2023-2028 ($ million)
- Data Table on South America - Market size and forecast 2023-2028 ($ million)
- Chart on South America - Year-over-year growth 2023-2028 (%)
- Data Table on South America - Year-over-year growth 2023-2028 (%)
- 9.7 Middle East and Africa - Market size and forecast 2023-2028
- Chart on Middle East and Africa - Market size and forecast 2023-2028 ($ million)
- Data Table on Middle East and Africa - Market size and forecast 2023-2028 ($ million)
- Chart on Middle East and Africa - Year-over-year growth 2023-2028 (%)
- Data Table on Middle East and Africa - Year-over-year growth 2023-2028 (%)
- 9.8 US - Market size and forecast 2023-2028
- Chart on US - Market size and forecast 2023-2028 ($ million)
- Data Table on US - Market size and forecast 2023-2028 ($ million)
- Chart on US - Year-over-year growth 2023-2028 (%)
- Data Table on US - Year-over-year growth 2023-2028 (%)
- 9.9 Germany - Market size and forecast 2023-2028
- Chart on Germany - Market size and forecast 2023-2028 ($ million)
- Data Table on Germany - Market size and forecast 2023-2028 ($ million)
- Chart on Germany - Year-over-year growth 2023-2028 (%)
- Data Table on Germany - Year-over-year growth 2023-2028 (%)
- 9.10 UK - Market size and forecast 2023-2028
- Chart on UK - Market size and forecast 2023-2028 ($ million)
- Data Table on UK - Market size and forecast 2023-2028 ($ million)
- Chart on UK - Year-over-year growth 2023-2028 (%)
- Data Table on UK - Year-over-year growth 2023-2028 (%)
- 9.11 France - Market size and forecast 2023-2028
- Chart on France - Market size and forecast 2023-2028 ($ million)
- Data Table on France - Market size and forecast 2023-2028 ($ million)
- Chart on France - Year-over-year growth 2023-2028 (%)
- Data Table on France - Year-over-year growth 2023-2028 (%)
- 9.12 China - Market size and forecast 2023-2028
- Chart on China - Market size and forecast 2023-2028 ($ million)
- Data Table on China - Market size and forecast 2023-2028 ($ million)
- Chart on China - Year-over-year growth 2023-2028 (%)
- Data Table on China - Year-over-year growth 2023-2028 (%)
- 9.13 Market opportunity By Geographical Landscape
- Market opportunity By Geographical Landscape ($ million)
- Data Tables on Market opportunity By Geographical Landscape ($ million)
10 Drivers, Challenges, and Opportunity/Restraints
- 10.1 Market drivers
- 10.2 Market challenges
- 10.3 Impact of drivers and challenges
- Impact of drivers and challenges in 2023 and 2028
- 10.4 Market opportunities/restraints
11 Competitive Landscape
- 11.1 Overview
- 11.2 Competitive Landscape
- Overview on criticality of inputs and factors of differentiation
- 11.3 Landscape disruption
- Overview on factors of disruption
- 11.4 Industry risks
- Impact of key risks on business
12 Competitive Analysis
- 12.1 Companies profiled
- Companies covered
- 12.2 Market positioning of companies
- Matrix on companies position and classification
- 12.3 Akal
- Akal - Overview
- Akal - Product / Service
- Akal - Key offerings
- 12.4 Bio Benjamin
- Bio Benjamin - Overview
- Bio Benjamin - Product / Service
- Bio Benjamin - Key offerings
- 12.5 Giddy Yoyo Inc.
- Giddy Yoyo Inc. - Overview
- Giddy Yoyo Inc. - Product / Service
- Giddy Yoyo Inc. - Key offerings
- 12.6 Healthy Little Vittles
- Healthy Little Vittles - Overview
- Healthy Little Vittles - Product / Service
- Healthy Little Vittles - Key offerings
- 12.7 Landish
- Landish - Overview
- Landish - Product / Service
- Landish - Key offerings
- 12.8 Lifestream NZ
- Lifestream NZ - Overview
- Lifestream NZ - Product / Service
- Lifestream NZ - Key offerings
- 12.9 LUCHINO SRL
- LUCHINO SRL - Overview
- LUCHINO SRL - Product / Service
- LUCHINO SRL - Key offerings
- 12.10 MERAVIGLIE Srl
- MERAVIGLIE Srl - Overview
- MERAVIGLIE Srl - Product / Service
- MERAVIGLIE Srl - Key offerings
- 12.11 Nestle SA
- Nestle SA - Overview
- Nestle SA - Business segments
- Nestle SA - Key news
- Nestle SA - Key offerings
- Nestle SA - Segment focus
- 12.12 Nurture Brands Ltd.
- Nurture Brands Ltd. - Overview
- Nurture Brands Ltd. - Product / Service
- Nurture Brands Ltd. - Key offerings
- 12.13 Sari Foods Co
- Sari Foods Co - Overview
- Sari Foods Co - Product / Service
- Sari Foods Co - Key offerings
- 12.14 Sonalis Consumer Product Ltd.
- Sonalis Consumer Product Ltd. - Overview
- Sonalis Consumer Product Ltd. - Product / Service
- Sonalis Consumer Product Ltd. - Key offerings
- 12.15 The Algae Factory BV
- The Algae Factory BV - Overview
- The Algae Factory BV - Product / Service
- The Algae Factory BV - Key offerings
- 12.16 Vosges Haut Chocolat Ltd.
- Vosges Haut Chocolat Ltd. - Overview
- Vosges Haut Chocolat Ltd. - Product / Service
- Vosges Haut Chocolat Ltd. - Key offerings
- 12.17 ZEON BIOTECH PVT LTD.
- ZEON BIOTECH PVT LTD. - Overview
- ZEON BIOTECH PVT LTD. - Product / Service
- ZEON BIOTECH PVT LTD. - Key offerings
13 Appendix
- 13.1 Scope of the report
- 13.2 Inclusions and exclusions checklist
- Inclusions checklist
- Exclusions checklist
- 13.3 Currency conversion rates for US$
- Currency conversion rates for US$
- 13.4 Research methodology
- Research methodology
- 13.5 Data procurement
- Information sources
- 13.6 Data validation
- Data validation
- 13.7 Validation techniques employed for market sizing
- Validation techniques employed for market sizing
- 13.8 Data synthesis
- Data synthesis
- 13.9 360 degree market analysis
- 360 degree market analysis
- 13.10 List of abbreviations
- List of abbreviations
