|
|
市場調査レポート
商品コード
1915529
世界のオープンシステムMRI市場2025-2029年Global Open System Mri Market 2025-2029 |
||||||
|
|||||||
カスタマイズ可能
|
|||||||

| 世界のオープンシステムMRI市場2025-2029年 |
|
出版日: 2026年01月19日
発行: TechNavio
ページ情報: 英文 292 Pages
納期: 即納可能
|

概要
世界のオープンシステムMRI市場は、2024年から2029年の間に2億8,850万米ドルの成長が見込まれ、予測期間中のCAGRは4.6%と予測されています。
本報告書では、世界のオープンシステムMRI市場に関する包括的な分析、市場規模と予測、動向、成長要因、課題に加え、約25社のベンダー分析を提供しております。
本レポートは、現在の市場状況、最新の動向と促進要因、市場環境全般に関する最新の分析を提供します。市場は、疾患の有病率増加と高齢人口の増加、オープンシステムMRIの臨床応用拡大、MRI磁力の技術的進歩によって牽引されています。
本調査は、業界の主要関係者からの情報を含む一次情報と二次情報を客観的に組み合わせて実施されました。本レポートには、主要企業の分析に加え、包括的な市場規模データ、地域別分析を伴うセグメント、ベンダー情勢が含まれています。レポートには過去データと予測データが掲載されています。
| 市場範囲 | |
|---|---|
| 基準年 | 2025年 |
| 終了年 | 2029年 |
| 予測期間 | 2025-2029 |
| 成長モメンタム | 加速 |
| 前年比 | 4.4% |
| CAGR | 4.6% |
| 増分額 | 2億8,850万米ドル |
本調査では、今後数年間における世界のオープンシステムMRI市場の成長を牽引する主要な要因の一つとして、MRI技術におけるソフトウェアの進歩を挙げております。また、アジアにおける新興の潜在市場と、ヘリウムフリーのオープンシステムMRIの開発への注力が、市場において相当な需要を生み出すものと見込まれます。
目次
第1章 エグゼクティブサマリー
第2章 Technavio分析
- 価格・ライフサイクル・顧客購入バスケット・採用率・購入基準の分析
- インプットの重要性と差別化の要因
- 混乱の要因
- 促進要因と課題の影響
第3章 市場情勢
- 市場エコシステム
- 市場の特徴
- バリューチェーン分析
第4章 市場規模
- 市場の定義
- 市場セグメント分析
- 市場規模 2024
- 市場の見通し 2024-2029
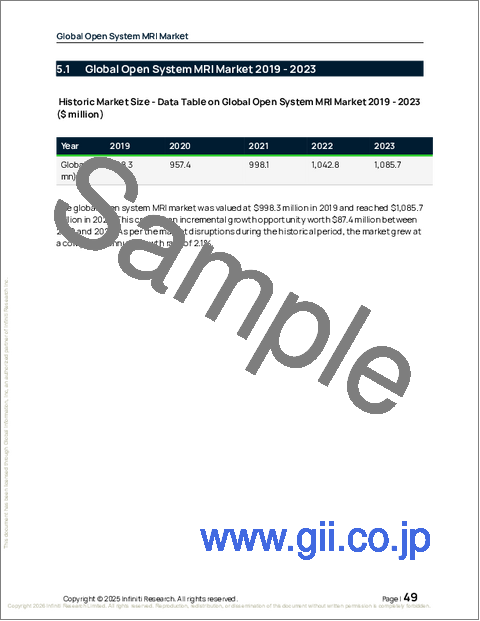
第5章 市場規模実績
- 世界のオープンシステムMRI市場 2019-2023
- タイプセグメント分析 2019-2023
- 技術セグメント分析 2019-2023
- エンドユーザーセグメント分析 2019-2023
- 地域別セグメント分析 2019-2023
- 国別セグメント分析 2019-2023
第6章 定性分析
- AIの影響:世界のオープンシステムMRI市場
第7章 ファイブフォース分析
- ファイブフォースの要約
- 買い手の交渉力
- 供給企業の交渉力
- 新規参入業者の脅威
- 代替品の脅威
- 競争の脅威
- 市況
第8章 市場セグメンテーション:タイプ別
- 比較:タイプ別
- 低磁場スキャナー
- 中磁場スキャナー
- 高磁場スキャナー
- 市場機会:タイプ別
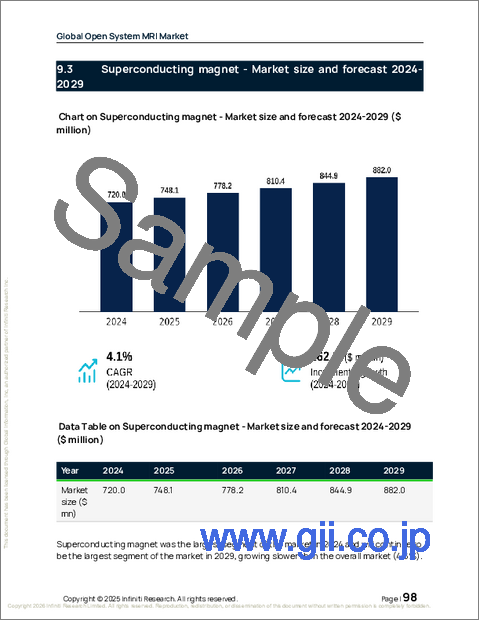
第9章 市場セグメンテーション:技術別
- 比較:技術別
- 超電導磁石
- 永久磁石
- ハイブリッドシステム
- 市場機会:技術別
第10章 市場セグメンテーション:エンドユーザー別
- 比較:エンドユーザー別
- 神経学
- 腫瘍学
- 循環器学
- その他
- 市場機会:エンドユーザー別
第11章 顧客情勢
第12章 地域別情勢
- 地域別セグメンテーション
- 地域別比較
- 北米
- 米国
- カナダ
- メキシコ
- 欧州
- ドイツ
- 英国
- フランス
- イタリア
- スペイン
- オランダ
- アジア
- 中国
- インド
- 日本
- 韓国
- タイ
- インドネシア
- 世界のその他の地域
- ブラジル
- サウジアラビア
- アラブ首長国連邦
- トルコ
- アルゼンチン
- コロンビア
- 南アフリカ
- イスラエル
- 市場機会:地域別
第13章 促進要因・課題・機会
- 市場促進要因
- 市場の課題
- 促進要因と課題の影響
- 市場機会
第14章 競合情勢
- 概要
- 競合情勢
- 混乱の状況
- 業界のリスク
第15章 競合分析
- 企業プロファイル
- 企業ランキング指標
- 企業の市場ポジショニング
- Alltech Inc.
- ASG Superconductors Spa
- Aspect Imaging Ltd.
- AURORA HEALTHCARE US Corp.
- Beijing Wandong Medical Technology Co. Ltd.
- Canon Inc.
- Esaote Spa
- FONAR Corp.
- FUJIFILM Holdings Corp.
- General Electric Co.
- Hitachi Ltd.
- Koninklijke Philips NV
- Neusoft Corp.
- Siemens AG
- Toshiba Corp.

