|
|
市場調査レポート
商品コード
1915525
世界のオートクレーブ養生気泡コンクリート(AAC)市場2025-2029年Global Autoclaved Aerated Concrete (Aac) Market 2025-2029 |
||||||
|
|||||||
カスタマイズ可能
|
|||||||

| 世界のオートクレーブ養生気泡コンクリート(AAC)市場2025-2029年 |
|
出版日: 2026年01月19日
発行: TechNavio
ページ情報: 英文 290 Pages
納期: 即納可能
|

概要
世界のオートクレーブ養生気泡コンクリート(AAC)市場は、2024年から2029年の予測期間において、CAGR 7.0%で成長し、83億7,430万米ドル規模に達すると予測されております。
本報告書は、世界のオートクレーブ養生気泡コンクリート(AAC)市場に関する包括的な分析を提供し、市場規模と予測、動向、成長要因、課題に加え、約25社のベンダー分析を網羅しております。
本レポートは、現在の市場状況、最新の動向と促進要因、市場環境全般に関する最新の分析を提供します。市場は、アジア太平洋地域におけるインフラへの政府支出の増加、従来型レンガに対するAACの優位性、持続可能性と省エネルギー性によって牽引されています。
本調査は、業界の主要関係者からの情報をはじめ、一次情報と二次情報を客観的に組み合わせて実施されました。本レポートには、主要企業の分析に加え、包括的な市場規模データ、地域別分析を伴うセグメント、ベンダー情勢が含まれています。レポートには過去データと予測データが掲載されています。
| 市場範囲 | |
|---|---|
| 基準年 | 2025年 |
| 対象期間 | 2029年 |
| 予測期間 | 2025-2029 |
| 成長モメンタム | 加速 |
| 前年比 | 6.6% |
| CAGR | 7% |
| 増分額 | 83億7,430万米ドル |
本調査では、環境に優しい建築物への需要が、今後数年間における世界のオートクレーブ養生軽量コンクリート(AAC)市場成長を牽引する主要な要因の一つであると特定しております。また、企業は持続可能な建築資材の開発に注力しており、革新的なAAC製品およびバリエーションの開発が市場における相当な需要につながると考えられます。
目次
第1章 エグゼクティブサマリー
第2章 Technavio分析
- 価格・ライフサイクル・顧客購入バスケット・採用率・購入基準の分析
- インプットの重要性と差別化の要因
- 混乱の要因
- 促進要因と課題の影響
第3章 市場情勢
- 市場エコシステム
- 市場の特徴
- バリューチェーン分析
第4章 市場規模
- 市場の定義
- 市場セグメント分析
- 市場規模 2024
- 市場の見通し 2024-2029
第5章 市場規模実績
- 世界のオートクレーブ養生気泡コンクリート(AAC)市場 2019-2023
- エンドユーザーセグメント分析 2019-2023
- 製品セグメント分析 2019-2023
- 裏打ち材セグメント分析 2019-2023
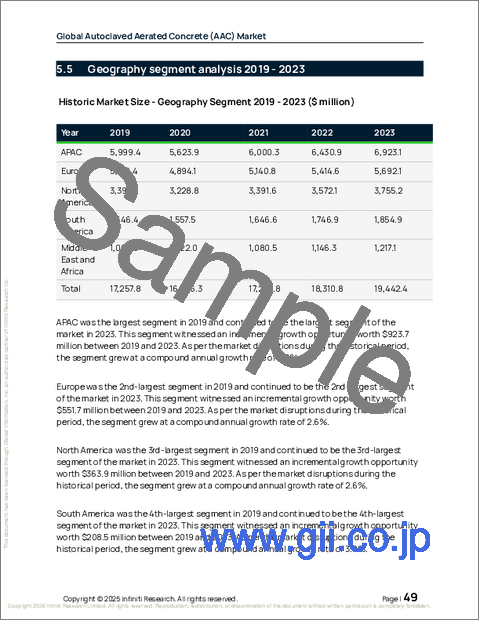
- 地域別セグメント分析 2019-2023
- 国別セグメント分析 2019-2023
第6章 定性分析
- AIの影響:世界のオートクレーブ養生気泡コンクリート(AAC)市場
第7章 ファイブフォース分析
- ファイブフォースの要約
- 買い手の交渉力
- 供給企業の交渉力
- 新規参入業者の脅威
- 代替品の脅威
- 競争の脅威
- 市況
第8章 市場セグメンテーション:エンドユーザー別
- 比較:エンドユーザー別
- 非住宅向け
- 住宅用
- 市場機会:エンドユーザー別
第9章 市場セグメンテーション:製品別
- 比較:製品別
- ブロック
- パネル
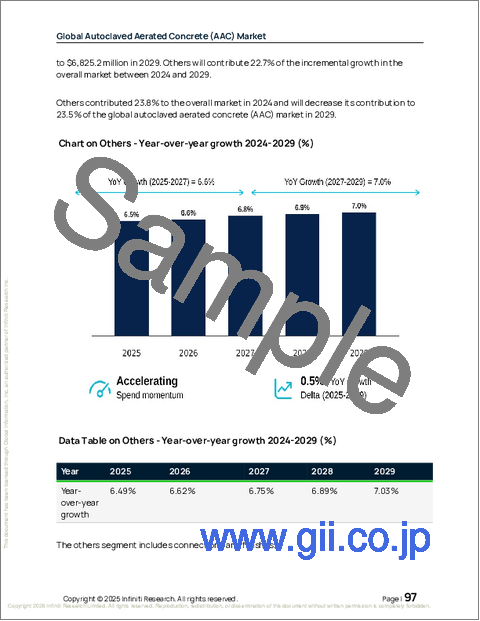
- その他
- 市場機会:製品別
第10章 市場セグメンテーション:裏地素材別
- 比較:裏地素材別
- フライアッシュ
- セメント
- 石灰
- アルミ粉末
- 市場機会:裏地素材別
第11章 顧客情勢
第12章 地域別情勢
- 地域別セグメンテーション
- 地域別比較
- アジア太平洋
- インド
- 中国
- 日本
- 韓国
- オーストラリア
- インドネシア
- 欧州
- ドイツ
- 英国
- フランス
- イタリア
- スペイン
- オランダ
- 北米
- 米国
- カナダ
- メキシコ
- 南米
- ブラジル
- アルゼンチン
- コロンビア
- 中東・アフリカ
- サウジアラビア
- アラブ首長国連邦
- トルコ
- エジプト
- 南アフリカ
- 市場機会:地域別
第13章 促進要因・課題・機会
- 市場促進要因
- 市場の課題
- 促進要因と課題の影響
- 市場機会
第14章 競合情勢
- 概要
- 競合情勢
- 混乱の状況
- 業界のリスク
第15章 競合分析
- 企業プロファイル
- 企業ランキング指標
- 企業の市場ポジショニング
- AERCON AAC
- Bauroc AS
- Biltech Building Elements Ltd
- Broco Industries
- Buildmate Projects Pvt. Ltd.
- CK Birla Group
- H H UK Ltd.
- Hebel Ltd.
- Holcim Ltd.
- JK Lakshmi Cement Ltd.
- Magicrete
- Masa GmbH
- Renaatus Procon Pvt. Ltd.
- UAL Industries Ltd.
- UltraTech Cement Ltd.

