|
|
市場調査レポート
商品コード
2030815
アムロジピンベシル酸塩の世界市場 2026年~2030年Global Amlodipine Besylate Market 2026-2030 |
||||||
|
|||||||
カスタマイズ可能
|
|||||||

| アムロジピンベシル酸塩の世界市場 2026年~2030年 |
|
出版日: 2026年05月03日
発行: TechNavio
ページ情報: 英文 287 Pages
納期: 即納可能
|

概要
世界のアムロジピンベシル酸塩市場は、2025年から2030年にかけて2億1,050万米ドル成長し、予測期間中のCAGRは3.3%になると予測されています。
本報告書では、世界のアムロジピンベシル酸塩市場について、包括的な分析、市場規模と予測、動向、成長要因、課題に加え、約25社のベンダーを対象としたベンダー分析を提供しています。
本レポートでは、現在の市場状況、最新の動向と促進要因、および市場環境全体に関する最新の分析を提供しています。この市場は、高血圧や慢性心血管疾患の有病率、世界の人口の高齢化という人口動態の変化、および固定用量配合療法の採用拡大によって牽引されています。
本調査は、業界の主要関係者からの意見を含む一次情報と二次情報を客観的に組み合わせて実施されました。本レポートには、主要企業の分析に加え、包括的な市場規模データ、地域別分析を伴うセグメント、およびベンダー情勢が含まれています。レポートには、過去データと予測データが掲載されています。
| 市場範囲 | |
|---|---|
| 基準年 | 2025年 |
| 終了年 | 2030 |
| 調査対象期間 | 2026年~2030年 |
| 成長モメンタム | 加速 |
| 2026年比 | 3.2% |
| CAGR | 3.3% |
| 増分額 | 2億1,050万米ドル |
本調査では、デジタルヘルスと遠隔患者モニタリングの統合が、今後数年間における世界のアムロジピンベシル酸塩市場の成長を牽引する主な要因の一つであると特定しています。また、サプライチェーンのレジリエンスや持続可能な製造への戦略的な重点化、ならびに市場力学に影響を与える規制の枠組みや価格統制政策が、市場において相当な需要を生み出すことになると考えられます。
目次
第1章 エグゼクティブサマリー
第2章 Technavio分析
- 価格・ライフサイクル・顧客購入バスケット・採用率・購入基準の分析
- インプットの重要性と差別化の要因
- ディスラプション要因
- 促進要因と課題の影響
第3章 市場情勢
- 市場エコシステム
- 市場の特徴
- バリューチェーン分析
第4章 市場規模
- 市場の定義
- 市場セグメント分析
- 市場規模、2025年
- 市場の見通し、2025年-2030年
第5章 市場規模実績
- 世界のアムロジピンベシル酸塩市場、2020年-2024年
- 用途別セグメント分析、2020年-2024年
- タイプ別セグメント分析、2020年-2024年
- エンドユーザー別セグメント分析、2020年-2024年
- 地域別セグメント分析、2020年-2024年
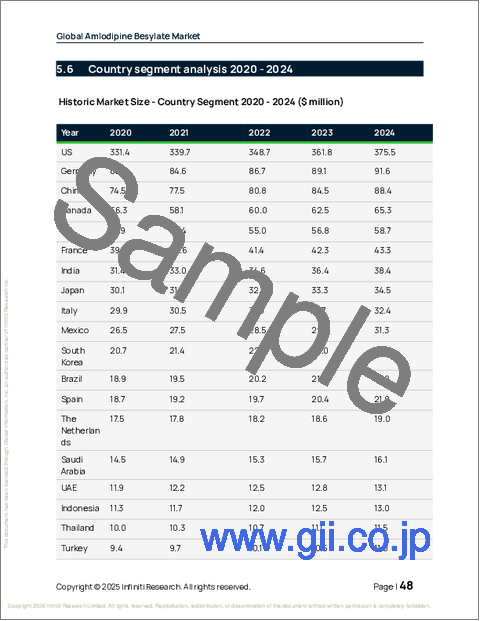
- 国別セグメント分析、2020年-2024年
第6章 定性分析
- AIの影響:世界のアムロジピンベシル酸塩市場
- 地政学的紛争が及ぼす影響:世界のアムロジピンベシル酸塩市場
第7章 ファイブフォース分析
第8章 市場セグメンテーション:用途別
- 比較:用途別
- 高血圧
- 心臓疾患
- 市場機会:用途別
第9章 市場セグメンテーション:タイプ別
- 比較:タイプ別
- 5mg錠
- 10mg錠
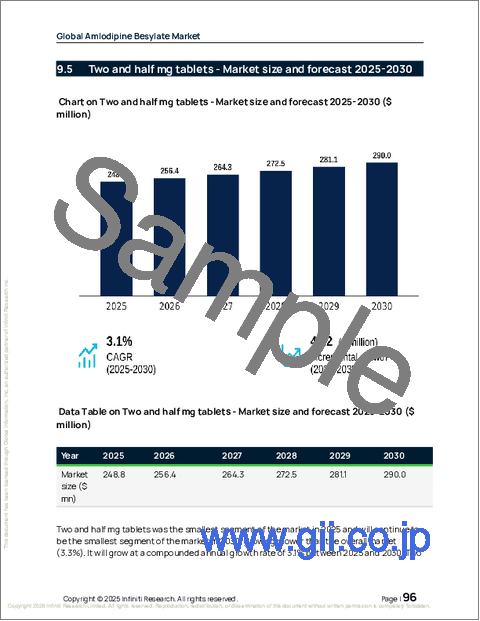
- 2.5mg錠
- 市場機会:タイプ別
第10章 市場セグメンテーション:エンドユーザー別
- 比較:エンドユーザー別
- 病院・クリニック
- ホームケア
- 公的ヘルスケアプログラム
- 市場機会:エンドユーザー別
第11章 顧客情勢
第12章 地域別情勢
- 地域別セグメンテーション
- 地域別比較
- 北米
- 米国
- カナダ
- メキシコ
- 欧州
- ドイツ
- 英国
- フランス
- イタリア
- スペイン
- オランダ
- アジア
- 中国
- インド
- 日本
- 韓国
- インドネシア
- タイ
- 世界のその他の地域(RoW)
- ブラジル
- サウジアラビア
- UAE
- トルコ
- アルゼンチン
- コロンビア
- 南アフリカ
- イスラエル
- 市場機会:地域別
第13章 促進要因・課題・機会
- 市場促進要因
- 市場の課題
- 促進要因と課題の影響
- 市場機会
第14章 競合情勢
- 概要
- 競合情勢
- ディスラプション情勢
- 業界のリスク
第15章 競合分析
- 企業プロファイル
- 企業ランキング指標
- 企業の市場ポジショニング
- Apotex Inc.
- Aurobindo Pharma Ltd.
- Cadila Pharmaceuticals Ltd.
- Cipla Inc.
- Daiichi Sankyo Co. Ltd.
- Dr. Reddys Laboratories Ltd.
- Glenmark Pharmaceuticals Ltd.
- Intas Pharmaceuticals Ltd.
- Lupin Ltd.
- Orbion Pharmaceuticals Pvt. Ltd.
- Pfizer Inc.
- Sandoz Group AG
- Teva Pharmaceutical Ltd.
- Viatris Inc.
- Zydus Lifesciences Ltd.
