|
|
市場調査レポート
商品コード
1774388
ヘルスケアにおけるビッグデータ支出の世界市場 2025-2029Global Big Data Spending Market in Healthcare Sector 2025-2029 |
||||||

|
|||||||
カスタマイズ可能
|
|||||||

| ヘルスケアにおけるビッグデータ支出の世界市場 2025-2029 |
|
出版日: 2025年07月11日
発行: TechNavio
ページ情報: 英文 239 Pages
納期: 即納可能
|

全表示
- 概要
- 図表
- 目次
ヘルスケアにおけるビッグデータ支出市場は2024-2029年に77億8,380万米ドル、予測期間中のCAGRは10.2%で成長すると予測されます。
当レポートでは、ヘルスケアにおけるビッグデータ支出市場について、市場規模や予測、動向、市場促進要因・課題、約25のベンダーを網羅したベンダー分析など、包括的な分析を掲載しています。
現在の市場シナリオ、最新動向と促進要因、市場環境全体に関する最新分析を提供しています。市場は、業務効率化の必要性、スマートコネクテッドデバイスの増加、膨大な医療データ生成量の継続的な増加が牽引しています。
| 市場範囲 | |
|---|---|
| 基準年 | 2025 |
| 終了年 | 2029 |
| 予測期間 | 2025-2029 |
| 成長モメンタム | 加速 |
| 前年比 | 9.3% |
| CAGR | 10.2% |
| 増分額 | 77億8,380万米ドル |
本調査は、業界の主要参加者からのインプットを含め、一次情報と二次情報を客観的に組み合わせて実施しました。レポートには、主要企業の分析に加え、包括的な市場規模データ、地域分析によるセグメント、ベンダー情勢が含まれています。レポートは過去データと予測データを掲載しています。
本調査では、ヘルスケア市場でのビッグデータ分析の利用の増加が、今後数年間のヘルスケア分野でのビッグデータ支出市場の成長を促進する主要な理由の1つであると特定しています。また、ウェアラブル技術の採用が増加し、クラウドベースの分析ソリューションへの傾倒が高まっていることも、市場の大きな需要につながります。
目次
第1章 エグゼクティブサマリー
- 市場概要
第2章 Technavio分析
- 価格・ライフサイクル・顧客購入バスケット・採用率・購入基準の分析
- インプットの重要性と差別化の要因
- 混乱の要因
- 促進要因と課題の影響
第3章 市場情勢
- 市場エコシステム
- 市場の特徴
- バリューチェーン分析
第4章 市場規模
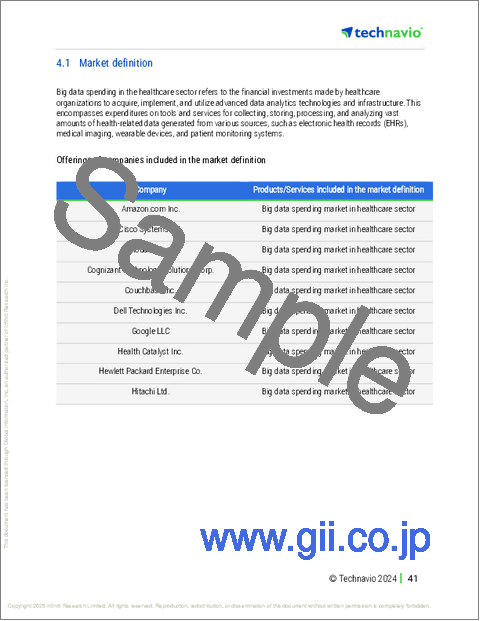
- 市場の定義
- 市場セグメント分析
- 市場規模 2024
- 市場の見通し 2024-2029
第5章 市場規模実績
- ヘルスケアにおけるビッグデータ支出の世界市場 2019-2023
- サービス別セグメント分析 2019-2023
- タイプ別セグメント分析 2019-2023
- 用途別セグメント分析 2019-2023
- 地域別セグメント分析 2019-2023
- 国別セグメント分析 2019-2023
第6章 定性分析
- AIの影響:ヘルスケアにおけるビッグデータ支出の世界市場
第7章 ファイブフォース分析
- ファイブフォースの要約
- 買い手の交渉力
- 供給企業の交渉力
- 新規参入業者の脅威
- 代替品の脅威
- 競争の脅威
- 市況
第8章 市場セグメンテーション:サービス別
- 市場セグメント
- 比較:サービス別
- サービス:市場規模と予測 2024-2029
- ソフトウェア:市場規模と予測 2024-2029
- 市場機会:サービス別
第9章 市場セグメンテーション:タイプ別
- 市場セグメント
- 比較:タイプ別
- 記述的分析:市場規模と予測 2024-2029
- 予測分析:市場規模と予測 2024-2029
- 処方的分析:市場規模と予測 2024-2029
- 診断分析:市場規模と予測 2024-2029
- 市場機会:タイプ別
第10章 市場セグメンテーション:用途別
- 市場セグメント
- 比較:用途別
- 財務分析:市場規模と予測 2024-2029
- 人口健康管理:市場規模と予測 2024-2029
- 臨床意思決定支援:市場規模と予測 2024-2029
- 運用分析:市場規模と予測 2024-2029
- その他:市場規模と予測 2024-2029
- 市場機会:用途別
第11章 顧客情勢
- 顧客情勢の概要
第12章 地域別情勢
- 地域別セグメンテーション
- 地域別比較
- 北米:市場規模と予測 2024-2029
- 欧州:市場規模と予測 2024-2029
- アジア太平洋:市場規模と予測 2024-2029
- 中東・アフリカ:市場規模と予測 2024-2029
- 南米:市場規模と予測 2024-2029
- 米国:市場規模と予測 2024-2029
- インド:市場規模と予測 2024-2029
- 英国:市場規模と予測 2024-2029
- ドイツ:市場規模と予測 2024-2029
- 中国:市場規模と予測 2024-2029
- カナダ:市場規模と予測 2024-2029
- フランス:市場規模と予測 2024-2029
- フィリピン:市場規模と予測 2024-2029
- アイルランド:市場規模と予測 2024-2029
- ブラジル:市場規模と予測 2024-2029
- 市場機会:地域情勢別
第13章 促進要因・課題・機会・抑制要因
- 市場促進要因
- 市場の課題
- 促進要因と課題の影響
- 市場の機会・抑制要因
第14章 競合情勢
- 概要
- 競合情勢
- 混乱の状況
- 業界のリスク
第15章 競合分析
- 企業プロファイル
- 企業ランキング指数
- 企業の市場ポジショニング
- Amazon.com Inc.
- Cisco Systems Inc.
- Cloudera Inc.
- Cognizant Technology Solutions Corp.
- Couchbase Inc.
- Dell Technologies Inc.
- Google LLC
- Health Catalyst Inc.
- Hewlett Packard Enterprise Co.
- Hitachi Ltd.
- International Business Machines Corp.
- McKesson Corp.
- Microsoft Corp.
- Oracle Corp.
- SAP SE
第16章 付録
Exhibits:
- Exhibits1: Executive Summary - Chart on Market Overview
- Exhibits2: Executive Summary - Data Table on Market Overview
- Exhibits3: Executive Summary - Chart on Global Market Characteristics
- Exhibits4: Executive Summary - Chart on Market By Geographical Landscape
- Exhibits5: Executive Summary - Chart on Market Segmentation by Service
- Exhibits6: Executive Summary - Chart on Market Segmentation by Type
- Exhibits7: Executive Summary - Chart on Market Segmentation by Application
- Exhibits8: Executive Summary - Chart on Incremental Growth
- Exhibits9: Executive Summary - Data Table on Incremental Growth
- Exhibits10: Executive Summary - Chart on Company Market Positioning
- Exhibits11: Analysis of price sensitivity, lifecycle, customer purchase basket, adoption rates, and purchase criteria
- Exhibits12: Overview on criticality of inputs and factors of differentiation
- Exhibits13: Overview on factors of disruption
- Exhibits14: Impact of drivers and challenges in 2024 and 2029
- Exhibits15: Parent Market
- Exhibits16: Data Table on - Parent Market
- Exhibits17: Market characteristics analysis
- Exhibits18: Value chain analysis
- Exhibits19: Offerings of companies included in the market definition
- Exhibits20: Market segments
- Exhibits21: Chart on Global - Market size and forecast 2024-2029 ($ million)
- Exhibits22: Data Table on Global - Market size and forecast 2024-2029 ($ million)
- Exhibits23: Chart on Global Market: Year-over-year growth 2024-2029 (%)
- Exhibits24: Data Table on Global Market: Year-over-year growth 2024-2029 (%)
- Exhibits25: Historic Market Size - Data Table on Global Big Data Spending Market In Healthcare Sector 2019 - 2023 ($ million)
- Exhibits26: Historic Market Size - Service Segment 2019 - 2023 ($ million)
- Exhibits27: Historic Market Size - Type Segment 2019 - 2023 ($ million)
- Exhibits28: Historic Market Size - Application Segment 2019 - 2023 ($ million)
- Exhibits29: Historic Market Size - Geography Segment 2019 - 2023 ($ million)
- Exhibits30: Historic Market Size - Country Segment 2019 - 2023 ($ million)
- Exhibits31: Five forces analysis - Comparison between 2024 and 2029
- Exhibits32: Bargaining power of buyers - Impact of key factors 2024 and 2029
- Exhibits33: Bargaining power of suppliers - Impact of key factors in 2024 and 2029
- Exhibits34: Threat of new entrants - Impact of key factors in 2024 and 2029
- Exhibits35: Threat of substitutes - Impact of key factors in 2024 and 2029
- Exhibits36: Threat of rivalry - Impact of key factors in 2024 and 2029
- Exhibits37: Chart on Market condition - Five forces 2024 and 2029
- Exhibits38: Chart on Service - Market share 2024-2029 (%)
- Exhibits39: Data Table on Service - Market share 2024-2029 (%)
- Exhibits40: Chart on Comparison by Service
- Exhibits41: Data Table on Comparison by Service
- Exhibits42: Chart on Services - Market size and forecast 2024-2029 ($ million)
- Exhibits43: Data Table on Services - Market size and forecast 2024-2029 ($ million)
- Exhibits44: Chart on Services - Year-over-year growth 2024-2029 (%)
- Exhibits45: Data Table on Services - Year-over-year growth 2024-2029 (%)
- Exhibits46: Chart on Software - Market size and forecast 2024-2029 ($ million)
- Exhibits47: Data Table on Software - Market size and forecast 2024-2029 ($ million)
- Exhibits48: Chart on Software - Year-over-year growth 2024-2029 (%)
- Exhibits49: Data Table on Software - Year-over-year growth 2024-2029 (%)
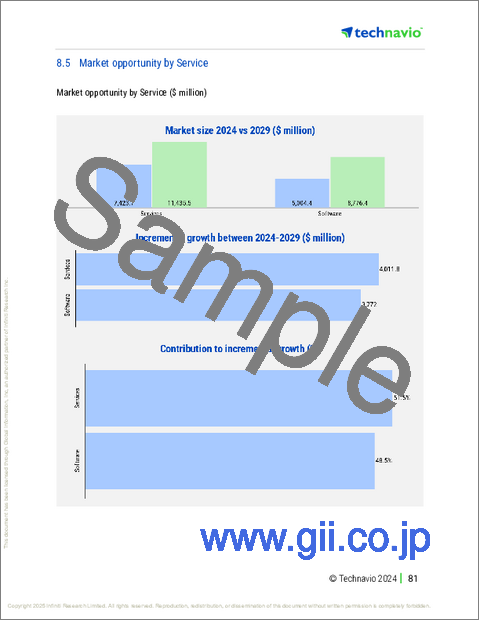
- Exhibits50: Market opportunity by Service ($ million)
- Exhibits51: Data Table on Market opportunity by Service ($ million)
- Exhibits52: Chart on Type - Market share 2024-2029 (%)
- Exhibits53: Data Table on Type - Market share 2024-2029 (%)
- Exhibits54: Chart on Comparison by Type
- Exhibits55: Data Table on Comparison by Type
- Exhibits56: Chart on Descriptive analytics - Market size and forecast 2024-2029 ($ million)
- Exhibits57: Data Table on Descriptive analytics - Market size and forecast 2024-2029 ($ million)
- Exhibits58: Chart on Descriptive analytics - Year-over-year growth 2024-2029 (%)
- Exhibits59: Data Table on Descriptive analytics - Year-over-year growth 2024-2029 (%)
- Exhibits60: Chart on Predictive analytics - Market size and forecast 2024-2029 ($ million)
- Exhibits61: Data Table on Predictive analytics - Market size and forecast 2024-2029 ($ million)
- Exhibits62: Chart on Predictive analytics - Year-over-year growth 2024-2029 (%)
- Exhibits63: Data Table on Predictive analytics - Year-over-year growth 2024-2029 (%)
- Exhibits64: Chart on Prescriptive analytics - Market size and forecast 2024-2029 ($ million)
- Exhibits65: Data Table on Prescriptive analytics - Market size and forecast 2024-2029 ($ million)
- Exhibits66: Chart on Prescriptive analytics - Year-over-year growth 2024-2029 (%)
- Exhibits67: Data Table on Prescriptive analytics - Year-over-year growth 2024-2029 (%)
- Exhibits68: Chart on Diagnostic analytics - Market size and forecast 2024-2029 ($ million)
- Exhibits69: Data Table on Diagnostic analytics - Market size and forecast 2024-2029 ($ million)
- Exhibits70: Chart on Diagnostic analytics - Year-over-year growth 2024-2029 (%)
- Exhibits71: Data Table on Diagnostic analytics - Year-over-year growth 2024-2029 (%)
- Exhibits72: Market opportunity by Type ($ million)
- Exhibits73: Data Table on Market opportunity by Type ($ million)
- Exhibits74: Chart on Application - Market share 2024-2029 (%)
- Exhibits75: Data Table on Application - Market share 2024-2029 (%)
- Exhibits76: Chart on Comparison by Application
- Exhibits77: Data Table on Comparison by Application
- Exhibits78: Chart on Financial analytics - Market size and forecast 2024-2029 ($ million)
- Exhibits79: Data Table on Financial analytics - Market size and forecast 2024-2029 ($ million)
- Exhibits80: Chart on Financial analytics - Year-over-year growth 2024-2029 (%)
- Exhibits81: Data Table on Financial analytics - Year-over-year growth 2024-2029 (%)
- Exhibits82: Chart on Population health management - Market size and forecast 2024-2029 ($ million)
- Exhibits83: Data Table on Population health management - Market size and forecast 2024-2029 ($ million)
- Exhibits84: Chart on Population health management - Year-over-year growth 2024-2029 (%)
- Exhibits85: Data Table on Population health management - Year-over-year growth 2024-2029 (%)
- Exhibits86: Chart on Clinical decision support - Market size and forecast 2024-2029 ($ million)
- Exhibits87: Data Table on Clinical decision support - Market size and forecast 2024-2029 ($ million)
- Exhibits88: Chart on Clinical decision support - Year-over-year growth 2024-2029 (%)
- Exhibits89: Data Table on Clinical decision support - Year-over-year growth 2024-2029 (%)
- Exhibits90: Chart on Operational analytics - Market size and forecast 2024-2029 ($ million)
- Exhibits91: Data Table on Operational analytics - Market size and forecast 2024-2029 ($ million)
- Exhibits92: Chart on Operational analytics - Year-over-year growth 2024-2029 (%)
- Exhibits93: Data Table on Operational analytics - Year-over-year growth 2024-2029 (%)
- Exhibits94: Chart on Others - Market size and forecast 2024-2029 ($ million)
- Exhibits95: Data Table on Others - Market size and forecast 2024-2029 ($ million)
- Exhibits96: Chart on Others - Year-over-year growth 2024-2029 (%)
- Exhibits97: Data Table on Others - Year-over-year growth 2024-2029 (%)
- Exhibits98: Market opportunity by Application ($ million)
- Exhibits99: Data Table on Market opportunity by Application ($ million)
- Exhibits100: Analysis of price sensitivity, lifecycle, customer purchase basket, adoption rates, and purchase criteria
- Exhibits101: Chart on Market share By Geographical Landscape 2024-2029 (%)
- Exhibits102: Data Table on Market share By Geographical Landscape 2024-2029 (%)
- Exhibits103: Chart on Geographic comparison
- Exhibits104: Data Table on Geographic comparison
- Exhibits105: Chart on North America - Market size and forecast 2024-2029 ($ million)
- Exhibits106: Data Table on North America - Market size and forecast 2024-2029 ($ million)
- Exhibits107: Chart on North America - Year-over-year growth 2024-2029 (%)
- Exhibits108: Data Table on North America - Year-over-year growth 2024-2029 (%)
- Exhibits109: Chart on Europe - Market size and forecast 2024-2029 ($ million)
- Exhibits110: Data Table on Europe - Market size and forecast 2024-2029 ($ million)
- Exhibits111: Chart on Europe - Year-over-year growth 2024-2029 (%)
- Exhibits112: Data Table on Europe - Year-over-year growth 2024-2029 (%)
- Exhibits113: Chart on APAC - Market size and forecast 2024-2029 ($ million)
- Exhibits114: Data Table on APAC - Market size and forecast 2024-2029 ($ million)
- Exhibits115: Chart on APAC - Year-over-year growth 2024-2029 (%)
- Exhibits116: Data Table on APAC - Year-over-year growth 2024-2029 (%)
- Exhibits117: Chart on Middle East and Africa - Market size and forecast 2024-2029 ($ million)
- Exhibits118: Data Table on Middle East and Africa - Market size and forecast 2024-2029 ($ million)
- Exhibits119: Chart on Middle East and Africa - Year-over-year growth 2024-2029 (%)
- Exhibits120: Data Table on Middle East and Africa - Year-over-year growth 2024-2029 (%)
- Exhibits121: Chart on South America - Market size and forecast 2024-2029 ($ million)
- Exhibits122: Data Table on South America - Market size and forecast 2024-2029 ($ million)
- Exhibits123: Chart on South America - Year-over-year growth 2024-2029 (%)
- Exhibits124: Data Table on South America - Year-over-year growth 2024-2029 (%)
- Exhibits125: Chart on US - Market size and forecast 2024-2029 ($ million)
- Exhibits126: Data Table on US - Market size and forecast 2024-2029 ($ million)
- Exhibits127: Chart on US - Year-over-year growth 2024-2029 (%)
- Exhibits128: Data Table on US - Year-over-year growth 2024-2029 (%)
- Exhibits129: Chart on India - Market size and forecast 2024-2029 ($ million)
- Exhibits130: Data Table on India - Market size and forecast 2024-2029 ($ million)
- Exhibits131: Chart on India - Year-over-year growth 2024-2029 (%)
- Exhibits132: Data Table on India - Year-over-year growth 2024-2029 (%)
- Exhibits133: Chart on UK - Market size and forecast 2024-2029 ($ million)
- Exhibits134: Data Table on UK - Market size and forecast 2024-2029 ($ million)
- Exhibits135: Chart on UK - Year-over-year growth 2024-2029 (%)
- Exhibits136: Data Table on UK - Year-over-year growth 2024-2029 (%)
- Exhibits137: Chart on Germany - Market size and forecast 2024-2029 ($ million)
- Exhibits138: Data Table on Germany - Market size and forecast 2024-2029 ($ million)
- Exhibits139: Chart on Germany - Year-over-year growth 2024-2029 (%)
- Exhibits140: Data Table on Germany - Year-over-year growth 2024-2029 (%)
- Exhibits141: Chart on China - Market size and forecast 2024-2029 ($ million)
- Exhibits142: Data Table on China - Market size and forecast 2024-2029 ($ million)
- Exhibits143: Chart on China - Year-over-year growth 2024-2029 (%)
- Exhibits144: Data Table on China - Year-over-year growth 2024-2029 (%)
- Exhibits145: Chart on Canada - Market size and forecast 2024-2029 ($ million)
- Exhibits146: Data Table on Canada - Market size and forecast 2024-2029 ($ million)
- Exhibits147: Chart on Canada - Year-over-year growth 2024-2029 (%)
- Exhibits148: Data Table on Canada - Year-over-year growth 2024-2029 (%)
- Exhibits149: Chart on France - Market size and forecast 2024-2029 ($ million)
- Exhibits150: Data Table on France - Market size and forecast 2024-2029 ($ million)
- Exhibits151: Chart on France - Year-over-year growth 2024-2029 (%)
- Exhibits152: Data Table on France - Year-over-year growth 2024-2029 (%)
- Exhibits153: Chart on Philippines - Market size and forecast 2024-2029 ($ million)
- Exhibits154: Data Table on Philippines - Market size and forecast 2024-2029 ($ million)
- Exhibits155: Chart on Philippines - Year-over-year growth 2024-2029 (%)
- Exhibits156: Data Table on Philippines - Year-over-year growth 2024-2029 (%)
- Exhibits157: Chart on Ireland - Market size and forecast 2024-2029 ($ million)
- Exhibits158: Data Table on Ireland - Market size and forecast 2024-2029 ($ million)
- Exhibits159: Chart on Ireland - Year-over-year growth 2024-2029 (%)
- Exhibits160: Data Table on Ireland - Year-over-year growth 2024-2029 (%)
- Exhibits161: Chart on Brazil - Market size and forecast 2024-2029 ($ million)
- Exhibits162: Data Table on Brazil - Market size and forecast 2024-2029 ($ million)
- Exhibits163: Chart on Brazil - Year-over-year growth 2024-2029 (%)
- Exhibits164: Data Table on Brazil - Year-over-year growth 2024-2029 (%)
- Exhibits165: Market opportunity By Geographical Landscape ($ million)
- Exhibits166: Data Tables on Market opportunity By Geographical Landscape ($ million)
- Exhibits167: Impact of drivers and challenges in 2024 and 2029
- Exhibits168: Overview on criticality of inputs and factors of differentiation
- Exhibits169: Overview on factors of disruption
- Exhibits170: Impact of key risks on business
- Exhibits171: Companies covered
- Exhibits172: Company ranking index
- Exhibits173: Matrix on companies position and classification
- Exhibits174: Amazon.com Inc. - Overview
- Exhibits175: Amazon.com Inc. - Business segments
- Exhibits176: Amazon.com Inc. - Key news
- Exhibits177: Amazon.com Inc. - Key offerings
- Exhibits178: Amazon.com Inc. - Segment focus
- Exhibits179: SWOT
- Exhibits180: Cisco Systems Inc. - Overview
- Exhibits181: Cisco Systems Inc. - Business segments
- Exhibits182: Cisco Systems Inc. - Key news
- Exhibits183: Cisco Systems Inc. - Key offerings
- Exhibits184: Cisco Systems Inc. - Segment focus
- Exhibits185: SWOT
- Exhibits186: Cloudera Inc. - Overview
- Exhibits187: Cloudera Inc. - Product / Service
- Exhibits188: Cloudera Inc. - Key offerings
- Exhibits189: SWOT
- Exhibits190: Cognizant Technology Solutions Corp. - Overview
- Exhibits191: Cognizant Technology Solutions Corp. - Business segments
- Exhibits192: Cognizant Technology Solutions Corp. - Key news
- Exhibits193: Cognizant Technology Solutions Corp. - Key offerings
- Exhibits194: Cognizant Technology Solutions Corp. - Segment focus
- Exhibits195: SWOT
- Exhibits196: Couchbase Inc. - Overview
- Exhibits197: Couchbase Inc. - Product / Service
- Exhibits198: Couchbase Inc. - Key offerings
- Exhibits199: SWOT
- Exhibits200: Dell Technologies Inc. - Overview
- Exhibits201: Dell Technologies Inc. - Business segments
- Exhibits202: Dell Technologies Inc. - Key news
- Exhibits203: Dell Technologies Inc. - Key offerings
- Exhibits204: Dell Technologies Inc. - Segment focus
- Exhibits205: SWOT
- Exhibits206: Google LLC - Overview
- Exhibits207: Google LLC - Product / Service
- Exhibits208: Google LLC - Key offerings
- Exhibits209: SWOT
- Exhibits210: Health Catalyst Inc. - Overview
- Exhibits211: Health Catalyst Inc. - Business segments
- Exhibits212: Health Catalyst Inc. - Key offerings
- Exhibits213: Health Catalyst Inc. - Segment focus
- Exhibits214: SWOT
- Exhibits215: Hewlett Packard Enterprise Co. - Overview
- Exhibits216: Hewlett Packard Enterprise Co. - Business segments
- Exhibits217: Hewlett Packard Enterprise Co. - Key news
- Exhibits218: Hewlett Packard Enterprise Co. - Key offerings
- Exhibits219: Hewlett Packard Enterprise Co. - Segment focus
- Exhibits220: SWOT
- Exhibits221: Hitachi Ltd. - Overview
- Exhibits222: Hitachi Ltd. - Business segments
- Exhibits223: Hitachi Ltd. - Key news
- Exhibits224: Hitachi Ltd. - Key offerings
- Exhibits225: Hitachi Ltd. - Segment focus
- Exhibits226: SWOT
- Exhibits227: International Business Machines Corp. - Overview
- Exhibits228: International Business Machines Corp. - Business segments
- Exhibits229: International Business Machines Corp. - Key news
- Exhibits230: International Business Machines Corp. - Key offerings
- Exhibits231: International Business Machines Corp. - Segment focus
- Exhibits232: SWOT
- Exhibits233: McKesson Corp. - Overview
- Exhibits234: McKesson Corp. - Business segments
- Exhibits235: McKesson Corp. - Key news
- Exhibits236: McKesson Corp. - Key offerings
- Exhibits237: McKesson Corp. - Segment focus
- Exhibits238: SWOT
- Exhibits239: Microsoft Corp. - Overview
- Exhibits240: Microsoft Corp. - Business segments
- Exhibits241: Microsoft Corp. - Key news
- Exhibits242: Microsoft Corp. - Key offerings
- Exhibits243: Microsoft Corp. - Segment focus
- Exhibits244: SWOT
- Exhibits245: Oracle Corp. - Overview
- Exhibits246: Oracle Corp. - Business segments
- Exhibits247: Oracle Corp. - Key news
- Exhibits248: Oracle Corp. - Key offerings
- Exhibits249: Oracle Corp. - Segment focus
- Exhibits250: SWOT
- Exhibits251: SAP SE - Overview
- Exhibits252: SAP SE - Business segments
- Exhibits253: SAP SE - Key news
- Exhibits254: SAP SE - Key offerings
- Exhibits255: SAP SE - Segment focus
- Exhibits256: SWOT
- Exhibits257: Inclusions checklist
- Exhibits258: Exclusions checklist
- Exhibits259: Currency conversion rates for US$
- Exhibits260: Research methodology
- Exhibits261: Information sources
- Exhibits262: Data validation
- Exhibits263: Validation techniques employed for market sizing
- Exhibits264: Data synthesis
- Exhibits265: 360 degree market analysis
- Exhibits266: List of abbreviations
The big data spending in healthcare sector market is forecasted to grow by USD 7,783.8 mn during 2024-2029, accelerating at a CAGR of 10.2% during the forecast period. The report on the big data spending in healthcare sector market provides a holistic analysis, market size and forecast, trends, growth drivers, and challenges, as well as vendor analysis covering around 25 vendors.
The report offers an up-to-date analysis regarding the current market scenario, the latest trends and drivers, and the overall market environment. The market is driven by need to improve business efficiency, increase in number of smart-connected devices, and continuous growth in enormous amount of medical data generation.
| Market Scope | |
|---|---|
| Base Year | 2025 |
| End Year | 2029 |
| Series Year | 2025-2029 |
| Growth Momentum | Accelerate |
| YOY 2025 | 9.3% |
| CAGR | 10.2% |
| Incremental Value | $7,783.8 mn |
The study was conducted using an objective combination of primary and secondary information including inputs from key participants in the industry. The report contains a comprehensive market size data, segment with regional analysis and vendor landscape in addition to an analysis of the key companies. Reports have historic and forecast data.
Technavio's big data spending in healthcare sector market is segmented as below:
By Service
- Services
- Software
By Type
- Descriptive analytics
- Predictive analytics
- Prescriptive analytics
- Diagnostic analytics
By Application
- Financial analytics
- Population health management
- Clinical decision support
- Operational analytics
- Others
By Geographical Landscape
- North America
- Europe
- APAC
- Middle East and Africa
- South America
This study identifies the increasing use of big data analytics in healthcare as one of the prime reasons driving the big data spending in healthcare sector market growth during the next few years. Also, increasing adoption of wearable technologies and growing inclination toward cloud-based analytics solutions will lead to sizable demand in the market.
The report on the big data spending in healthcare sector market covers the following areas:
- Big Data Spending In Healthcare Sector Market sizing
- Big Data Spending In Healthcare Sector Market forecast
- Big Data Spending In Healthcare Sector Market industry analysis
The robust vendor analysis is designed to help clients improve their market position, and in line with this, this report provides a detailed analysis of several leading big data spending in healthcare sector market vendors that include Amazon.com Inc., Cisco Systems Inc., Cloudera Inc., Cognizant Technology Solutions Corp., Couchbase Inc., Dell Technologies Inc., Google LLC, Health Catalyst Inc., Hewlett Packard Enterprise Co., Hitachi Ltd., International Business Machines Corp., McKesson Corp., Medeanalytics Inc., Microsoft Corp., Oracle Corp., SAP SE, SAS Institute Inc., Splunk Inc., Teradata Corp., and Vizient Inc.. Also, the big data spending in healthcare sector market analysis report includes information on upcoming trends and challenges that will influence market growth. This is to help companies strategize and leverage all forthcoming growth opportunities.
The publisher presents a detailed picture of the market by the way of study, synthesis, and summation of data from multiple sources by an analysis of key parameters such as profit, pricing, competition, and promotions. It presents various market facets by identifying the key industry influencers. The data presented is comprehensive, reliable, and a result of extensive primary and secondary research. The market research reports provide a complete competitive landscape and an in-depth vendor selection methodology and analysis using qualitative and quantitative research to forecast accurate market growth.
Table of Contents
1 Executive Summary
- 1.1 Market overview
- Executive Summary - Chart on Market Overview
- Executive Summary - Data Table on Market Overview
- Executive Summary - Chart on Global Market Characteristics
- Executive Summary - Chart on Market By Geographical Landscape
- Executive Summary - Chart on Market Segmentation by Service
- Executive Summary - Chart on Market Segmentation by Type
- Executive Summary - Chart on Market Segmentation by Application
- Executive Summary - Chart on Incremental Growth
- Executive Summary - Data Table on Incremental Growth
- Executive Summary - Chart on Company Market Positioning
2 Technavio Analysis
- 2.1 Analysis of price sensitivity, lifecycle, customer purchase basket, adoption rates, and purchase criteria
- Analysis of price sensitivity, lifecycle, customer purchase basket, adoption rates, and purchase criteria
- 2.2 Criticality of inputs and Factors of differentiation
- Overview on criticality of inputs and factors of differentiation
- 2.3 Factors of disruption
- Overview on factors of disruption
- 2.4 Impact of drivers and challenges
- Impact of drivers and challenges in 2024 and 2029
3 Market Landscape
- 3.1 Market ecosystem
- Parent Market
- Data Table on - Parent Market
- 3.2 Market characteristics
- Market characteristics analysis
- 3.3 Value chain analysis
- Value chain analysis
4 Market Sizing
- 4.1 Market definition
- Offerings of companies included in the market definition
- 4.2 Market segment analysis
- Market segments
- 4.3 Market size 2024
- 4.4 Market outlook: Forecast for 2024-2029
- Chart on Global - Market size and forecast 2024-2029 ($ million)
- Data Table on Global - Market size and forecast 2024-2029 ($ million)
- Chart on Global Market: Year-over-year growth 2024-2029 (%)
- Data Table on Global Market: Year-over-year growth 2024-2029 (%)
5 Historic Market Size
- 5.1 Global Big Data Spending Market In Healthcare Sector 2019 - 2023
- Historic Market Size - Data Table on Global Big Data Spending Market In Healthcare Sector 2019 - 2023 ($ million)
- 5.2 Service segment analysis 2019 - 2023
- Historic Market Size - Service Segment 2019 - 2023 ($ million)
- 5.3 Type segment analysis 2019 - 2023
- Historic Market Size - Type Segment 2019 - 2023 ($ million)
- 5.4 Application segment analysis 2019 - 2023
- Historic Market Size - Application Segment 2019 - 2023 ($ million)
- 5.5 Geography segment analysis 2019 - 2023
- Historic Market Size - Geography Segment 2019 - 2023 ($ million)
- 5.6 Country segment analysis 2019 - 2023
- Historic Market Size - Country Segment 2019 - 2023 ($ million)
6 Qualitative Analysis
- 6.1 The impact of AI in the global big data spending market in healthcare sector
7 Five Forces Analysis
- 7.1 Five forces summary
- Five forces analysis - Comparison between 2024 and 2029
- 7.2 Bargaining power of buyers
- Bargaining power of buyers - Impact of key factors 2024 and 2029
- 7.3 Bargaining power of suppliers
- Bargaining power of suppliers - Impact of key factors in 2024 and 2029
- 7.4 Threat of new entrants
- Threat of new entrants - Impact of key factors in 2024 and 2029
- 7.5 Threat of substitutes
- Threat of substitutes - Impact of key factors in 2024 and 2029
- 7.6 Threat of rivalry
- Threat of rivalry - Impact of key factors in 2024 and 2029
- 7.7 Market condition
- Chart on Market condition - Five forces 2024 and 2029
8 Market Segmentation by Service
- 8.1 Market segments
- Chart on Service - Market share 2024-2029 (%)
- Data Table on Service - Market share 2024-2029 (%)
- 8.2 Comparison by Service
- Chart on Comparison by Service
- Data Table on Comparison by Service
- 8.3 Services - Market size and forecast 2024-2029
- Chart on Services - Market size and forecast 2024-2029 ($ million)
- Data Table on Services - Market size and forecast 2024-2029 ($ million)
- Chart on Services - Year-over-year growth 2024-2029 (%)
- Data Table on Services - Year-over-year growth 2024-2029 (%)
- 8.4 Software - Market size and forecast 2024-2029
- Chart on Software - Market size and forecast 2024-2029 ($ million)
- Data Table on Software - Market size and forecast 2024-2029 ($ million)
- Chart on Software - Year-over-year growth 2024-2029 (%)
- Data Table on Software - Year-over-year growth 2024-2029 (%)
- 8.5 Market opportunity by Service
- Market opportunity by Service ($ million)
- Data Table on Market opportunity by Service ($ million)
9 Market Segmentation by Type
- 9.1 Market segments
- Chart on Type - Market share 2024-2029 (%)
- Data Table on Type - Market share 2024-2029 (%)
- 9.2 Comparison by Type
- Chart on Comparison by Type
- Data Table on Comparison by Type
- 9.3 Descriptive analytics - Market size and forecast 2024-2029
- Chart on Descriptive analytics - Market size and forecast 2024-2029 ($ million)
- Data Table on Descriptive analytics - Market size and forecast 2024-2029 ($ million)
- Chart on Descriptive analytics - Year-over-year growth 2024-2029 (%)
- Data Table on Descriptive analytics - Year-over-year growth 2024-2029 (%)
- 9.4 Predictive analytics - Market size and forecast 2024-2029
- Chart on Predictive analytics - Market size and forecast 2024-2029 ($ million)
- Data Table on Predictive analytics - Market size and forecast 2024-2029 ($ million)
- Chart on Predictive analytics - Year-over-year growth 2024-2029 (%)
- Data Table on Predictive analytics - Year-over-year growth 2024-2029 (%)
- 9.5 Prescriptive analytics - Market size and forecast 2024-2029
- Chart on Prescriptive analytics - Market size and forecast 2024-2029 ($ million)
- Data Table on Prescriptive analytics - Market size and forecast 2024-2029 ($ million)
- Chart on Prescriptive analytics - Year-over-year growth 2024-2029 (%)
- Data Table on Prescriptive analytics - Year-over-year growth 2024-2029 (%)
- 9.6 Diagnostic analytics - Market size and forecast 2024-2029
- Chart on Diagnostic analytics - Market size and forecast 2024-2029 ($ million)
- Data Table on Diagnostic analytics - Market size and forecast 2024-2029 ($ million)
- Chart on Diagnostic analytics - Year-over-year growth 2024-2029 (%)
- Data Table on Diagnostic analytics - Year-over-year growth 2024-2029 (%)
- 9.7 Market opportunity by Type
- Market opportunity by Type ($ million)
- Data Table on Market opportunity by Type ($ million)
10 Market Segmentation by Application
- 10.1 Market segments
- Chart on Application - Market share 2024-2029 (%)
- Data Table on Application - Market share 2024-2029 (%)
- 10.2 Comparison by Application
- Chart on Comparison by Application
- Data Table on Comparison by Application
- 10.3 Financial analytics - Market size and forecast 2024-2029
- Chart on Financial analytics - Market size and forecast 2024-2029 ($ million)
- Data Table on Financial analytics - Market size and forecast 2024-2029 ($ million)
- Chart on Financial analytics - Year-over-year growth 2024-2029 (%)
- Data Table on Financial analytics - Year-over-year growth 2024-2029 (%)
- 10.4 Population health management - Market size and forecast 2024-2029
- Chart on Population health management - Market size and forecast 2024-2029 ($ million)
- Data Table on Population health management - Market size and forecast 2024-2029 ($ million)
- Chart on Population health management - Year-over-year growth 2024-2029 (%)
- Data Table on Population health management - Year-over-year growth 2024-2029 (%)
- 10.5 Clinical decision support - Market size and forecast 2024-2029
- Chart on Clinical decision support - Market size and forecast 2024-2029 ($ million)
- Data Table on Clinical decision support - Market size and forecast 2024-2029 ($ million)
- Chart on Clinical decision support - Year-over-year growth 2024-2029 (%)
- Data Table on Clinical decision support - Year-over-year growth 2024-2029 (%)
- 10.6 Operational analytics - Market size and forecast 2024-2029
- Chart on Operational analytics - Market size and forecast 2024-2029 ($ million)
- Data Table on Operational analytics - Market size and forecast 2024-2029 ($ million)
- Chart on Operational analytics - Year-over-year growth 2024-2029 (%)
- Data Table on Operational analytics - Year-over-year growth 2024-2029 (%)
- 10.7 Others - Market size and forecast 2024-2029
- Chart on Others - Market size and forecast 2024-2029 ($ million)
- Data Table on Others - Market size and forecast 2024-2029 ($ million)
- Chart on Others - Year-over-year growth 2024-2029 (%)
- Data Table on Others - Year-over-year growth 2024-2029 (%)
- 10.8 Market opportunity by Application
- Market opportunity by Application ($ million)
- Data Table on Market opportunity by Application ($ million)
11 Customer Landscape
- 11.1 Customer landscape overview
- Analysis of price sensitivity, lifecycle, customer purchase basket, adoption rates, and purchase criteria
12 Geographic Landscape
- 12.1 Geographic segmentation
- Chart on Market share By Geographical Landscape 2024-2029 (%)
- Data Table on Market share By Geographical Landscape 2024-2029 (%)
- 12.2 Geographic comparison
- Chart on Geographic comparison
- Data Table on Geographic comparison
- 12.3 North America - Market size and forecast 2024-2029
- Chart on North America - Market size and forecast 2024-2029 ($ million)
- Data Table on North America - Market size and forecast 2024-2029 ($ million)
- Chart on North America - Year-over-year growth 2024-2029 (%)
- Data Table on North America - Year-over-year growth 2024-2029 (%)
- 12.4 Europe - Market size and forecast 2024-2029
- Chart on Europe - Market size and forecast 2024-2029 ($ million)
- Data Table on Europe - Market size and forecast 2024-2029 ($ million)
- Chart on Europe - Year-over-year growth 2024-2029 (%)
- Data Table on Europe - Year-over-year growth 2024-2029 (%)
- 12.5 APAC - Market size and forecast 2024-2029
- Chart on APAC - Market size and forecast 2024-2029 ($ million)
- Data Table on APAC - Market size and forecast 2024-2029 ($ million)
- Chart on APAC - Year-over-year growth 2024-2029 (%)
- Data Table on APAC - Year-over-year growth 2024-2029 (%)
- 12.6 Middle East and Africa - Market size and forecast 2024-2029
- Chart on Middle East and Africa - Market size and forecast 2024-2029 ($ million)
- Data Table on Middle East and Africa - Market size and forecast 2024-2029 ($ million)
- Chart on Middle East and Africa - Year-over-year growth 2024-2029 (%)
- Data Table on Middle East and Africa - Year-over-year growth 2024-2029 (%)
- 12.7 South America - Market size and forecast 2024-2029
- Chart on South America - Market size and forecast 2024-2029 ($ million)
- Data Table on South America - Market size and forecast 2024-2029 ($ million)
- Chart on South America - Year-over-year growth 2024-2029 (%)
- Data Table on South America - Year-over-year growth 2024-2029 (%)
- 12.8 US - Market size and forecast 2024-2029
- Chart on US - Market size and forecast 2024-2029 ($ million)
- Data Table on US - Market size and forecast 2024-2029 ($ million)
- Chart on US - Year-over-year growth 2024-2029 (%)
- Data Table on US - Year-over-year growth 2024-2029 (%)
- 12.9 India - Market size and forecast 2024-2029
- Chart on India - Market size and forecast 2024-2029 ($ million)
- Data Table on India - Market size and forecast 2024-2029 ($ million)
- Chart on India - Year-over-year growth 2024-2029 (%)
- Data Table on India - Year-over-year growth 2024-2029 (%)
- 12.10 UK - Market size and forecast 2024-2029
- Chart on UK - Market size and forecast 2024-2029 ($ million)
- Data Table on UK - Market size and forecast 2024-2029 ($ million)
- Chart on UK - Year-over-year growth 2024-2029 (%)
- Data Table on UK - Year-over-year growth 2024-2029 (%)
- 12.11 Germany - Market size and forecast 2024-2029
- Chart on Germany - Market size and forecast 2024-2029 ($ million)
- Data Table on Germany - Market size and forecast 2024-2029 ($ million)
- Chart on Germany - Year-over-year growth 2024-2029 (%)
- Data Table on Germany - Year-over-year growth 2024-2029 (%)
- 12.12 China - Market size and forecast 2024-2029
- Chart on China - Market size and forecast 2024-2029 ($ million)
- Data Table on China - Market size and forecast 2024-2029 ($ million)
- Chart on China - Year-over-year growth 2024-2029 (%)
- Data Table on China - Year-over-year growth 2024-2029 (%)
- 12.13 Canada - Market size and forecast 2024-2029
- Chart on Canada - Market size and forecast 2024-2029 ($ million)
- Data Table on Canada - Market size and forecast 2024-2029 ($ million)
- Chart on Canada - Year-over-year growth 2024-2029 (%)
- Data Table on Canada - Year-over-year growth 2024-2029 (%)
- 12.14 France - Market size and forecast 2024-2029
- Chart on France - Market size and forecast 2024-2029 ($ million)
- Data Table on France - Market size and forecast 2024-2029 ($ million)
- Chart on France - Year-over-year growth 2024-2029 (%)
- Data Table on France - Year-over-year growth 2024-2029 (%)
- 12.15 Philippines - Market size and forecast 2024-2029
- Chart on Philippines - Market size and forecast 2024-2029 ($ million)
- Data Table on Philippines - Market size and forecast 2024-2029 ($ million)
- Chart on Philippines - Year-over-year growth 2024-2029 (%)
- Data Table on Philippines - Year-over-year growth 2024-2029 (%)
- 12.16 Ireland - Market size and forecast 2024-2029
- Chart on Ireland - Market size and forecast 2024-2029 ($ million)
- Data Table on Ireland - Market size and forecast 2024-2029 ($ million)
- Chart on Ireland - Year-over-year growth 2024-2029 (%)
- Data Table on Ireland - Year-over-year growth 2024-2029 (%)
- 12.17 Brazil - Market size and forecast 2024-2029
- Chart on Brazil - Market size and forecast 2024-2029 ($ million)
- Data Table on Brazil - Market size and forecast 2024-2029 ($ million)
- Chart on Brazil - Year-over-year growth 2024-2029 (%)
- Data Table on Brazil - Year-over-year growth 2024-2029 (%)
- 12.18 Market opportunity By Geographical Landscape
- Market opportunity By Geographical Landscape ($ million)
- Data Tables on Market opportunity By Geographical Landscape ($ million)
13 Drivers, Challenges, and Opportunity/Restraints
- 13.1 Market drivers
- 13.2 Market challenges
- 13.3 Impact of drivers and challenges
- Impact of drivers and challenges in 2024 and 2029
- 13.4 Market opportunities/restraints
14 Competitive Landscape
- 14.1 Overview
- 14.2 Competitive Landscape
- Overview on criticality of inputs and factors of differentiation
- 14.3 Landscape disruption
- Overview on factors of disruption
- 14.4 Industry risks
- Impact of key risks on business
15 Competitive Analysis
- 15.1 Companies profiled
- Companies covered
- 15.2 Company ranking index
- Company ranking index
- 15.3 Market positioning of companies
- Matrix on companies position and classification
- 15.4 Amazon.com Inc.
- Amazon.com Inc. - Overview
- Amazon.com Inc. - Business segments
- Amazon.com Inc. - Key news
- Amazon.com Inc. - Key offerings
- Amazon.com Inc. - Segment focus
- SWOT
- 15.5 Cisco Systems Inc.
- Cisco Systems Inc. - Overview
- Cisco Systems Inc. - Business segments
- Cisco Systems Inc. - Key news
- Cisco Systems Inc. - Key offerings
- Cisco Systems Inc. - Segment focus
- SWOT
- 15.6 Cloudera Inc.
- Cloudera Inc. - Overview
- Cloudera Inc. - Product / Service
- Cloudera Inc. - Key offerings
- SWOT
- 15.7 Cognizant Technology Solutions Corp.
- Cognizant Technology Solutions Corp. - Overview
- Cognizant Technology Solutions Corp. - Business segments
- Cognizant Technology Solutions Corp. - Key news
- Cognizant Technology Solutions Corp. - Key offerings
- Cognizant Technology Solutions Corp. - Segment focus
- SWOT
- 15.8 Couchbase Inc.
- Couchbase Inc. - Overview
- Couchbase Inc. - Product / Service
- Couchbase Inc. - Key offerings
- SWOT
- 15.9 Dell Technologies Inc.
- Dell Technologies Inc. - Overview
- Dell Technologies Inc. - Business segments
- Dell Technologies Inc. - Key news
- Dell Technologies Inc. - Key offerings
- Dell Technologies Inc. - Segment focus
- SWOT
- 15.10 Google LLC
- Google LLC - Overview
- Google LLC - Product / Service
- Google LLC - Key offerings
- SWOT
- 15.11 Health Catalyst Inc.
- Health Catalyst Inc. - Overview
- Health Catalyst Inc. - Business segments
- Health Catalyst Inc. - Key offerings
- Health Catalyst Inc. - Segment focus
- SWOT
- 15.12 Hewlett Packard Enterprise Co.
- Hewlett Packard Enterprise Co. - Overview
- Hewlett Packard Enterprise Co. - Business segments
- Hewlett Packard Enterprise Co. - Key news
- Hewlett Packard Enterprise Co. - Key offerings
- Hewlett Packard Enterprise Co. - Segment focus
- SWOT
- 15.13 Hitachi Ltd.
- Hitachi Ltd. - Overview
- Hitachi Ltd. - Business segments
- Hitachi Ltd. - Key news
- Hitachi Ltd. - Key offerings
- Hitachi Ltd. - Segment focus
- SWOT
- 15.14 International Business Machines Corp.
- International Business Machines Corp. - Overview
- International Business Machines Corp. - Business segments
- International Business Machines Corp. - Key news
- International Business Machines Corp. - Key offerings
- International Business Machines Corp. - Segment focus
- SWOT
- 15.15 McKesson Corp.
- McKesson Corp. - Overview
- McKesson Corp. - Business segments
- McKesson Corp. - Key news
- McKesson Corp. - Key offerings
- McKesson Corp. - Segment focus
- SWOT
- 15.16 Microsoft Corp.
- Microsoft Corp. - Overview
- Microsoft Corp. - Business segments
- Microsoft Corp. - Key news
- Microsoft Corp. - Key offerings
- Microsoft Corp. - Segment focus
- SWOT
- 15.17 Oracle Corp.
- Oracle Corp. - Overview
- Oracle Corp. - Business segments
- Oracle Corp. - Key news
- Oracle Corp. - Key offerings
- Oracle Corp. - Segment focus
- SWOT
- 15.18 SAP SE
- SAP SE - Overview
- SAP SE - Business segments
- SAP SE - Key news
- SAP SE - Key offerings
- SAP SE - Segment focus
- SWOT
16 Appendix
- 16.1 Scope of the report
- 16.2 Inclusions and exclusions checklist
- Inclusions checklist
- Exclusions checklist
- 16.3 Currency conversion rates for US$
- Currency conversion rates for US$
- 16.4 Research methodology
- Research methodology
- 16.5 Data procurement
- Information sources
- 16.6 Data validation
- Data validation
- 16.7 Validation techniques employed for market sizing
- Validation techniques employed for market sizing
- 16.8 Data synthesis
- Data synthesis
- 16.9 360 degree market analysis
- 360 degree market analysis
- 16.10 List of abbreviations
- List of abbreviations

