|
|
市場調査レポート
商品コード
1581067
チャートレコーダーの世界市場 (2024~2028年)Global Chart Recorder Market 2024-2028 |
||||||
|
|||||||
カスタマイズ可能
|
|||||||


| チャートレコーダーの世界市場 (2024~2028年) |
|
出版日: 2024年10月17日
発行: TechNavio
ページ情報: 英文 206 Pages
納期: 即納可能
|

全表示
- 概要
- 図表
- 目次
チャートレコーダー市場 (2024~2028年)
チャートレコーダー市場は2023年から2028年に4億6,450万米ドル分拡大し、予測期間中に5.9%で成長すると予測されます。当レポートでは、チャートレコーダー市場の全体的な分析、市場規模・予測、動向、成長促進要因、課題、約25社のベンダーを網羅したベンダー分析などを掲載しています。
当レポートでは、現在の市場シナリオ、最新動向と促進要因、市場環境全体に関する最新分析を提供しています。この市場は、世界の製造量の増加、医療分野への投資の増加、新しい発電所の立ち上げによって牽引されています。
| 市場範囲 | |
|---|---|
| 基準年 | 2024年 |
| 終了年 | 2028年 |
| 予測期間 | 2024~2028年 |
| 成長モメンタム | 加速 |
| 前年比 (2024年) | 4.5% |
| CAGR | 5.9% |
| 増分額 | 4億6,450万米ドル |
当レポートでは、今後数年間のチャートレコーダー市場成長を牽引する主な要因の1つとして、Webベースのチャートレコーダーの導入を挙げています。また、ペーパーレスチャートレコーダーの発売やWi-fiデータロガーの登場は、市場の大きな需要につながります。
目次
第1章 エグゼクティブサマリー
- 市場概要
第2章 Technavioによる分析
- 価格感応度・ライフサイクル・顧客購入バスケット・採用率・購入基準の分析
- インプットの重要性と差別化の要因
- 混乱の要因
- 促進要因と課題の影響
第3章 市場情勢
- 市場エコシステム
- 市場の特徴
- バリューチェーン分析
第4章 市場規模の評価
- 市場の定義
- 市場セグメント分析
- 市場規模 (2023年)
- 市場の見通し (2023~2028年)
第5章 市場規模実績
- チャートレコーダーの世界市場 (2018~2022年)
- 種類別分析 (2018~2022年)
- 用途別分析 (2018~2022年)
- 地域別分析 (2018~2022年)
- 国別分析 (2018~2022年)
第6章 定性分析
- 世界のチャートレコーダー市場におけるAIの影響
第7章 ファイブフォース分析
- ファイブフォースの要約
- 買い手の交渉力
- 供給企業の交渉力
- 新規参入業者の脅威
- 代替品の脅威
- 競争の脅威
- 市況
第8章 市場セグメンテーション:タイプ別
- 市場セグメンテーション
- 比較:タイプ別
- デジタルチャートレコーダー:市場規模と予測 (2023~2028年)
- アナログチャートレコーダー:市場規模と予測 (2023~2028年)
- タイプ別の市場機会
第9章 市場セグメンテーション:用途別
- 市場セグメンテーション
- 比較:用途別
- 食品・飲料:市場規模と予測 (2023~2028年)
- 医薬品:市場規模と予測 (2023~2028年)
- 産業用途:市場規模と予測 (2023~2028年)
- 環境モニタリング:市場規模と予測 (2023~2028年)
- 用途別の市場機会
第10章 顧客情勢
- 顧客情勢の概要
第11章 地域別情勢
- 地域別セグメンテーション
- 地域別比較
- 北米:市場規模と予測 (2023~2028年)
- アジア太平洋:市場規模と予測 (2023~2028年)
- 欧州:市場規模と予測 (2023~2028年)
- 南米:市場規模と予測 (2023~2028年)
- 中東・アフリカ:市場規模と予測 (2023~2028年)
- 米国:市場規模と予測 (2023~2028年)
- 中国:市場規模と予測 (2023~2028年)
- カナダ:市場規模と予測 (2023~2028年)
- ドイツ:市場規模と予測 (2023~2028年)
- 日本:市場規模と予測 (2023~2028年)
- 英国:市場規模と予測 (2023~2028年)
- インド:市場規模と予測 (2023~2028年)
- フランス:市場規模と予測 (2023~2028年)
- イタリア:市場規模と予測 (2023~2028年)
- 韓国:市場規模と予測 (2023~2028年)
- 地域別の市場機会
第12章 促進要因・課題・機会・抑制要因
- 市場促進要因
- 市場の課題
- 促進要因と課題の影響
- 市場の機会・抑制要因
第13章 競合情勢
- 概要
- 競合情勢
- 混乱の状況
- 業界のリスク
第14章 競合分析
- 企業プロファイル
- 企業ランキング指数
- 企業の市場ポジショニング
- ABB Ltd.
- BrainChild Electronic Co. Ltd.
- British Rototherm Group
- Dickson Inc.
- Endress Hauser Group Services AG
- Future Design Controls Inc.
- HIOKI E.E. Corp.
- Honeywell International Inc.
- JUMO India Pvt. Ltd.
- KOBOLD Instrumentatie BV
- Monarch Instrument
- Omega Engineering Inc.
- Siemens AG
- Watlow Electric Manufacturing Co.
- Yokogawa Electric Corp.
第15章 付録
Exhibits:
- Exhibits1: Executive Summary - Chart on Market Overview
- Exhibits2: Executive Summary - Data Table on Market Overview
- Exhibits3: Executive Summary - Chart on Global Market Characteristics
- Exhibits4: Executive Summary - Chart on Market By Geographical Landscape
- Exhibits5: Executive Summary - Chart on Market Segmentation by Type
- Exhibits6: Executive Summary - Chart on Market Segmentation by Application
- Exhibits7: Executive Summary - Chart on Incremental Growth
- Exhibits8: Executive Summary - Data Table on Incremental Growth
- Exhibits9: Executive Summary - Chart on Company Market Positioning
- Exhibits10: Analysis of price sensitivity, lifecycle, customer purchase basket, adoption rates, and purchase criteria
- Exhibits11: Overview on criticality of inputs and factors of differentiation
- Exhibits12: Overview on factors of disruption
- Exhibits13: Impact of drivers and challenges in 2023 and 2028
- Exhibits14: Parent Market
- Exhibits15: Data Table on - Parent Market
- Exhibits16: Market characteristics analysis
- Exhibits17: Value Chain Analysis
- Exhibits18: Offerings of companies included in the market definition
- Exhibits19: Market segments
- Exhibits20: Chart on Global - Market size and forecast 2023-2028 ($ million)
- Exhibits21: Data Table on Global - Market size and forecast 2023-2028 ($ million)
- Exhibits22: Chart on Global Market: Year-over-year growth 2023-2028 (%)
- Exhibits23: Data Table on Global Market: Year-over-year growth 2023-2028 (%)
- Exhibits24: Historic Market Size - Data Table on Global Chart Recorder Market 2018 - 2022 ($ million)
- Exhibits25: Historic Market Size - Type Segment 2018 - 2022 ($ million)
- Exhibits26: Historic Market Size - Application Segment 2018 - 2022 ($ million)
- Exhibits27: Historic Market Size - Geography Segment 2018 - 2022 ($ million)
- Exhibits28: Historic Market Size - Country Segment 2018 - 2022 ($ million)
- Exhibits29: Five forces analysis - Comparison between 2023 and 2028
- Exhibits30: Bargaining power of buyers - Impact of key factors 2023 and 2028
- Exhibits31: Bargaining power of suppliers - Impact of key factors in 2023 and 2028
- Exhibits32: Threat of new entrants - Impact of key factors in 2023 and 2028
- Exhibits33: Threat of substitutes - Impact of key factors in 2023 and 2028
- Exhibits34: Threat of rivalry - Impact of key factors in 2023 and 2028
- Exhibits35: Chart on Market condition - Five forces 2023 and 2028
- Exhibits36: Chart on Type - Market share 2023-2028 (%)
- Exhibits37: Data Table on Type - Market share 2023-2028 (%)
- Exhibits38: Chart on Comparison by Type
- Exhibits39: Data Table on Comparison by Type
- Exhibits40: Chart on Digital chart recorders - Market size and forecast 2023-2028 ($ million)
- Exhibits41: Data Table on Digital chart recorders - Market size and forecast 2023-2028 ($ million)
- Exhibits42: Chart on Digital chart recorders - Year-over-year growth 2023-2028 (%)
- Exhibits43: Data Table on Digital chart recorders - Year-over-year growth 2023-2028 (%)
- Exhibits44: Chart on Analog chart recorders - Market size and forecast 2023-2028 ($ million)
- Exhibits45: Data Table on Analog chart recorders - Market size and forecast 2023-2028 ($ million)
- Exhibits46: Chart on Analog chart recorders - Year-over-year growth 2023-2028 (%)
- Exhibits47: Data Table on Analog chart recorders - Year-over-year growth 2023-2028 (%)
- Exhibits48: Market opportunity by Type ($ million)
- Exhibits49: Data Table on Market opportunity by Type ($ million)
- Exhibits50: Chart on Application - Market share 2023-2028 (%)
- Exhibits51: Data Table on Application - Market share 2023-2028 (%)
- Exhibits52: Chart on Comparison by Application
- Exhibits53: Data Table on Comparison by Application
- Exhibits54: Chart on Food and beverage - Market size and forecast 2023-2028 ($ million)
- Exhibits55: Data Table on Food and beverage - Market size and forecast 2023-2028 ($ million)
- Exhibits56: Chart on Food and beverage - Year-over-year growth 2023-2028 (%)
- Exhibits57: Data Table on Food and beverage - Year-over-year growth 2023-2028 (%)
- Exhibits58: Chart on Pharmaceuticals - Market size and forecast 2023-2028 ($ million)
- Exhibits59: Data Table on Pharmaceuticals - Market size and forecast 2023-2028 ($ million)
- Exhibits60: Chart on Pharmaceuticals - Year-over-year growth 2023-2028 (%)
- Exhibits61: Data Table on Pharmaceuticals - Year-over-year growth 2023-2028 (%)
- Exhibits62: Chart on Industrial applications - Market size and forecast 2023-2028 ($ million)
- Exhibits63: Data Table on Industrial applications - Market size and forecast 2023-2028 ($ million)
- Exhibits64: Chart on Industrial applications - Year-over-year growth 2023-2028 (%)
- Exhibits65: Data Table on Industrial applications - Year-over-year growth 2023-2028 (%)
- Exhibits66: Chart on Environmental monitoring - Market size and forecast 2023-2028 ($ million)
- Exhibits67: Data Table on Environmental monitoring - Market size and forecast 2023-2028 ($ million)
- Exhibits68: Chart on Environmental monitoring - Year-over-year growth 2023-2028 (%)
- Exhibits69: Data Table on Environmental monitoring - Year-over-year growth 2023-2028 (%)
- Exhibits70: Market opportunity by Application ($ million)
- Exhibits71: Data Table on Market opportunity by Application ($ million)
- Exhibits72: Analysis of price sensitivity, lifecycle, customer purchase basket, adoption rates, and purchase criteria
- Exhibits73: Chart on Market share By Geographical Landscape 2023-2028 (%)
- Exhibits74: Data Table on Market share By Geographical Landscape 2023-2028 (%)
- Exhibits75: Chart on Geographic comparison
- Exhibits76: Data Table on Geographic comparison
- Exhibits77: Chart on North America - Market size and forecast 2023-2028 ($ million)
- Exhibits78: Data Table on North America - Market size and forecast 2023-2028 ($ million)
- Exhibits79: Chart on North America - Year-over-year growth 2023-2028 (%)
- Exhibits80: Data Table on North America - Year-over-year growth 2023-2028 (%)
- Exhibits81: Chart on APAC - Market size and forecast 2023-2028 ($ million)
- Exhibits82: Data Table on APAC - Market size and forecast 2023-2028 ($ million)
- Exhibits83: Chart on APAC - Year-over-year growth 2023-2028 (%)
- Exhibits84: Data Table on APAC - Year-over-year growth 2023-2028 (%)
- Exhibits85: Chart on Europe - Market size and forecast 2023-2028 ($ million)
- Exhibits86: Data Table on Europe - Market size and forecast 2023-2028 ($ million)
- Exhibits87: Chart on Europe - Year-over-year growth 2023-2028 (%)
- Exhibits88: Data Table on Europe - Year-over-year growth 2023-2028 (%)
- Exhibits89: Chart on South America - Market size and forecast 2023-2028 ($ million)
- Exhibits90: Data Table on South America - Market size and forecast 2023-2028 ($ million)
- Exhibits91: Chart on South America - Year-over-year growth 2023-2028 (%)
- Exhibits92: Data Table on South America - Year-over-year growth 2023-2028 (%)
- Exhibits93: Chart on Middle East and Africa - Market size and forecast 2023-2028 ($ million)
- Exhibits94: Data Table on Middle East and Africa - Market size and forecast 2023-2028 ($ million)
- Exhibits95: Chart on Middle East and Africa - Year-over-year growth 2023-2028 (%)
- Exhibits96: Data Table on Middle East and Africa - Year-over-year growth 2023-2028 (%)
- Exhibits97: Chart on US - Market size and forecast 2023-2028 ($ million)
- Exhibits98: Data Table on US - Market size and forecast 2023-2028 ($ million)
- Exhibits99: Chart on US - Year-over-year growth 2023-2028 (%)
- Exhibits100: Data Table on US - Year-over-year growth 2023-2028 (%)
- Exhibits101: Chart on China - Market size and forecast 2023-2028 ($ million)
- Exhibits102: Data Table on China - Market size and forecast 2023-2028 ($ million)
- Exhibits103: Chart on China - Year-over-year growth 2023-2028 (%)
- Exhibits104: Data Table on China - Year-over-year growth 2023-2028 (%)
- Exhibits105: Chart on Canada - Market size and forecast 2023-2028 ($ million)
- Exhibits106: Data Table on Canada - Market size and forecast 2023-2028 ($ million)
- Exhibits107: Chart on Canada - Year-over-year growth 2023-2028 (%)
- Exhibits108: Data Table on Canada - Year-over-year growth 2023-2028 (%)
- Exhibits109: Chart on Germany - Market size and forecast 2023-2028 ($ million)
- Exhibits110: Data Table on Germany - Market size and forecast 2023-2028 ($ million)
- Exhibits111: Chart on Germany - Year-over-year growth 2023-2028 (%)
- Exhibits112: Data Table on Germany - Year-over-year growth 2023-2028 (%)
- Exhibits113: Chart on Japan - Market size and forecast 2023-2028 ($ million)
- Exhibits114: Data Table on Japan - Market size and forecast 2023-2028 ($ million)
- Exhibits115: Chart on Japan - Year-over-year growth 2023-2028 (%)
- Exhibits116: Data Table on Japan - Year-over-year growth 2023-2028 (%)
- Exhibits117: Chart on UK - Market size and forecast 2023-2028 ($ million)
- Exhibits118: Data Table on UK - Market size and forecast 2023-2028 ($ million)
- Exhibits119: Chart on UK - Year-over-year growth 2023-2028 (%)
- Exhibits120: Data Table on UK - Year-over-year growth 2023-2028 (%)
- Exhibits121: Chart on India - Market size and forecast 2023-2028 ($ million)
- Exhibits122: Data Table on India - Market size and forecast 2023-2028 ($ million)
- Exhibits123: Chart on India - Year-over-year growth 2023-2028 (%)
- Exhibits124: Data Table on India - Year-over-year growth 2023-2028 (%)
- Exhibits125: Chart on France - Market size and forecast 2023-2028 ($ million)
- Exhibits126: Data Table on France - Market size and forecast 2023-2028 ($ million)
- Exhibits127: Chart on France - Year-over-year growth 2023-2028 (%)
- Exhibits128: Data Table on France - Year-over-year growth 2023-2028 (%)
- Exhibits129: Chart on Italy - Market size and forecast 2023-2028 ($ million)
- Exhibits130: Data Table on Italy - Market size and forecast 2023-2028 ($ million)
- Exhibits131: Chart on Italy - Year-over-year growth 2023-2028 (%)
- Exhibits132: Data Table on Italy - Year-over-year growth 2023-2028 (%)
- Exhibits133: Chart on South Korea - Market size and forecast 2023-2028 ($ million)
- Exhibits134: Data Table on South Korea - Market size and forecast 2023-2028 ($ million)
- Exhibits135: Chart on South Korea - Year-over-year growth 2023-2028 (%)
- Exhibits136: Data Table on South Korea - Year-over-year growth 2023-2028 (%)
- Exhibits137: Market opportunity By Geographical Landscape ($ million)
- Exhibits138: Data Tables on Market opportunity By Geographical Landscape ($ million)
- Exhibits139: Impact of drivers and challenges in 2023 and 2028
- Exhibits140: Overview on criticality of inputs and factors of differentiation
- Exhibits141: Overview on factors of disruption
- Exhibits142: Impact of key risks on business
- Exhibits143: Companies covered
- Exhibits144: Company ranking index
- Exhibits145: Matrix on companies position and classification
- Exhibits146: ABB Ltd. - Overview
- Exhibits147: ABB Ltd. - Business segments
- Exhibits148: ABB Ltd. - Key news
- Exhibits149: ABB Ltd. - Key offerings
- Exhibits150: ABB Ltd. - Segment focus
- Exhibits151: SWOT
- Exhibits152: BrainChild Electronic Co. Ltd. - Overview
- Exhibits153: BrainChild Electronic Co. Ltd. - Product / Service
- Exhibits154: BrainChild Electronic Co. Ltd. - Key offerings
- Exhibits155: SWOT
- Exhibits156: British Rototherm Group - Overview
- Exhibits157: British Rototherm Group - Product / Service
- Exhibits158: British Rototherm Group - Key offerings
- Exhibits159: SWOT
- Exhibits160: Dickson Inc. - Overview
- Exhibits161: Dickson Inc. - Product / Service
- Exhibits162: Dickson Inc. - Key offerings
- Exhibits163: SWOT
- Exhibits164: Endress Hauser Group Services AG - Overview
- Exhibits165: Endress Hauser Group Services AG - Product / Service
- Exhibits166: Endress Hauser Group Services AG - Key news
- Exhibits167: Endress Hauser Group Services AG - Key offerings
- Exhibits168: SWOT
- Exhibits169: Future Design Controls Inc. - Overview
- Exhibits170: Future Design Controls Inc. - Product / Service
- Exhibits171: Future Design Controls Inc. - Key offerings
- Exhibits172: SWOT
- Exhibits173: HIOKI E.E. Corp. - Overview
- Exhibits174: HIOKI E.E. Corp. - Business segments
- Exhibits175: HIOKI E.E. Corp. - Key offerings
- Exhibits176: HIOKI E.E. Corp. - Segment focus
- Exhibits177: SWOT
- Exhibits178: Honeywell International Inc. - Overview
- Exhibits179: Honeywell International Inc. - Business segments
- Exhibits180: Honeywell International Inc. - Key news
- Exhibits181: Honeywell International Inc. - Key offerings
- Exhibits182: Honeywell International Inc. - Segment focus
- Exhibits183: SWOT
- Exhibits184: JUMO India Pvt. Ltd. - Overview
- Exhibits185: JUMO India Pvt. Ltd. - Product / Service
- Exhibits186: JUMO India Pvt. Ltd. - Key offerings
- Exhibits187: SWOT
- Exhibits188: KOBOLD Instrumentatie BV - Overview
- Exhibits189: KOBOLD Instrumentatie BV - Product / Service
- Exhibits190: KOBOLD Instrumentatie BV - Key offerings
- Exhibits191: SWOT
- Exhibits192: Monarch Instrument - Overview
- Exhibits193: Monarch Instrument - Product / Service
- Exhibits194: Monarch Instrument - Key offerings
- Exhibits195: SWOT
- Exhibits196: Omega Engineering Inc. - Overview
- Exhibits197: Omega Engineering Inc. - Product / Service
- Exhibits198: Omega Engineering Inc. - Key offerings
- Exhibits199: SWOT
- Exhibits200: Siemens AG - Overview
- Exhibits201: Siemens AG - Business segments
- Exhibits202: Siemens AG - Key news
- Exhibits203: Siemens AG - Key offerings
- Exhibits204: Siemens AG - Segment focus
- Exhibits205: SWOT
- Exhibits206: Watlow Electric Manufacturing Co. - Overview
- Exhibits207: Watlow Electric Manufacturing Co. - Product / Service
- Exhibits208: Watlow Electric Manufacturing Co. - Key offerings
- Exhibits209: SWOT
- Exhibits210: Yokogawa Electric Corp. - Overview
- Exhibits211: Yokogawa Electric Corp. - Business segments
- Exhibits212: Yokogawa Electric Corp. - Key news
- Exhibits213: Yokogawa Electric Corp. - Key offerings
- Exhibits214: Yokogawa Electric Corp. - Segment focus
- Exhibits215: SWOT
- Exhibits216: Inclusions checklist
- Exhibits217: Exclusions checklist
- Exhibits218: Currency conversion rates for US$
- Exhibits219: Research methodology
- Exhibits220: Information sources
- Exhibits221: Data validation
- Exhibits222: Validation techniques employed for market sizing
- Exhibits223: Data synthesis
- Exhibits224: 360 degree market analysis
- Exhibits225: List of abbreviations
Chart Recorder Market 2024-2028
The chart recorder market is forecasted to grow by USD 464.5 mn during 2023-2028, accelerating at a CAGR of 5.9% during the forecast period. The report on the chart recorder market provides a holistic analysis, market size and forecast, trends, growth drivers, and challenges, as well as vendor analysis covering around 25 vendors.
The report offers an up-to-date analysis regarding the current market scenario, the latest trends and drivers, and the overall market environment. The market is driven by global manufacturing volume growth, rising investments in healthcare sector, and launch of new power plants.
| Market Scope | |
|---|---|
| Base Year | 2024 |
| End Year | 2028 |
| Series Year | 2024-2028 |
| Growth Momentum | Accelerate |
| YOY 2024 | 4.5% |
| CAGR | 5.9% |
| Incremental Value | $464.5 mn |
Technavio's chart recorder market is segmented as below:
By Type
- Digital chart recorders
- Analog chart recorders
By Application
- Food and beverage
- Pharmaceuticals
- Industrial applications
- Environmental monitoring
By Geographical Landscape
- North America
- APAC
- Europe
- South America
- Middle East and Africa
This study identifies the introduction of web-based chart recorders as one of the prime reasons driving the chart recorder market growth during the next few years. Also, launch of paperless chart recorders and advent of wi-fi data loggers will lead to sizable demand in the market.
The report on the chart recorder market covers the following areas:
- Chart Recorder Market sizing
- Chart Recorder Market forecast
- Chart Recorder Market industry analysis
The robust vendor analysis is designed to help clients improve their market position, and in line with this, this report provides a detailed analysis of several leading chart recorder market vendors that include ABB Ltd., BrainChild Electronic Co. Ltd., British Rototherm Group, CHINO Works America Inc, Cole Parmer Instrument Co. LLC, Dickson Inc., Dwyer Instruments LLC, Endress Hauser Group Services AG, Future Design Controls Inc., Harvard Apparatus, HIOKI E.E. Corp., Honeywell International Inc., JUMO India Pvt. Ltd., KOBOLD Instrumentatie BV, Linseis Messgerate GmbH, Monarch Instrument, Omega Engineering Inc., Siemens AG, Watlow Electric Manufacturing Co., and Yokogawa Electric Corp.. Also, the chart recorder market analysis report includes information on upcoming trends and challenges that will influence market growth. This is to help companies strategize and leverage all forthcoming growth opportunities.
The study was conducted using an objective combination of primary and secondary information including inputs from key participants in the industry. The report contains a comprehensive market and vendor landscape in addition to an analysis of the key vendors.
The publisher presents a detailed picture of the market by the way of study, synthesis, and summation of data from multiple sources by an analysis of key parameters such as profit, pricing, competition, and promotions. It presents various market facets by identifying the key industry influencers. The data presented is comprehensive, reliable, and a result of extensive primary and secondary research. The market research reports provide a complete competitive landscape and an in-depth vendor selection methodology and analysis using qualitative and quantitative research to forecast accurate market growth.
Table of Contents
1 Executive Summary
- 1.1 Market overview
- Executive Summary - Chart on Market Overview
- Executive Summary - Data Table on Market Overview
- Executive Summary - Chart on Global Market Characteristics
- Executive Summary - Chart on Market By Geographical Landscape
- Executive Summary - Chart on Market Segmentation by Type
- Executive Summary - Chart on Market Segmentation by Application
- Executive Summary - Chart on Incremental Growth
- Executive Summary - Data Table on Incremental Growth
- Executive Summary - Chart on Company Market Positioning
2 Technavio Analysis
- 2.1 Analysis of price sensitivity, lifecycle, customer purchase basket, adoption rates, and purchase criteria
- Analysis of price sensitivity, lifecycle, customer purchase basket, adoption rates, and purchase criteria
- 2.2 Criticality of inputs and Factors of differentiation
- Overview on criticality of inputs and factors of differentiation
- 2.3 Factors of disruption
- Overview on factors of disruption
- 2.4 Impact of drivers and challenges
- Impact of drivers and challenges in 2023 and 2028
3 Market Landscape
- 3.1 Market ecosystem
- Parent Market
- Data Table on - Parent Market
- 3.2 Market characteristics
- Market characteristics analysis
- 3.3 Value chain analysis
- Value Chain Analysis
4 Market Sizing
- 4.1 Market definition
- Offerings of companies included in the market definition
- 4.2 Market segment analysis
- Market segments
- 4.3 Market size 2023
- 4.4 Market outlook: Forecast for 2023-2028
- Chart on Global - Market size and forecast 2023-2028 ($ million)
- Data Table on Global - Market size and forecast 2023-2028 ($ million)
- Chart on Global Market: Year-over-year growth 2023-2028 (%)
- Data Table on Global Market: Year-over-year growth 2023-2028 (%)
5 Historic Market Size
- 5.1 Global Chart Recorder Market 2018 - 2022
- Historic Market Size - Data Table on Global Chart Recorder Market 2018 - 2022 ($ million)
- 5.2 Type segment analysis 2018 - 2022
- Historic Market Size - Type Segment 2018 - 2022 ($ million)
- 5.3 Application segment analysis 2018 - 2022
- Historic Market Size - Application Segment 2018 - 2022 ($ million)
- 5.4 Geography segment analysis 2018 - 2022
- Historic Market Size - Geography Segment 2018 - 2022 ($ million)
- 5.5 Country segment analysis 2018 - 2022
- Historic Market Size - Country Segment 2018 - 2022 ($ million)
6 Qualitative Analysis
- 6.1 Impact of AI on the Global Chart Recorder Market
7 Five Forces Analysis
- 7.1 Five forces summary
- Five forces analysis - Comparison between 2023 and 2028
- 7.2 Bargaining power of buyers
- Bargaining power of buyers - Impact of key factors 2023 and 2028
- 7.3 Bargaining power of suppliers
- Bargaining power of suppliers - Impact of key factors in 2023 and 2028
- 7.4 Threat of new entrants
- Threat of new entrants - Impact of key factors in 2023 and 2028
- 7.5 Threat of substitutes
- Threat of substitutes - Impact of key factors in 2023 and 2028
- 7.6 Threat of rivalry
- Threat of rivalry - Impact of key factors in 2023 and 2028
- 7.7 Market condition
- Chart on Market condition - Five forces 2023 and 2028
8 Market Segmentation by Type
- 8.1 Market segments
- Chart on Type - Market share 2023-2028 (%)
- Data Table on Type - Market share 2023-2028 (%)
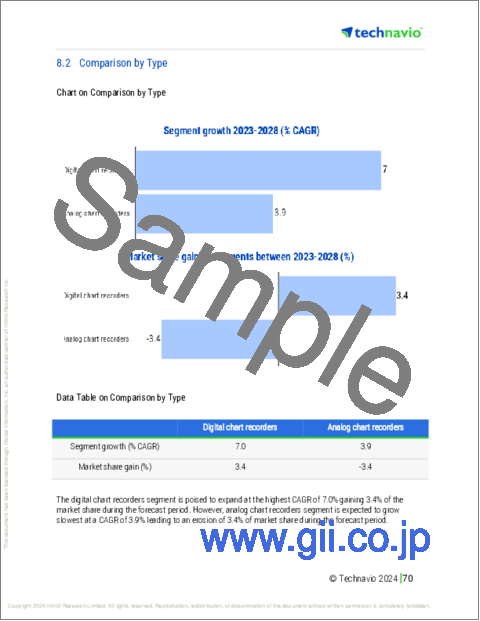
- 8.2 Comparison by Type
- Chart on Comparison by Type
- Data Table on Comparison by Type
- 8.3 Digital chart recorders - Market size and forecast 2023-2028
- Chart on Digital chart recorders - Market size and forecast 2023-2028 ($ million)
- Data Table on Digital chart recorders - Market size and forecast 2023-2028 ($ million)
- Chart on Digital chart recorders - Year-over-year growth 2023-2028 (%)
- Data Table on Digital chart recorders - Year-over-year growth 2023-2028 (%)
- 8.4 Analog chart recorders - Market size and forecast 2023-2028
- Chart on Analog chart recorders - Market size and forecast 2023-2028 ($ million)
- Data Table on Analog chart recorders - Market size and forecast 2023-2028 ($ million)
- Chart on Analog chart recorders - Year-over-year growth 2023-2028 (%)
- Data Table on Analog chart recorders - Year-over-year growth 2023-2028 (%)
- 8.5 Market opportunity by Type
- Market opportunity by Type ($ million)
- Data Table on Market opportunity by Type ($ million)
9 Market Segmentation by Application
- 9.1 Market segments
- Chart on Application - Market share 2023-2028 (%)
- Data Table on Application - Market share 2023-2028 (%)
- 9.2 Comparison by Application
- Chart on Comparison by Application
- Data Table on Comparison by Application
- 9.3 Food and beverage - Market size and forecast 2023-2028
- Chart on Food and beverage - Market size and forecast 2023-2028 ($ million)
- Data Table on Food and beverage - Market size and forecast 2023-2028 ($ million)
- Chart on Food and beverage - Year-over-year growth 2023-2028 (%)
- Data Table on Food and beverage - Year-over-year growth 2023-2028 (%)
- 9.4 Pharmaceuticals - Market size and forecast 2023-2028
- Chart on Pharmaceuticals - Market size and forecast 2023-2028 ($ million)
- Data Table on Pharmaceuticals - Market size and forecast 2023-2028 ($ million)
- Chart on Pharmaceuticals - Year-over-year growth 2023-2028 (%)
- Data Table on Pharmaceuticals - Year-over-year growth 2023-2028 (%)
- 9.5 Industrial applications - Market size and forecast 2023-2028
- Chart on Industrial applications - Market size and forecast 2023-2028 ($ million)
- Data Table on Industrial applications - Market size and forecast 2023-2028 ($ million)
- Chart on Industrial applications - Year-over-year growth 2023-2028 (%)
- Data Table on Industrial applications - Year-over-year growth 2023-2028 (%)
- 9.6 Environmental monitoring - Market size and forecast 2023-2028
- Chart on Environmental monitoring - Market size and forecast 2023-2028 ($ million)
- Data Table on Environmental monitoring - Market size and forecast 2023-2028 ($ million)
- Chart on Environmental monitoring - Year-over-year growth 2023-2028 (%)
- Data Table on Environmental monitoring - Year-over-year growth 2023-2028 (%)
- 9.7 Market opportunity by Application
- Market opportunity by Application ($ million)
- Data Table on Market opportunity by Application ($ million)
10 Customer Landscape
- 10.1 Customer landscape overview
- Analysis of price sensitivity, lifecycle, customer purchase basket, adoption rates, and purchase criteria
11 Geographic Landscape
- 11.1 Geographic segmentation
- Chart on Market share By Geographical Landscape 2023-2028 (%)
- Data Table on Market share By Geographical Landscape 2023-2028 (%)
- 11.2 Geographic comparison
- Chart on Geographic comparison
- Data Table on Geographic comparison
- 11.3 North America - Market size and forecast 2023-2028
- Chart on North America - Market size and forecast 2023-2028 ($ million)
- Data Table on North America - Market size and forecast 2023-2028 ($ million)
- Chart on North America - Year-over-year growth 2023-2028 (%)
- Data Table on North America - Year-over-year growth 2023-2028 (%)
- 11.4 APAC - Market size and forecast 2023-2028
- Chart on APAC - Market size and forecast 2023-2028 ($ million)
- Data Table on APAC - Market size and forecast 2023-2028 ($ million)
- Chart on APAC - Year-over-year growth 2023-2028 (%)
- Data Table on APAC - Year-over-year growth 2023-2028 (%)
- 11.5 Europe - Market size and forecast 2023-2028
- Chart on Europe - Market size and forecast 2023-2028 ($ million)
- Data Table on Europe - Market size and forecast 2023-2028 ($ million)
- Chart on Europe - Year-over-year growth 2023-2028 (%)
- Data Table on Europe - Year-over-year growth 2023-2028 (%)
- 11.6 South America - Market size and forecast 2023-2028
- Chart on South America - Market size and forecast 2023-2028 ($ million)
- Data Table on South America - Market size and forecast 2023-2028 ($ million)
- Chart on South America - Year-over-year growth 2023-2028 (%)
- Data Table on South America - Year-over-year growth 2023-2028 (%)
- 11.7 Middle East and Africa - Market size and forecast 2023-2028
- Chart on Middle East and Africa - Market size and forecast 2023-2028 ($ million)
- Data Table on Middle East and Africa - Market size and forecast 2023-2028 ($ million)
- Chart on Middle East and Africa - Year-over-year growth 2023-2028 (%)
- Data Table on Middle East and Africa - Year-over-year growth 2023-2028 (%)
- 11.8 US - Market size and forecast 2023-2028
- Chart on US - Market size and forecast 2023-2028 ($ million)
- Data Table on US - Market size and forecast 2023-2028 ($ million)
- Chart on US - Year-over-year growth 2023-2028 (%)
- Data Table on US - Year-over-year growth 2023-2028 (%)
- 11.9 China - Market size and forecast 2023-2028
- Chart on China - Market size and forecast 2023-2028 ($ million)
- Data Table on China - Market size and forecast 2023-2028 ($ million)
- Chart on China - Year-over-year growth 2023-2028 (%)
- Data Table on China - Year-over-year growth 2023-2028 (%)
- 11.10 Canada - Market size and forecast 2023-2028
- Chart on Canada - Market size and forecast 2023-2028 ($ million)
- Data Table on Canada - Market size and forecast 2023-2028 ($ million)
- Chart on Canada - Year-over-year growth 2023-2028 (%)
- Data Table on Canada - Year-over-year growth 2023-2028 (%)
- 11.11 Germany - Market size and forecast 2023-2028
- Chart on Germany - Market size and forecast 2023-2028 ($ million)
- Data Table on Germany - Market size and forecast 2023-2028 ($ million)
- Chart on Germany - Year-over-year growth 2023-2028 (%)
- Data Table on Germany - Year-over-year growth 2023-2028 (%)
- 11.12 Japan - Market size and forecast 2023-2028
- Chart on Japan - Market size and forecast 2023-2028 ($ million)
- Data Table on Japan - Market size and forecast 2023-2028 ($ million)
- Chart on Japan - Year-over-year growth 2023-2028 (%)
- Data Table on Japan - Year-over-year growth 2023-2028 (%)
- 11.13 UK - Market size and forecast 2023-2028
- Chart on UK - Market size and forecast 2023-2028 ($ million)
- Data Table on UK - Market size and forecast 2023-2028 ($ million)
- Chart on UK - Year-over-year growth 2023-2028 (%)
- Data Table on UK - Year-over-year growth 2023-2028 (%)
- 11.14 India - Market size and forecast 2023-2028
- Chart on India - Market size and forecast 2023-2028 ($ million)
- Data Table on India - Market size and forecast 2023-2028 ($ million)
- Chart on India - Year-over-year growth 2023-2028 (%)
- Data Table on India - Year-over-year growth 2023-2028 (%)
- 11.15 France - Market size and forecast 2023-2028
- Chart on France - Market size and forecast 2023-2028 ($ million)
- Data Table on France - Market size and forecast 2023-2028 ($ million)
- Chart on France - Year-over-year growth 2023-2028 (%)
- Data Table on France - Year-over-year growth 2023-2028 (%)
- 11.16 Italy - Market size and forecast 2023-2028
- Chart on Italy - Market size and forecast 2023-2028 ($ million)
- Data Table on Italy - Market size and forecast 2023-2028 ($ million)
- Chart on Italy - Year-over-year growth 2023-2028 (%)
- Data Table on Italy - Year-over-year growth 2023-2028 (%)
- 11.17 South Korea - Market size and forecast 2023-2028
- Chart on South Korea - Market size and forecast 2023-2028 ($ million)
- Data Table on South Korea - Market size and forecast 2023-2028 ($ million)
- Chart on South Korea - Year-over-year growth 2023-2028 (%)
- Data Table on South Korea - Year-over-year growth 2023-2028 (%)
- 11.18 Market opportunity By Geographical Landscape
- Market opportunity By Geographical Landscape ($ million)
- Data Tables on Market opportunity By Geographical Landscape ($ million)
12 Drivers, Challenges, and Opportunity/Restraints
- 12.1 Market drivers
- 12.2 Market challenges
- 12.3 Impact of drivers and challenges
- Impact of drivers and challenges in 2023 and 2028
- 12.4 Market opportunities/restraints
13 Competitive Landscape
- 13.1 Overview
- 13.2 Competitive Landscape
- Overview on criticality of inputs and factors of differentiation
- 13.3 Landscape disruption
- Overview on factors of disruption
- 13.4 Industry risks
- Impact of key risks on business
14 Competitive Analysis
- 14.1 Companies profiled
- Companies covered
- 14.2 Company ranking index
- Company ranking index
- 14.3 Market positioning of companies
- Matrix on companies position and classification
- 14.4 ABB Ltd.
- ABB Ltd. - Overview
- ABB Ltd. - Business segments
- ABB Ltd. - Key news
- ABB Ltd. - Key offerings
- ABB Ltd. - Segment focus
- SWOT
- 14.5 BrainChild Electronic Co. Ltd.
- BrainChild Electronic Co. Ltd. - Overview
- BrainChild Electronic Co. Ltd. - Product / Service
- BrainChild Electronic Co. Ltd. - Key offerings
- SWOT
- 14.6 British Rototherm Group
- British Rototherm Group - Overview
- British Rototherm Group - Product / Service
- British Rototherm Group - Key offerings
- SWOT
- 14.7 Dickson Inc.
- Dickson Inc. - Overview
- Dickson Inc. - Product / Service
- Dickson Inc. - Key offerings
- SWOT
- 14.8 Endress Hauser Group Services AG
- Endress Hauser Group Services AG - Overview
- Endress Hauser Group Services AG - Product / Service
- Endress Hauser Group Services AG - Key news
- Endress Hauser Group Services AG - Key offerings
- SWOT
- 14.9 Future Design Controls Inc.
- Future Design Controls Inc. - Overview
- Future Design Controls Inc. - Product / Service
- Future Design Controls Inc. - Key offerings
- SWOT
- 14.10 HIOKI E.E. Corp.
- HIOKI E.E. Corp. - Overview
- HIOKI E.E. Corp. - Business segments
- HIOKI E.E. Corp. - Key offerings
- HIOKI E.E. Corp. - Segment focus
- SWOT
- 14.11 Honeywell International Inc.
- Honeywell International Inc. - Overview
- Honeywell International Inc. - Business segments
- Honeywell International Inc. - Key news
- Honeywell International Inc. - Key offerings
- Honeywell International Inc. - Segment focus
- SWOT
- 14.12 JUMO India Pvt. Ltd.
- JUMO India Pvt. Ltd. - Overview
- JUMO India Pvt. Ltd. - Product / Service
- JUMO India Pvt. Ltd. - Key offerings
- SWOT
- 14.13 KOBOLD Instrumentatie BV
- KOBOLD Instrumentatie BV - Overview
- KOBOLD Instrumentatie BV - Product / Service
- KOBOLD Instrumentatie BV - Key offerings
- SWOT
- 14.14 Monarch Instrument
- Monarch Instrument - Overview
- Monarch Instrument - Product / Service
- Monarch Instrument - Key offerings
- SWOT
- 14.15 Omega Engineering Inc.
- Omega Engineering Inc. - Overview
- Omega Engineering Inc. - Product / Service
- Omega Engineering Inc. - Key offerings
- SWOT
- 14.16 Siemens AG
- Siemens AG - Overview
- Siemens AG - Business segments
- Siemens AG - Key news
- Siemens AG - Key offerings
- Siemens AG - Segment focus
- SWOT
- 14.17 Watlow Electric Manufacturing Co.
- Watlow Electric Manufacturing Co. - Overview
- Watlow Electric Manufacturing Co. - Product / Service
- Watlow Electric Manufacturing Co. - Key offerings
- SWOT
- 14.18 Yokogawa Electric Corp.
- Yokogawa Electric Corp. - Overview
- Yokogawa Electric Corp. - Business segments
- Yokogawa Electric Corp. - Key news
- Yokogawa Electric Corp. - Key offerings
- Yokogawa Electric Corp. - Segment focus
- SWOT
15 Appendix
- 15.1 Scope of the report
- 15.2 Inclusions and exclusions checklist
- Inclusions checklist
- Exclusions checklist
- 15.3 Currency conversion rates for US$
- Currency conversion rates for US$
- 15.4 Research methodology
- Research methodology
- 15.5 Data procurement
- Information sources
- 15.6 Data validation
- Data validation
- 15.7 Validation techniques employed for market sizing
- Validation techniques employed for market sizing
- 15.8 Data synthesis
- Data synthesis
- 15.9 360 degree market analysis
- 360 degree market analysis
- 15.10 List of abbreviations
- List of abbreviations
