|
|
市場調査レポート
商品コード
1581066
UWBアンカーとタグの世界市場、2024~2028年Global UWB Anchor and Tags Market 2024-2028 |
||||||
|
|||||||
カスタマイズ可能
|
|||||||

| UWBアンカーとタグの世界市場、2024~2028年 |
|
出版日: 2024年10月16日
発行: TechNavio
ページ情報: 英文 198 Pages
納期: 即納可能
|

全表示
- 概要
- 図表
- 目次
UWBアンカーとタグ市場、2024~2028年
UWBアンカーとタグ市場は2023~2028年に15億1,230万米ドル、予測期間中のCAGRは14.8%で成長すると予測されます。当レポートでは、UWBアンカーとタグ市場の全体的な分析、市場規模・予測、動向、成長促進要因、課題、約25のベンダーを網羅したベンダー分析などを掲載しています。
現在の市場シナリオ、最新動向と促進要因、市場環境全体に関する最新分析を提供しています。市場は、エンドユーザー産業におけるrtls需要の増加、自動車用途におけるUWB技術の採用拡大、IoTとスマートデバイスの拡大が牽引しています。
| 市場範囲 | |
|---|---|
| 基準年 | 2024年 |
| 終了年 | 2028年 |
| 予測期間 | 2024~2028年 |
| 成長モメンタム | 加速 |
| 前年比[2024年] | 14.1% |
| CAGR | 14.8% |
| 増分額 | 15億1,230万米ドル |
本調査では、今後数年間におけるUWBアンカーとタグ市場の成長を促進する主要要因の1つとして、ベンダーが新製品投入に注力するようになっていることを挙げています。また、ベンダーによる無機的な戦略の採用が増加し、カスタマイズ型uwbアンカーやタグが利用可能になることで、市場の大きな需要が見込まれます。
目次
第1章 エグゼクティブサマリー
- 市場概要
第2章 Technavio分析
- 価格・ライフサイクル・顧客購入バスケット・採用率・購入基準の分析
- インプットの重要性と差別化の要因
- 混乱の要因
- 促進要因と課題の影響
第3章 市場情勢
- 市場エコシステム
- 市場の特徴
- バリューチェーン分析
第4章 市場規模の評価
- 市場の定義
- 市場セグメント分析
- 市場規模 2023年
- 市場の展望 2023~2028年
第5章 市場規模実績
- UWBアンカーとタグの世界市場 2018~2022年
- コンポーネント別セグメント分析 2018~2022年
- 技術別セグメント分析 2018~2022年
- 地域別セグメント分析 2018~2022年
- 国別セグメント分析 2018~2022年
第6章 定性分析
- AIの影響-UWBアンカーとタグの世界市場
第7章 ファイブフォース分析
- ファイブフォースの要約
- 買い手の交渉力
- 供給企業の交渉力
- 新規参入業者の脅威
- 代替品の脅威
- 競争の脅威
- 市況
第8章 市場セグメンテーション:コンポーネント別
- 市場セグメンテーション
- 比較:コンポーネント別
- タグ:市場規模と予測 2023~2028年
- アンカー:市場規模と予測 2023~2028年
- コンポーネント別の市場機会
第9章 市場セグメンテーション:技術別
- 市場セグメンテーション
- 比較:技術別
- 屋内測位:市場規模と予測 2023~2028年
- 屋外測位:市場規模と予測 2023~2028年
- 技術別の市場機会
第10章 顧客情勢
- 顧客情勢概要
第11章 地域別情勢
- 地域別セグメンテーション
- 比較:地域別
- 北米:市場規模と予測 2023~2028年
- 欧州:市場規模と予測 2023~2028年
- アジア太平洋:市場規模と予測 2023~2028年
- 南米:市場規模と予測 2023~2028年
- 中東・アフリカ:市場規模と予測 2023~2028年
- 米国:市場規模と予測 2023~2028年
- ドイツ:市場規模と予測 2023~2028年
- 英国:市場規模と予測 2023~2028年
- 中国:市場規模と予測 2023~2028年
- フランス:市場規模と予測 2023~2028年
- 日本:市場規模と予測 2023~2028年
- インド:市場規模と予測 2023~2028年
- カナダ:市場規模と予測 2023~2028年
- 韓国:市場規模と予測 2023~2028年
- ブラジル:市場規模と予測 2023~2028年
- 地域情勢別の市場機会
第12章 促進要因・課題・機会・抑制要因
- 市場促進要因
- 市場課題
- 促進要因と課題の影響
- 市場の機会・抑制要因
第13章 競合情勢
- 概要
- 競合情勢
- 混乱の状況
- 業界のリスク
第14章 競合分析
- 企業プロファイル
- 企業ランキング指数
- 企業の市場ポジショニング
- ASSA ABLOY AB
- BlueIOT Technology Co Ltd.
- Estimote Inc.
- Kinexon GmbH
- Murata Manufacturing Co. Ltd.
- Nanotron Technologies GmbH
- NXP Semiconductors NV
- Qorvo Inc.
- Sewio Networks s r o
- Shenzhen Skylab Co LTD
- STMicroelectronics International N.V.
- Taoglas Group Holdings Ltd.
- Ubisense Ltd.
- Zebra Technologies Corp.
- ZIGPOS GmbH
第15章 付録
Exhibits:
- Exhibits1: Executive Summary - Chart on Market Overview
- Exhibits2: Executive Summary - Data Table on Market Overview
- Exhibits3: Executive Summary - Chart on Global Market Characteristics
- Exhibits4: Executive Summary - Chart on Market By Geographical Landscape
- Exhibits5: Executive Summary - Chart on Market Segmentation by Component
- Exhibits6: Executive Summary - Chart on Market Segmentation by Technology
- Exhibits7: Executive Summary - Chart on Incremental Growth
- Exhibits8: Executive Summary - Data Table on Incremental Growth
- Exhibits9: Executive Summary - Chart on Company Market Positioning
- Exhibits10: Analysis of price sensitivity, lifecycle, customer purchase basket, adoption rates, and purchase criteria
- Exhibits11: Overview on criticality of inputs and factors of differentiation
- Exhibits12: Overview on factors of disruption
- Exhibits13: Impact of drivers and challenges in 2023 and 2028
- Exhibits14: Parent Market
- Exhibits15: Data Table on - Parent Market
- Exhibits16: Market characteristics analysis
- Exhibits17: Value Chain Analysis
- Exhibits18: Offerings of companies included in the market definition
- Exhibits19: Market segments
- Exhibits20: Chart on Global - Market size and forecast 2023-2028 ($ million)
- Exhibits21: Data Table on Global - Market size and forecast 2023-2028 ($ million)
- Exhibits22: Chart on Global Market: Year-over-year growth 2023-2028 (%)
- Exhibits23: Data Table on Global Market: Year-over-year growth 2023-2028 (%)
- Exhibits24: Historic Market Size - Data Table on Global UWB Anchor And Tags Market 2018 - 2022 ($ million)
- Exhibits25: Historic Market Size - Component Segment 2018 - 2022 ($ million)
- Exhibits26: Historic Market Size - Technology Segment 2018 - 2022 ($ million)
- Exhibits27: Historic Market Size - Geography Segment 2018 - 2022 ($ million)
- Exhibits28: Historic Market Size - Country Segment 2018 - 2022 ($ million)
- Exhibits29: Five forces analysis - Comparison between 2023 and 2028
- Exhibits30: Bargaining power of buyers - Impact of key factors 2023 and 2028
- Exhibits31: Bargaining power of suppliers - Impact of key factors in 2023 and 2028
- Exhibits32: Threat of new entrants - Impact of key factors in 2023 and 2028
- Exhibits33: Threat of substitutes - Impact of key factors in 2023 and 2028
- Exhibits34: Threat of rivalry - Impact of key factors in 2023 and 2028
- Exhibits35: Chart on Market condition - Five forces 2023 and 2028
- Exhibits36: Chart on Component - Market share 2023-2028 (%)
- Exhibits37: Data Table on Component - Market share 2023-2028 (%)
- Exhibits38: Chart on Comparison by Component
- Exhibits39: Data Table on Comparison by Component
- Exhibits40: Chart on Tags - Market size and forecast 2023-2028 ($ million)
- Exhibits41: Data Table on Tags - Market size and forecast 2023-2028 ($ million)
- Exhibits42: Chart on Tags - Year-over-year growth 2023-2028 (%)
- Exhibits43: Data Table on Tags - Year-over-year growth 2023-2028 (%)
- Exhibits44: Chart on Anchors - Market size and forecast 2023-2028 ($ million)
- Exhibits45: Data Table on Anchors - Market size and forecast 2023-2028 ($ million)
- Exhibits46: Chart on Anchors - Year-over-year growth 2023-2028 (%)
- Exhibits47: Data Table on Anchors - Year-over-year growth 2023-2028 (%)
- Exhibits48: Market opportunity by Component ($ million)
- Exhibits49: Data Table on Market opportunity by Component ($ million)
- Exhibits50: Chart on Technology - Market share 2023-2028 (%)
- Exhibits51: Data Table on Technology - Market share 2023-2028 (%)
- Exhibits52: Chart on Comparison by Technology
- Exhibits53: Data Table on Comparison by Technology
- Exhibits54: Chart on Indoor positioning - Market size and forecast 2023-2028 ($ million)
- Exhibits55: Data Table on Indoor positioning - Market size and forecast 2023-2028 ($ million)
- Exhibits56: Chart on Indoor positioning - Year-over-year growth 2023-2028 (%)
- Exhibits57: Data Table on Indoor positioning - Year-over-year growth 2023-2028 (%)
- Exhibits58: Chart on Outdoor positioning - Market size and forecast 2023-2028 ($ million)
- Exhibits59: Data Table on Outdoor positioning - Market size and forecast 2023-2028 ($ million)
- Exhibits60: Chart on Outdoor positioning - Year-over-year growth 2023-2028 (%)
- Exhibits61: Data Table on Outdoor positioning - Year-over-year growth 2023-2028 (%)
- Exhibits62: Market opportunity by Technology ($ million)
- Exhibits63: Data Table on Market opportunity by Technology ($ million)
- Exhibits64: Analysis of price sensitivity, lifecycle, customer purchase basket, adoption rates, and purchase criteria
- Exhibits65: Chart on Market share By Geographical Landscape 2023-2028 (%)
- Exhibits66: Data Table on Market share By Geographical Landscape 2023-2028 (%)
- Exhibits67: Chart on Geographic comparison
- Exhibits68: Data Table on Geographic comparison
- Exhibits69: Chart on North America - Market size and forecast 2023-2028 ($ million)
- Exhibits70: Data Table on North America - Market size and forecast 2023-2028 ($ million)
- Exhibits71: Chart on North America - Year-over-year growth 2023-2028 (%)
- Exhibits72: Data Table on North America - Year-over-year growth 2023-2028 (%)
- Exhibits73: Chart on Europe - Market size and forecast 2023-2028 ($ million)
- Exhibits74: Data Table on Europe - Market size and forecast 2023-2028 ($ million)
- Exhibits75: Chart on Europe - Year-over-year growth 2023-2028 (%)
- Exhibits76: Data Table on Europe - Year-over-year growth 2023-2028 (%)
- Exhibits77: Chart on APAC - Market size and forecast 2023-2028 ($ million)
- Exhibits78: Data Table on APAC - Market size and forecast 2023-2028 ($ million)
- Exhibits79: Chart on APAC - Year-over-year growth 2023-2028 (%)
- Exhibits80: Data Table on APAC - Year-over-year growth 2023-2028 (%)
- Exhibits81: Chart on South America - Market size and forecast 2023-2028 ($ million)
- Exhibits82: Data Table on South America - Market size and forecast 2023-2028 ($ million)
- Exhibits83: Chart on South America - Year-over-year growth 2023-2028 (%)
- Exhibits84: Data Table on South America - Year-over-year growth 2023-2028 (%)
- Exhibits85: Chart on Middle East and Africa - Market size and forecast 2023-2028 ($ million)
- Exhibits86: Data Table on Middle East and Africa - Market size and forecast 2023-2028 ($ million)
- Exhibits87: Chart on Middle East and Africa - Year-over-year growth 2023-2028 (%)
- Exhibits88: Data Table on Middle East and Africa - Year-over-year growth 2023-2028 (%)
- Exhibits89: Chart on US - Market size and forecast 2023-2028 ($ million)
- Exhibits90: Data Table on US - Market size and forecast 2023-2028 ($ million)
- Exhibits91: Chart on US - Year-over-year growth 2023-2028 (%)
- Exhibits92: Data Table on US - Year-over-year growth 2023-2028 (%)
- Exhibits93: Chart on Germany - Market size and forecast 2023-2028 ($ million)
- Exhibits94: Data Table on Germany - Market size and forecast 2023-2028 ($ million)
- Exhibits95: Chart on Germany - Year-over-year growth 2023-2028 (%)
- Exhibits96: Data Table on Germany - Year-over-year growth 2023-2028 (%)
- Exhibits97: Chart on UK - Market size and forecast 2023-2028 ($ million)
- Exhibits98: Data Table on UK - Market size and forecast 2023-2028 ($ million)
- Exhibits99: Chart on UK - Year-over-year growth 2023-2028 (%)
- Exhibits100: Data Table on UK - Year-over-year growth 2023-2028 (%)
- Exhibits101: Chart on China - Market size and forecast 2023-2028 ($ million)
- Exhibits102: Data Table on China - Market size and forecast 2023-2028 ($ million)
- Exhibits103: Chart on China - Year-over-year growth 2023-2028 (%)
- Exhibits104: Data Table on China - Year-over-year growth 2023-2028 (%)
- Exhibits105: Chart on France - Market size and forecast 2023-2028 ($ million)
- Exhibits106: Data Table on France - Market size and forecast 2023-2028 ($ million)
- Exhibits107: Chart on France - Year-over-year growth 2023-2028 (%)
- Exhibits108: Data Table on France - Year-over-year growth 2023-2028 (%)
- Exhibits109: Chart on Japan - Market size and forecast 2023-2028 ($ million)
- Exhibits110: Data Table on Japan - Market size and forecast 2023-2028 ($ million)
- Exhibits111: Chart on Japan - Year-over-year growth 2023-2028 (%)
- Exhibits112: Data Table on Japan - Year-over-year growth 2023-2028 (%)
- Exhibits113: Chart on India - Market size and forecast 2023-2028 ($ million)
- Exhibits114: Data Table on India - Market size and forecast 2023-2028 ($ million)
- Exhibits115: Chart on India - Year-over-year growth 2023-2028 (%)
- Exhibits116: Data Table on India - Year-over-year growth 2023-2028 (%)
- Exhibits117: Chart on Canada - Market size and forecast 2023-2028 ($ million)
- Exhibits118: Data Table on Canada - Market size and forecast 2023-2028 ($ million)
- Exhibits119: Chart on Canada - Year-over-year growth 2023-2028 (%)
- Exhibits120: Data Table on Canada - Year-over-year growth 2023-2028 (%)
- Exhibits121: Chart on South Korea - Market size and forecast 2023-2028 ($ million)
- Exhibits122: Data Table on South Korea - Market size and forecast 2023-2028 ($ million)
- Exhibits123: Chart on South Korea - Year-over-year growth 2023-2028 (%)
- Exhibits124: Data Table on South Korea - Year-over-year growth 2023-2028 (%)
- Exhibits125: Chart on Brazil - Market size and forecast 2023-2028 ($ million)
- Exhibits126: Data Table on Brazil - Market size and forecast 2023-2028 ($ million)
- Exhibits127: Chart on Brazil - Year-over-year growth 2023-2028 (%)
- Exhibits128: Data Table on Brazil - Year-over-year growth 2023-2028 (%)
- Exhibits129: Market opportunity By Geographical Landscape ($ million)
- Exhibits130: Data Tables on Market opportunity By Geographical Landscape ($ million)
- Exhibits131: Impact of drivers and challenges in 2023 and 2028
- Exhibits132: Overview on criticality of inputs and factors of differentiation
- Exhibits133: Overview on factors of disruption
- Exhibits134: Impact of key risks on business
- Exhibits135: Companies covered
- Exhibits136: Company ranking index
- Exhibits137: Matrix on companies position and classification
- Exhibits138: ASSA ABLOY AB - Overview
- Exhibits139: ASSA ABLOY AB - Business segments
- Exhibits140: ASSA ABLOY AB - Key news
- Exhibits141: ASSA ABLOY AB - Key offerings
- Exhibits142: ASSA ABLOY AB - Segment focus
- Exhibits143: SWOT
- Exhibits144: BlueIOT Technology Co Ltd. - Overview
- Exhibits145: BlueIOT Technology Co Ltd. - Product / Service
- Exhibits146: BlueIOT Technology Co Ltd. - Key offerings
- Exhibits147: SWOT
- Exhibits148: Estimote Inc. - Overview
- Exhibits149: Estimote Inc. - Product / Service
- Exhibits150: Estimote Inc. - Key offerings
- Exhibits151: SWOT
- Exhibits152: Kinexon GmbH - Overview
- Exhibits153: Kinexon GmbH - Product / Service
- Exhibits154: Kinexon GmbH - Key offerings
- Exhibits155: SWOT
- Exhibits156: Murata Manufacturing Co. Ltd. - Overview
- Exhibits157: Murata Manufacturing Co. Ltd. - Business segments
- Exhibits158: Murata Manufacturing Co. Ltd. - Key news
- Exhibits159: Murata Manufacturing Co. Ltd. - Key offerings
- Exhibits160: Murata Manufacturing Co. Ltd. - Segment focus
- Exhibits161: SWOT
- Exhibits162: Nanotron Technologies GmbH - Overview
- Exhibits163: Nanotron Technologies GmbH - Product / Service
- Exhibits164: Nanotron Technologies GmbH - Key offerings
- Exhibits165: SWOT
- Exhibits166: NXP Semiconductors NV - Overview
- Exhibits167: NXP Semiconductors NV - Product / Service
- Exhibits168: NXP Semiconductors NV - Key news
- Exhibits169: NXP Semiconductors NV - Key offerings
- Exhibits170: SWOT
- Exhibits171: Qorvo Inc. - Overview
- Exhibits172: Qorvo Inc. - Business segments
- Exhibits173: Qorvo Inc. - Key news
- Exhibits174: Qorvo Inc. - Key offerings
- Exhibits175: Qorvo Inc. - Segment focus
- Exhibits176: SWOT
- Exhibits177: Sewio Networks s r o - Overview
- Exhibits178: Sewio Networks s r o - Product / Service
- Exhibits179: Sewio Networks s r o - Key offerings
- Exhibits180: SWOT
- Exhibits181: Shenzhen Skylab Co LTD - Overview
- Exhibits182: Shenzhen Skylab Co LTD - Product / Service
- Exhibits183: Shenzhen Skylab Co LTD - Key offerings
- Exhibits184: SWOT
- Exhibits185: STMicroelectronics International N.V. - Overview
- Exhibits186: STMicroelectronics International N.V. - Business segments
- Exhibits187: STMicroelectronics International N.V. - Key news
- Exhibits188: STMicroelectronics International N.V. - Key offerings
- Exhibits189: STMicroelectronics International N.V. - Segment focus
- Exhibits190: SWOT
- Exhibits191: Taoglas Group Holdings Ltd. - Overview
- Exhibits192: Taoglas Group Holdings Ltd. - Product / Service
- Exhibits193: Taoglas Group Holdings Ltd. - Key offerings
- Exhibits194: SWOT
- Exhibits195: Ubisense Ltd. - Overview
- Exhibits196: Ubisense Ltd. - Product / Service
- Exhibits197: Ubisense Ltd. - Key offerings
- Exhibits198: SWOT
- Exhibits199: Zebra Technologies Corp. - Overview
- Exhibits200: Zebra Technologies Corp. - Business segments
- Exhibits201: Zebra Technologies Corp. - Key news
- Exhibits202: Zebra Technologies Corp. - Key offerings
- Exhibits203: Zebra Technologies Corp. - Segment focus
- Exhibits204: SWOT
- Exhibits205: ZIGPOS GmbH - Overview
- Exhibits206: ZIGPOS GmbH - Product / Service
- Exhibits207: ZIGPOS GmbH - Key offerings
- Exhibits208: SWOT
- Exhibits209: Inclusions checklist
- Exhibits210: Exclusions checklist
- Exhibits211: Currency conversion rates for US$
- Exhibits212: Research methodology
- Exhibits213: Information sources
- Exhibits214: Data validation
- Exhibits215: Validation techniques employed for market sizing
- Exhibits216: Data synthesis
- Exhibits217: 360 degree market analysis
- Exhibits218: List of abbreviations
UWB Anchor And Tags Market 2024-2028
The uwb anchor and tags market is forecasted to grow by USD 1512.3 mn during 2023-2028, accelerating at a CAGR of 14.8% during the forecast period. The report on the uwb anchor and tags market provides a holistic analysis, market size and forecast, trends, growth drivers, and challenges, as well as vendor analysis covering around 25 vendors.
The report offers an up-to-date analysis regarding the current market scenario, the latest trends and drivers, and the overall market environment. The market is driven by increasing demand for rtls in end-user industries, growing adoption of uwb technology in automotive applications, and expansion of iot and smart devices.
| Market Scope | |
|---|---|
| Base Year | 2024 |
| End Year | 2028 |
| Series Year | 2024-2028 |
| Growth Momentum | Accelerate |
| YOY 2024 | 14.1% |
| CAGR | 14.8% |
| Incremental Value | $1512.3 mn |
Technavio's uwb anchor and tags market is segmented as below:
By Component
- Tags
- Anchors
By Technology
- Indoor positioning
- Outdoor positioning
By Geographical Landscape
- North America
- Europe
- APAC
- South America
- Middle East and Africa
This study identifies the increasing focus of vendors on new product launches as one of the prime reasons driving the uwb anchor and tags market growth during the next few years. Also, increasing adoption of inorganic strategies by vendors and availability of customized uwb anchors and tags will lead to sizable demand in the market.
The report on the uwb anchor and tags market covers the following areas:
- UWB Anchor And Tags Market sizing
- UWB Anchor And Tags Market forecast
- UWB Anchor And Tags Market industry analysis
The robust vendor analysis is designed to help clients improve their market position, and in line with this, this report provides a detailed analysis of several leading uwb anchor and tags market vendors that include ASSA ABLOY AB, BlueIOT Technology Co Ltd., Callitrix, Eliko Tehnoloogia Arenduskeskus, Estimote Inc., Kinexon GmbH, Murata Manufacturing Co. Ltd., Nanotron Technologies GmbH, Navigine Corp., NXP Semiconductors NV, Pozyx NV, Qorvo Inc., Quuppa Oy, Sewio Networks s r o, Shenzhen Skylab Co LTD, STMicroelectronics International N.V., Taoglas Group Holdings Ltd., Ubisense Ltd., Zebra Technologies Corp., and ZIGPOS GmbH. Also, the uwb anchor and tags market analysis report includes information on upcoming trends and challenges that will influence market growth. This is to help companies strategize and leverage all forthcoming growth opportunities.
The study was conducted using an objective combination of primary and secondary information including inputs from key participants in the industry. The report contains a comprehensive market and vendor landscape in addition to an analysis of the key vendors.
The publisher presents a detailed picture of the market by the way of study, synthesis, and summation of data from multiple sources by an analysis of key parameters such as profit, pricing, competition, and promotions. It presents various market facets by identifying the key industry influencers. The data presented is comprehensive, reliable, and a result of extensive primary and secondary research. The market research reports provide a complete competitive landscape and an in-depth vendor selection methodology and analysis using qualitative and quantitative research to forecast accurate market growth.
Table of Contents
1 Executive Summary
- 1.1 Market overview
- Executive Summary - Chart on Market Overview
- Executive Summary - Data Table on Market Overview
- Executive Summary - Chart on Global Market Characteristics
- Executive Summary - Chart on Market By Geographical Landscape
- Executive Summary - Chart on Market Segmentation by Component
- Executive Summary - Chart on Market Segmentation by Technology
- Executive Summary - Chart on Incremental Growth
- Executive Summary - Data Table on Incremental Growth
- Executive Summary - Chart on Company Market Positioning
2 Technavio Analysis
- 2.1 Analysis of price sensitivity, lifecycle, customer purchase basket, adoption rates, and purchase criteria
- Analysis of price sensitivity, lifecycle, customer purchase basket, adoption rates, and purchase criteria
- 2.2 Criticality of inputs and Factors of differentiation
- Overview on criticality of inputs and factors of differentiation
- 2.3 Factors of disruption
- Overview on factors of disruption
- 2.4 Impact of drivers and challenges
- Impact of drivers and challenges in 2023 and 2028
3 Market Landscape
- 3.1 Market ecosystem
- Parent Market
- Data Table on - Parent Market
- 3.2 Market characteristics
- Market characteristics analysis
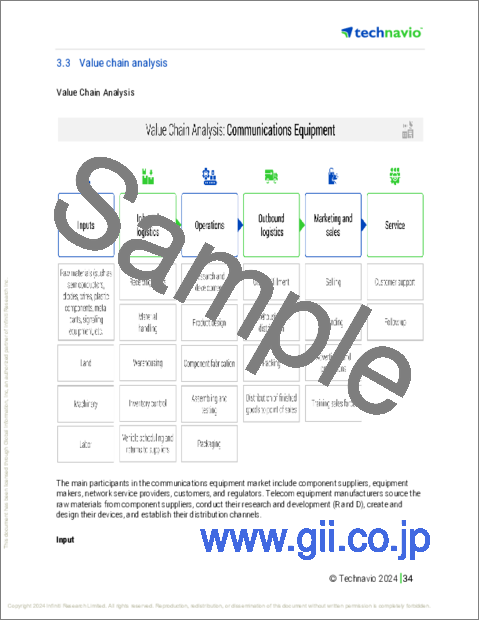
- 3.3 Value chain analysis
- Value Chain Analysis
4 Market Sizing
- 4.1 Market definition
- Offerings of companies included in the market definition
- 4.2 Market segment analysis
- Market segments
- 4.3 Market size 2023
- 4.4 Market outlook: Forecast for 2023-2028
- Chart on Global - Market size and forecast 2023-2028 ($ million)
- Data Table on Global - Market size and forecast 2023-2028 ($ million)
- Chart on Global Market: Year-over-year growth 2023-2028 (%)
- Data Table on Global Market: Year-over-year growth 2023-2028 (%)
5 Historic Market Size
- 5.1 Global UWB Anchor And Tags Market 2018 - 2022
- Historic Market Size - Data Table on Global UWB Anchor And Tags Market 2018 - 2022 ($ million)
- 5.2 Component segment analysis 2018 - 2022
- Historic Market Size - Component Segment 2018 - 2022 ($ million)
- 5.3 Technology segment analysis 2018 - 2022
- Historic Market Size - Technology Segment 2018 - 2022 ($ million)
- 5.4 Geography segment analysis 2018 - 2022
- Historic Market Size - Geography Segment 2018 - 2022 ($ million)
- 5.5 Country segment analysis 2018 - 2022
- Historic Market Size - Country Segment 2018 - 2022 ($ million)
6 Qualitative Analysis
- 6.1 Impact of AI on the Global UWB Anchor and Tags Market
7 Five Forces Analysis
- 7.1 Five forces summary
- Five forces analysis - Comparison between 2023 and 2028
- 7.2 Bargaining power of buyers
- Bargaining power of buyers - Impact of key factors 2023 and 2028
- 7.3 Bargaining power of suppliers
- Bargaining power of suppliers - Impact of key factors in 2023 and 2028
- 7.4 Threat of new entrants
- Threat of new entrants - Impact of key factors in 2023 and 2028
- 7.5 Threat of substitutes
- Threat of substitutes - Impact of key factors in 2023 and 2028
- 7.6 Threat of rivalry
- Threat of rivalry - Impact of key factors in 2023 and 2028
- 7.7 Market condition
- Chart on Market condition - Five forces 2023 and 2028
8 Market Segmentation by Component
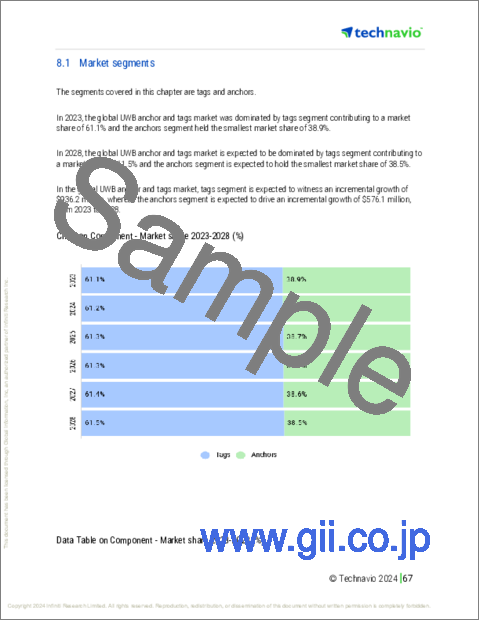
- 8.1 Market segments
- Chart on Component - Market share 2023-2028 (%)
- Data Table on Component - Market share 2023-2028 (%)
- 8.2 Comparison by Component
- Chart on Comparison by Component
- Data Table on Comparison by Component
- 8.3 Tags - Market size and forecast 2023-2028
- Chart on Tags - Market size and forecast 2023-2028 ($ million)
- Data Table on Tags - Market size and forecast 2023-2028 ($ million)
- Chart on Tags - Year-over-year growth 2023-2028 (%)
- Data Table on Tags - Year-over-year growth 2023-2028 (%)
- 8.4 Anchors - Market size and forecast 2023-2028
- Chart on Anchors - Market size and forecast 2023-2028 ($ million)
- Data Table on Anchors - Market size and forecast 2023-2028 ($ million)
- Chart on Anchors - Year-over-year growth 2023-2028 (%)
- Data Table on Anchors - Year-over-year growth 2023-2028 (%)
- 8.5 Market opportunity by Component
- Market opportunity by Component ($ million)
- Data Table on Market opportunity by Component ($ million)
9 Market Segmentation by Technology
- 9.1 Market segments
- Chart on Technology - Market share 2023-2028 (%)
- Data Table on Technology - Market share 2023-2028 (%)
- 9.2 Comparison by Technology
- Chart on Comparison by Technology
- Data Table on Comparison by Technology
- 9.3 Indoor positioning - Market size and forecast 2023-2028
- Chart on Indoor positioning - Market size and forecast 2023-2028 ($ million)
- Data Table on Indoor positioning - Market size and forecast 2023-2028 ($ million)
- Chart on Indoor positioning - Year-over-year growth 2023-2028 (%)
- Data Table on Indoor positioning - Year-over-year growth 2023-2028 (%)
- 9.4 Outdoor positioning - Market size and forecast 2023-2028
- Chart on Outdoor positioning - Market size and forecast 2023-2028 ($ million)
- Data Table on Outdoor positioning - Market size and forecast 2023-2028 ($ million)
- Chart on Outdoor positioning - Year-over-year growth 2023-2028 (%)
- Data Table on Outdoor positioning - Year-over-year growth 2023-2028 (%)
- 9.5 Market opportunity by Technology
- Market opportunity by Technology ($ million)
- Data Table on Market opportunity by Technology ($ million)
10 Customer Landscape
- 10.1 Customer landscape overview
- Analysis of price sensitivity, lifecycle, customer purchase basket, adoption rates, and purchase criteria
11 Geographic Landscape
- 11.1 Geographic segmentation
- Chart on Market share By Geographical Landscape 2023-2028 (%)
- Data Table on Market share By Geographical Landscape 2023-2028 (%)
- 11.2 Geographic comparison
- Chart on Geographic comparison
- Data Table on Geographic comparison
- 11.3 North America - Market size and forecast 2023-2028
- Chart on North America - Market size and forecast 2023-2028 ($ million)
- Data Table on North America - Market size and forecast 2023-2028 ($ million)
- Chart on North America - Year-over-year growth 2023-2028 (%)
- Data Table on North America - Year-over-year growth 2023-2028 (%)
- 11.4 Europe - Market size and forecast 2023-2028
- Chart on Europe - Market size and forecast 2023-2028 ($ million)
- Data Table on Europe - Market size and forecast 2023-2028 ($ million)
- Chart on Europe - Year-over-year growth 2023-2028 (%)
- Data Table on Europe - Year-over-year growth 2023-2028 (%)
- 11.5 APAC - Market size and forecast 2023-2028
- Chart on APAC - Market size and forecast 2023-2028 ($ million)
- Data Table on APAC - Market size and forecast 2023-2028 ($ million)
- Chart on APAC - Year-over-year growth 2023-2028 (%)
- Data Table on APAC - Year-over-year growth 2023-2028 (%)
- 11.6 South America - Market size and forecast 2023-2028
- Chart on South America - Market size and forecast 2023-2028 ($ million)
- Data Table on South America - Market size and forecast 2023-2028 ($ million)
- Chart on South America - Year-over-year growth 2023-2028 (%)
- Data Table on South America - Year-over-year growth 2023-2028 (%)
- 11.7 Middle East and Africa - Market size and forecast 2023-2028
- Chart on Middle East and Africa - Market size and forecast 2023-2028 ($ million)
- Data Table on Middle East and Africa - Market size and forecast 2023-2028 ($ million)
- Chart on Middle East and Africa - Year-over-year growth 2023-2028 (%)
- Data Table on Middle East and Africa - Year-over-year growth 2023-2028 (%)
- 11.8 US - Market size and forecast 2023-2028
- Chart on US - Market size and forecast 2023-2028 ($ million)
- Data Table on US - Market size and forecast 2023-2028 ($ million)
- Chart on US - Year-over-year growth 2023-2028 (%)
- Data Table on US - Year-over-year growth 2023-2028 (%)
- 11.9 Germany - Market size and forecast 2023-2028
- Chart on Germany - Market size and forecast 2023-2028 ($ million)
- Data Table on Germany - Market size and forecast 2023-2028 ($ million)
- Chart on Germany - Year-over-year growth 2023-2028 (%)
- Data Table on Germany - Year-over-year growth 2023-2028 (%)
- 11.10 UK - Market size and forecast 2023-2028
- Chart on UK - Market size and forecast 2023-2028 ($ million)
- Data Table on UK - Market size and forecast 2023-2028 ($ million)
- Chart on UK - Year-over-year growth 2023-2028 (%)
- Data Table on UK - Year-over-year growth 2023-2028 (%)
- 11.11 China - Market size and forecast 2023-2028
- Chart on China - Market size and forecast 2023-2028 ($ million)
- Data Table on China - Market size and forecast 2023-2028 ($ million)
- Chart on China - Year-over-year growth 2023-2028 (%)
- Data Table on China - Year-over-year growth 2023-2028 (%)
- 11.12 France - Market size and forecast 2023-2028
- Chart on France - Market size and forecast 2023-2028 ($ million)
- Data Table on France - Market size and forecast 2023-2028 ($ million)
- Chart on France - Year-over-year growth 2023-2028 (%)
- Data Table on France - Year-over-year growth 2023-2028 (%)
- 11.13 Japan - Market size and forecast 2023-2028
- Chart on Japan - Market size and forecast 2023-2028 ($ million)
- Data Table on Japan - Market size and forecast 2023-2028 ($ million)
- Chart on Japan - Year-over-year growth 2023-2028 (%)
- Data Table on Japan - Year-over-year growth 2023-2028 (%)
- 11.14 India - Market size and forecast 2023-2028
- Chart on India - Market size and forecast 2023-2028 ($ million)
- Data Table on India - Market size and forecast 2023-2028 ($ million)
- Chart on India - Year-over-year growth 2023-2028 (%)
- Data Table on India - Year-over-year growth 2023-2028 (%)
- 11.15 Canada - Market size and forecast 2023-2028
- Chart on Canada - Market size and forecast 2023-2028 ($ million)
- Data Table on Canada - Market size and forecast 2023-2028 ($ million)
- Chart on Canada - Year-over-year growth 2023-2028 (%)
- Data Table on Canada - Year-over-year growth 2023-2028 (%)
- 11.16 South Korea - Market size and forecast 2023-2028
- Chart on South Korea - Market size and forecast 2023-2028 ($ million)
- Data Table on South Korea - Market size and forecast 2023-2028 ($ million)
- Chart on South Korea - Year-over-year growth 2023-2028 (%)
- Data Table on South Korea - Year-over-year growth 2023-2028 (%)
- 11.17 Brazil - Market size and forecast 2023-2028
- Chart on Brazil - Market size and forecast 2023-2028 ($ million)
- Data Table on Brazil - Market size and forecast 2023-2028 ($ million)
- Chart on Brazil - Year-over-year growth 2023-2028 (%)
- Data Table on Brazil - Year-over-year growth 2023-2028 (%)
- 11.18 Market opportunity By Geographical Landscape
- Market opportunity By Geographical Landscape ($ million)
- Data Tables on Market opportunity By Geographical Landscape ($ million)
12 Drivers, Challenges, and Opportunity/Restraints
- 12.1 Market drivers
- 12.2 Market challenges
- 12.3 Impact of drivers and challenges
- Impact of drivers and challenges in 2023 and 2028
- 12.4 Market opportunities/restraints
13 Competitive Landscape
- 13.1 Overview
- 13.2 Competitive Landscape
- Overview on criticality of inputs and factors of differentiation
- 13.3 Landscape disruption
- Overview on factors of disruption
- 13.4 Industry risks
- Impact of key risks on business
14 Competitive Analysis
- 14.1 Companies profiled
- Companies covered
- 14.2 Company ranking index
- Company ranking index
- 14.3 Market positioning of companies
- Matrix on companies position and classification
- 14.4 ASSA ABLOY AB
- ASSA ABLOY AB - Overview
- ASSA ABLOY AB - Business segments
- ASSA ABLOY AB - Key news
- ASSA ABLOY AB - Key offerings
- ASSA ABLOY AB - Segment focus
- SWOT
- 14.5 BlueIOT Technology Co Ltd.
- BlueIOT Technology Co Ltd. - Overview
- BlueIOT Technology Co Ltd. - Product / Service
- BlueIOT Technology Co Ltd. - Key offerings
- SWOT
- 14.6 Estimote Inc.
- Estimote Inc. - Overview
- Estimote Inc. - Product / Service
- Estimote Inc. - Key offerings
- SWOT
- 14.7 Kinexon GmbH
- Kinexon GmbH - Overview
- Kinexon GmbH - Product / Service
- Kinexon GmbH - Key offerings
- SWOT
- 14.8 Murata Manufacturing Co. Ltd.
- Murata Manufacturing Co. Ltd. - Overview
- Murata Manufacturing Co. Ltd. - Business segments
- Murata Manufacturing Co. Ltd. - Key news
- Murata Manufacturing Co. Ltd. - Key offerings
- Murata Manufacturing Co. Ltd. - Segment focus
- SWOT
- 14.9 Nanotron Technologies GmbH
- Nanotron Technologies GmbH - Overview
- Nanotron Technologies GmbH - Product / Service
- Nanotron Technologies GmbH - Key offerings
- SWOT
- 14.10 NXP Semiconductors NV
- NXP Semiconductors NV - Overview
- NXP Semiconductors NV - Product / Service
- NXP Semiconductors NV - Key news
- NXP Semiconductors NV - Key offerings
- SWOT
- 14.11 Qorvo Inc.
- Qorvo Inc. - Overview
- Qorvo Inc. - Business segments
- Qorvo Inc. - Key news
- Qorvo Inc. - Key offerings
- Qorvo Inc. - Segment focus
- SWOT
- 14.12 Sewio Networks s r o
- Sewio Networks s r o - Overview
- Sewio Networks s r o - Product / Service
- Sewio Networks s r o - Key offerings
- SWOT
- 14.13 Shenzhen Skylab Co LTD
- Shenzhen Skylab Co LTD - Overview
- Shenzhen Skylab Co LTD - Product / Service
- Shenzhen Skylab Co LTD - Key offerings
- SWOT
- 14.14 STMicroelectronics International N.V.
- STMicroelectronics International N.V. - Overview
- STMicroelectronics International N.V. - Business segments
- STMicroelectronics International N.V. - Key news
- STMicroelectronics International N.V. - Key offerings
- STMicroelectronics International N.V. - Segment focus
- SWOT
- 14.15 Taoglas Group Holdings Ltd.
- Taoglas Group Holdings Ltd. - Overview
- Taoglas Group Holdings Ltd. - Product / Service
- Taoglas Group Holdings Ltd. - Key offerings
- SWOT
- 14.16 Ubisense Ltd.
- Ubisense Ltd. - Overview
- Ubisense Ltd. - Product / Service
- Ubisense Ltd. - Key offerings
- SWOT
- 14.17 Zebra Technologies Corp.
- Zebra Technologies Corp. - Overview
- Zebra Technologies Corp. - Business segments
- Zebra Technologies Corp. - Key news
- Zebra Technologies Corp. - Key offerings
- Zebra Technologies Corp. - Segment focus
- SWOT
- 14.18 ZIGPOS GmbH
- ZIGPOS GmbH - Overview
- ZIGPOS GmbH - Product / Service
- ZIGPOS GmbH - Key offerings
- SWOT
15 Appendix
- 15.1 Scope of the report
- 15.2 Inclusions and exclusions checklist
- Inclusions checklist
- Exclusions checklist
- 15.3 Currency conversion rates for US$
- Currency conversion rates for US$
- 15.4 Research methodology
- Research methodology
- 15.5 Data procurement
- Information sources
- 15.6 Data validation
- Data validation
- 15.7 Validation techniques employed for market sizing
- Validation techniques employed for market sizing
- 15.8 Data synthesis
- Data synthesis
- 15.9 360 degree market analysis
- 360 degree market analysis
- 15.10 List of abbreviations
- List of abbreviations

