|
|
市場調査レポート
商品コード
1581047
ガラス繊維リサイクルの世界市場 (2024~2028年)Global Fiberglass Recycling Market 2024-2028 |
||||||

|
|||||||
カスタマイズ可能
|
|||||||


| ガラス繊維リサイクルの世界市場 (2024~2028年) |
|
出版日: 2024年09月24日
発行: TechNavio
ページ情報: 英文 212 Pages
納期: 即納可能
|

全表示
- 概要
- 図表
- 目次
ガラス繊維リサイクル市場 (2024~2028年)
ガラス繊維リサイクル市場は2023年から2028年に5億4,320万米ドル分拡大し、予測期間中に6.4%のCAGRで成長すると予測されます。当レポートでは、ガラス繊維リサイクル市場の全体的な分析、市場規模・予測、動向、成長促進要因、課題、約25社のベンダーを網羅したベンダー分析などを掲載しています。
当レポートでは、現在の市場シナリオ、最新動向と促進要因、市場環境全体に関する最新分析を提供しています。この市場は、資源効率のための環境に優しい実践の重視、建設における持続可能な製品に対する需要の高まり、ガラス革新における再生ガラス繊維の用途の拡大によって牽引されています。
| 市場範囲 | |
|---|---|
| 基準年 | 2024年 |
| 終了年 | 2028年 |
| 予測期間 | 2024~2028年 |
| 成長モメンタム | 加速 |
| 前年比 (2024年) | 6.1% |
| CAGR | 6.4% |
| 増分額 | 5億4,320万米ドル |
当レポートでは、風力タービンからガラス繊維をリサイクルする方法が、今後数年間のガラス繊維リサイクル市場成長を促進する主な理由の1つであると特定しています。また、ガラス繊維リサイクル施設の成長とガラス繊維リサイクル技術の進歩は、市場の大きな需要につながります。
目次
第1章 エグゼクティブサマリー
- 市場概要
第2章 Technavioによる分析
- 価格感応度・ライフサイクル・顧客購入バスケット・採用率・購入基準の分析
- インプットの重要性と差別化の要因
- 混乱の要因
- 促進要因と課題の影響
第3章 市場情勢
- 市場エコシステム
- 市場の特徴
- バリューチェーン分析
第4章 市場規模の評価
- 市場の定義
- 市場セグメント分析
- 市場規模 (2023年)
- 市場の見通し (2023~2028年)
第5章 市場規模実績
- ガラス繊維リサイクルの世界市場 (2018~2022年)
- エンドユーザー別分析 (2018~2022年)
- 種類別分析 (2018~2022年)
- 地域別分析 (2018~2022年)
- 国別分析 (2018~2022年)
第6章 定性分析
- 世界のガラス繊維リサイクル市場におけるAIの影響
第7章 ファイブフォース分析
- ファイブフォースの要約
- 買い手の交渉力
- 供給企業の交渉力
- 新規参入業者の脅威
- 代替品の脅威
- 競争の脅威
- 市況
第8章 市場セグメンテーション:エンドユーザー別
- 市場セグメンテーション
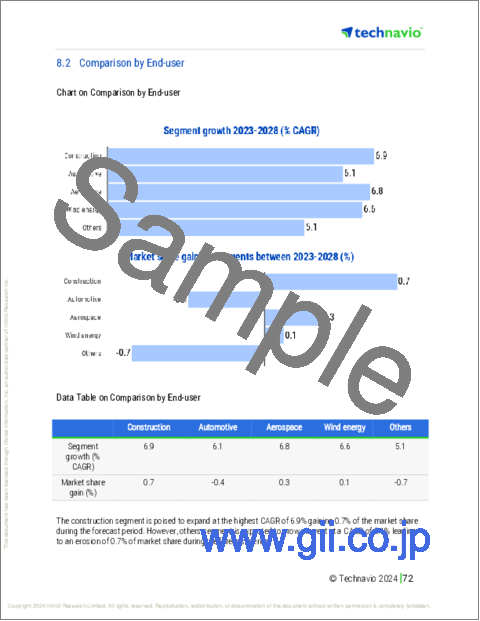
- 比較:エンドユーザー別
- 建設業:市場規模と予測 (2023~2028年)
- 自動車:市場規模と予測 (2023~2028年)
- 航空宇宙:市場規模と予測 (2023~2028年)
- 風力エネルギー:市場規模と予測 (2023~2028年)
- その他:市場規模と予測 (2023~2028年)
- エンドユーザー別の市場機会
第9章 市場セグメンテーション:種類別
- 市場セグメンテーション
- 比較:種類別
- 機械的リサイクル:市場規模と予測 (2023~2028年)
- サーマルリサイクル:市場規模と予測 (2023~2028年)
- 化学的リサイクル:市場規模と予測 (2023~2028年)
- 種類別の市場機会
第10章 顧客情勢
- 顧客情勢の概要
第11章 地域別情勢
- 地域別セグメンテーション
- 地域別比較
- アジア太平洋:市場規模と予測 (2023~2028年)
- 北米:市場規模と予測 (2023~2028年)
- 欧州:市場規模と予測 (2023~2028年)
- 南米:市場規模と予測 (2023~2028年)
- 中東・アフリカ:市場規模と予測 (2023~2028年)
- 米国:市場規模と予測 (2023~2028年)
- 中国:市場規模と予測 (2023~2028年)
- ドイツ:市場規模と予測 (2023~2028年)
- カナダ:市場規模と予測 (2023~2028年)
- 日本:市場規模と予測 (2023~2028年)
- 英国:市場規模と予測 (2023~2028年)
- フランス:市場規模と予測 (2023~2028年)
- スペイン:市場規模と予測 (2023~2028年)
- インド:市場規模と予測 (2023~2028年)
- ブラジル:市場規模と予測 (2023~2028年)
- 地域別の市場機会
第12章 促進要因・課題・機会・抑制要因
- 市場促進要因
- 市場の課題
- 促進要因と課題の影響
- 市場の機会・抑制要因
第13章 競合情勢
- 概要
- 競合情勢
- 混乱の状況
- 業界のリスク
第14章 競合分析
- 企業プロファイル
- 企業ランキング指数
- 企業の市場ポジショニング
- Adesso Advanced Materials
- Borealis AG
- Carbon Rivers Inc.
- Eco Wolf Inc.
- Gen 2 Carbon Ltd.
- General Kinematics Corp.
- Global Fiberglass Solutions Inc.
- Johns Manville Corp
- Owens Corning
- ReFiber ApS
- Sinoma Science and Technology Co. Ltd.
- Strategic Materials Inc.
- Toray Industries Inc.
- Veolia Environnement SA
- Vestas Wind Systems AS
第15章 付録
Exhibits:
- Exhibits1: Executive Summary - Chart on Market Overview
- Exhibits2: Executive Summary - Data Table on Market Overview
- Exhibits3: Executive Summary - Chart on Global Market Characteristics
- Exhibits4: Executive Summary - Chart on Market By Geographical Landscape
- Exhibits5: Executive Summary - Chart on Market Segmentation by End-user
- Exhibits6: Executive Summary - Chart on Market Segmentation by Type
- Exhibits7: Executive Summary - Chart on Incremental Growth
- Exhibits8: Executive Summary - Data Table on Incremental Growth
- Exhibits9: Executive Summary - Chart on Company Market Positioning
- Exhibits10: Analysis of price sensitivity, lifecycle, customer purchase basket, adoption rates, and purchase criteria
- Exhibits11: Overview on criticality of inputs and factors of differentiation
- Exhibits12: Overview on factors of disruption
- Exhibits13: Impact of drivers and challenges in 2023 and 2028
- Exhibits14: Parent Market
- Exhibits15: Data Table on - Parent Market
- Exhibits16: Market characteristics analysis
- Exhibits17: Value Chain Analysis
- Exhibits18: Offerings of companies included in the market definition
- Exhibits19: Market segments
- Exhibits20: Chart on Global - Market size and forecast 2023-2028 ($ million)
- Exhibits21: Data Table on Global - Market size and forecast 2023-2028 ($ million)
- Exhibits22: Chart on Global Market: Year-over-year growth 2023-2028 (%)
- Exhibits23: Data Table on Global Market: Year-over-year growth 2023-2028 (%)
- Exhibits24: Historic Market Size - Data Table on Global Fiberglass Recycling Market 2018 - 2022 ($ million)
- Exhibits25: Historic Market Size - End-user Segment 2018 - 2022 ($ million)
- Exhibits26: Historic Market Size - Type Segment 2018 - 2022 ($ million)
- Exhibits27: Historic Market Size - Geography Segment 2018 - 2022 ($ million)
- Exhibits28: Historic Market Size - Country Segment 2018 - 2022 ($ million)
- Exhibits29: Five forces analysis - Comparison between 2023 and 2028
- Exhibits30: Bargaining power of buyers - Impact of key factors 2023 and 2028
- Exhibits31: Bargaining power of suppliers - Impact of key factors in 2023 and 2028
- Exhibits32: Threat of new entrants - Impact of key factors in 2023 and 2028
- Exhibits33: Threat of substitutes - Impact of key factors in 2023 and 2028
- Exhibits34: Threat of rivalry - Impact of key factors in 2023 and 2028
- Exhibits35: Chart on Market condition - Five forces 2023 and 2028
- Exhibits36: Chart on End-user - Market share 2023-2028 (%)
- Exhibits37: Data Table on End-user - Market share 2023-2028 (%)
- Exhibits38: Chart on Comparison by End-user
- Exhibits39: Data Table on Comparison by End-user
- Exhibits40: Chart on Construction - Market size and forecast 2023-2028 ($ million)
- Exhibits41: Data Table on Construction - Market size and forecast 2023-2028 ($ million)
- Exhibits42: Chart on Construction - Year-over-year growth 2023-2028 (%)
- Exhibits43: Data Table on Construction - Year-over-year growth 2023-2028 (%)
- Exhibits44: Chart on Automotive - Market size and forecast 2023-2028 ($ million)
- Exhibits45: Data Table on Automotive - Market size and forecast 2023-2028 ($ million)
- Exhibits46: Chart on Automotive - Year-over-year growth 2023-2028 (%)
- Exhibits47: Data Table on Automotive - Year-over-year growth 2023-2028 (%)
- Exhibits48: Chart on Aerospace - Market size and forecast 2023-2028 ($ million)
- Exhibits49: Data Table on Aerospace - Market size and forecast 2023-2028 ($ million)
- Exhibits50: Chart on Aerospace - Year-over-year growth 2023-2028 (%)
- Exhibits51: Data Table on Aerospace - Year-over-year growth 2023-2028 (%)
- Exhibits52: Chart on Wind energy - Market size and forecast 2023-2028 ($ million)
- Exhibits53: Data Table on Wind energy - Market size and forecast 2023-2028 ($ million)
- Exhibits54: Chart on Wind energy - Year-over-year growth 2023-2028 (%)
- Exhibits55: Data Table on Wind energy - Year-over-year growth 2023-2028 (%)
- Exhibits56: Chart on Others - Market size and forecast 2023-2028 ($ million)
- Exhibits57: Data Table on Others - Market size and forecast 2023-2028 ($ million)
- Exhibits58: Chart on Others - Year-over-year growth 2023-2028 (%)
- Exhibits59: Data Table on Others - Year-over-year growth 2023-2028 (%)
- Exhibits60: Market opportunity by End-user ($ million)
- Exhibits61: Data Table on Market opportunity by End-user ($ million)
- Exhibits62: Chart on Type - Market share 2023-2028 (%)
- Exhibits63: Data Table on Type - Market share 2023-2028 (%)
- Exhibits64: Chart on Comparison by Type
- Exhibits65: Data Table on Comparison by Type
- Exhibits66: Chart on Mechanical recycling - Market size and forecast 2023-2028 ($ million)
- Exhibits67: Data Table on Mechanical recycling - Market size and forecast 2023-2028 ($ million)
- Exhibits68: Chart on Mechanical recycling - Year-over-year growth 2023-2028 (%)
- Exhibits69: Data Table on Mechanical recycling - Year-over-year growth 2023-2028 (%)
- Exhibits70: Chart on Thermal recycling - Market size and forecast 2023-2028 ($ million)
- Exhibits71: Data Table on Thermal recycling - Market size and forecast 2023-2028 ($ million)
- Exhibits72: Chart on Thermal recycling - Year-over-year growth 2023-2028 (%)
- Exhibits73: Data Table on Thermal recycling - Year-over-year growth 2023-2028 (%)
- Exhibits74: Chart on Chemical recycling - Market size and forecast 2023-2028 ($ million)
- Exhibits75: Data Table on Chemical recycling - Market size and forecast 2023-2028 ($ million)
- Exhibits76: Chart on Chemical recycling - Year-over-year growth 2023-2028 (%)
- Exhibits77: Data Table on Chemical recycling - Year-over-year growth 2023-2028 (%)
- Exhibits78: Market opportunity by Type ($ million)
- Exhibits79: Data Table on Market opportunity by Type ($ million)
- Exhibits80: Analysis of price sensitivity, lifecycle, customer purchase basket, adoption rates, and purchase criteria
- Exhibits81: Chart on Market share By Geographical Landscape 2023-2028 (%)
- Exhibits82: Data Table on Market share By Geographical Landscape 2023-2028 (%)
- Exhibits83: Chart on Geographic comparison
- Exhibits84: Data Table on Geographic comparison
- Exhibits85: Chart on APAC - Market size and forecast 2023-2028 ($ million)
- Exhibits86: Data Table on APAC - Market size and forecast 2023-2028 ($ million)
- Exhibits87: Chart on APAC - Year-over-year growth 2023-2028 (%)
- Exhibits88: Data Table on APAC - Year-over-year growth 2023-2028 (%)
- Exhibits89: Chart on North America - Market size and forecast 2023-2028 ($ million)
- Exhibits90: Data Table on North America - Market size and forecast 2023-2028 ($ million)
- Exhibits91: Chart on North America - Year-over-year growth 2023-2028 (%)
- Exhibits92: Data Table on North America - Year-over-year growth 2023-2028 (%)
- Exhibits93: Chart on Europe - Market size and forecast 2023-2028 ($ million)
- Exhibits94: Data Table on Europe - Market size and forecast 2023-2028 ($ million)
- Exhibits95: Chart on Europe - Year-over-year growth 2023-2028 (%)
- Exhibits96: Data Table on Europe - Year-over-year growth 2023-2028 (%)
- Exhibits97: Chart on South America - Market size and forecast 2023-2028 ($ million)
- Exhibits98: Data Table on South America - Market size and forecast 2023-2028 ($ million)
- Exhibits99: Chart on South America - Year-over-year growth 2023-2028 (%)
- Exhibits100: Data Table on South America - Year-over-year growth 2023-2028 (%)
- Exhibits101: Chart on Middle East and Africa - Market size and forecast 2023-2028 ($ million)
- Exhibits102: Data Table on Middle East and Africa - Market size and forecast 2023-2028 ($ million)
- Exhibits103: Chart on Middle East and Africa - Year-over-year growth 2023-2028 (%)
- Exhibits104: Data Table on Middle East and Africa - Year-over-year growth 2023-2028 (%)
- Exhibits105: Chart on US - Market size and forecast 2023-2028 ($ million)
- Exhibits106: Data Table on US - Market size and forecast 2023-2028 ($ million)
- Exhibits107: Chart on US - Year-over-year growth 2023-2028 (%)
- Exhibits108: Data Table on US - Year-over-year growth 2023-2028 (%)
- Exhibits109: Chart on China - Market size and forecast 2023-2028 ($ million)
- Exhibits110: Data Table on China - Market size and forecast 2023-2028 ($ million)
- Exhibits111: Chart on China - Year-over-year growth 2023-2028 (%)
- Exhibits112: Data Table on China - Year-over-year growth 2023-2028 (%)
- Exhibits113: Chart on Germany - Market size and forecast 2023-2028 ($ million)
- Exhibits114: Data Table on Germany - Market size and forecast 2023-2028 ($ million)
- Exhibits115: Chart on Germany - Year-over-year growth 2023-2028 (%)
- Exhibits116: Data Table on Germany - Year-over-year growth 2023-2028 (%)
- Exhibits117: Chart on Canada - Market size and forecast 2023-2028 ($ million)
- Exhibits118: Data Table on Canada - Market size and forecast 2023-2028 ($ million)
- Exhibits119: Chart on Canada - Year-over-year growth 2023-2028 (%)
- Exhibits120: Data Table on Canada - Year-over-year growth 2023-2028 (%)
- Exhibits121: Chart on Japan - Market size and forecast 2023-2028 ($ million)
- Exhibits122: Data Table on Japan - Market size and forecast 2023-2028 ($ million)
- Exhibits123: Chart on Japan - Year-over-year growth 2023-2028 (%)
- Exhibits124: Data Table on Japan - Year-over-year growth 2023-2028 (%)
- Exhibits125: Chart on UK - Market size and forecast 2023-2028 ($ million)
- Exhibits126: Data Table on UK - Market size and forecast 2023-2028 ($ million)
- Exhibits127: Chart on UK - Year-over-year growth 2023-2028 (%)
- Exhibits128: Data Table on UK - Year-over-year growth 2023-2028 (%)
- Exhibits129: Chart on France - Market size and forecast 2023-2028 ($ million)
- Exhibits130: Data Table on France - Market size and forecast 2023-2028 ($ million)
- Exhibits131: Chart on France - Year-over-year growth 2023-2028 (%)
- Exhibits132: Data Table on France - Year-over-year growth 2023-2028 (%)
- Exhibits133: Chart on Spain - Market size and forecast 2023-2028 ($ million)
- Exhibits134: Data Table on Spain - Market size and forecast 2023-2028 ($ million)
- Exhibits135: Chart on Spain - Year-over-year growth 2023-2028 (%)
- Exhibits136: Data Table on Spain - Year-over-year growth 2023-2028 (%)
- Exhibits137: Chart on India - Market size and forecast 2023-2028 ($ million)
- Exhibits138: Data Table on India - Market size and forecast 2023-2028 ($ million)
- Exhibits139: Chart on India - Year-over-year growth 2023-2028 (%)
- Exhibits140: Data Table on India - Year-over-year growth 2023-2028 (%)
- Exhibits141: Chart on Brazil - Market size and forecast 2023-2028 ($ million)
- Exhibits142: Data Table on Brazil - Market size and forecast 2023-2028 ($ million)
- Exhibits143: Chart on Brazil - Year-over-year growth 2023-2028 (%)
- Exhibits144: Data Table on Brazil - Year-over-year growth 2023-2028 (%)
- Exhibits145: Market opportunity By Geographical Landscape ($ million)
- Exhibits146: Data Tables on Market opportunity By Geographical Landscape ($ million)
- Exhibits147: Impact of drivers and challenges in 2023 and 2028
- Exhibits148: Overview on criticality of inputs and factors of differentiation
- Exhibits149: Overview on factors of disruption
- Exhibits150: Impact of key risks on business
- Exhibits151: Companies covered
- Exhibits152: Company ranking index
- Exhibits153: Matrix on companies position and classification
- Exhibits154: Adesso Advanced Materials - Overview
- Exhibits155: Adesso Advanced Materials - Product / Service
- Exhibits156: Adesso Advanced Materials - Key offerings
- Exhibits157: SWOT
- Exhibits158: Borealis AG - Overview
- Exhibits159: Borealis AG - Business segments
- Exhibits160: Borealis AG - Key offerings
- Exhibits161: Borealis AG - Segment focus
- Exhibits162: SWOT
- Exhibits163: Carbon Rivers Inc. - Overview
- Exhibits164: Carbon Rivers Inc. - Product / Service
- Exhibits165: Carbon Rivers Inc. - Key offerings
- Exhibits166: SWOT
- Exhibits167: Eco Wolf Inc. - Overview
- Exhibits168: Eco Wolf Inc. - Product / Service
- Exhibits169: Eco Wolf Inc. - Key offerings
- Exhibits170: SWOT
- Exhibits171: Gen 2 Carbon Ltd. - Overview
- Exhibits172: Gen 2 Carbon Ltd. - Product / Service
- Exhibits173: Gen 2 Carbon Ltd. - Key offerings
- Exhibits174: SWOT
- Exhibits175: General Kinematics Corp. - Overview
- Exhibits176: General Kinematics Corp. - Product / Service
- Exhibits177: General Kinematics Corp. - Key offerings
- Exhibits178: SWOT
- Exhibits179: Global Fiberglass Solutions Inc. - Overview
- Exhibits180: Global Fiberglass Solutions Inc. - Product / Service
- Exhibits181: Global Fiberglass Solutions Inc. - Key offerings
- Exhibits182: SWOT
- Exhibits183: Johns Manville Corp - Overview
- Exhibits184: Johns Manville Corp - Product / Service
- Exhibits185: Johns Manville Corp - Key offerings
- Exhibits186: SWOT
- Exhibits187: Owens Corning - Overview
- Exhibits188: Owens Corning - Business segments
- Exhibits189: Owens Corning - Key news
- Exhibits190: Owens Corning - Key offerings
- Exhibits191: Owens Corning - Segment focus
- Exhibits192: SWOT
- Exhibits193: ReFiber ApS - Overview
- Exhibits194: ReFiber ApS - Product / Service
- Exhibits195: ReFiber ApS - Key offerings
- Exhibits196: SWOT
- Exhibits197: Sinoma Science and Technology Co. Ltd. - Overview
- Exhibits198: Sinoma Science and Technology Co. Ltd. - Product / Service
- Exhibits199: Sinoma Science and Technology Co. Ltd. - Key offerings
- Exhibits200: SWOT
- Exhibits201: Strategic Materials Inc. - Overview
- Exhibits202: Strategic Materials Inc. - Product / Service
- Exhibits203: Strategic Materials Inc. - Key offerings
- Exhibits204: SWOT
- Exhibits205: Toray Industries Inc. - Overview
- Exhibits206: Toray Industries Inc. - Business segments
- Exhibits207: Toray Industries Inc. - Key news
- Exhibits208: Toray Industries Inc. - Key offerings
- Exhibits209: Toray Industries Inc. - Segment focus
- Exhibits210: SWOT
- Exhibits211: Veolia Environnement SA - Overview
- Exhibits212: Veolia Environnement SA - Business segments
- Exhibits213: Veolia Environnement SA - Key news
- Exhibits214: Veolia Environnement SA - Key offerings
- Exhibits215: Veolia Environnement SA - Segment focus
- Exhibits216: SWOT
- Exhibits217: Vestas Wind Systems AS - Overview
- Exhibits218: Vestas Wind Systems AS - Business segments
- Exhibits219: Vestas Wind Systems AS - Key offerings
- Exhibits220: Vestas Wind Systems AS - Segment focus
- Exhibits221: SWOT
- Exhibits222: Inclusions checklist
- Exhibits223: Exclusions checklist
- Exhibits224: Currency conversion rates for US$
- Exhibits225: Research methodology
- Exhibits226: Information sources
- Exhibits227: Data validation
- Exhibits228: Validation techniques employed for market sizing
- Exhibits229: Data synthesis
- Exhibits230: 360 degree market analysis
- Exhibits231: List of abbreviations
Fiberglass Recycling Market 2024-2028
The fiberglass recycling market is forecasted to grow by USD 543.2 mn during 2023-2028, accelerating at a CAGR of 6.4% during the forecast period. The report on the fiberglass recycling market provides a holistic analysis, market size and forecast, trends, growth drivers, and challenges, as well as vendor analysis covering around 25 vendors.
The report offers an up-to-date analysis regarding the current market scenario, the latest trends and drivers, and the overall market environment. The market is driven by emphasis on eco-friendly practices for resource efficiency, rising demand for sustainable products in construction, and augmenting uses of recycled fiberglass in glass innovations.
| Market Scope | |
|---|---|
| Base Year | 2024 |
| End Year | 2028 |
| Series Year | 2024-2028 |
| Growth Momentum | Accelerate |
| YOY 2024 | 6.1% |
| CAGR | 6.4% |
| Incremental Value | $543.2 mn |
Technavio's fiberglass recycling market is segmented as below:
By End-user
- Construction
- Automotive
- Aerospace
- Wind energy
- Others
By Type
- Mechanical recycling
- Thermal recycling
- Chemical recycling
By Geographical Landscape
- APAC
- North America
- Europe
- South America
- Middle East and Africa
This study identifies the methods for recycling fiberglass from wind turbines as one of the prime reasons driving the fiberglass recycling market growth during the next few years. Also, growth in fiberglass recycling facilities and advancements in fiberglass recycling techniques will lead to sizable demand in the market.
The report on the fiberglass recycling market covers the following areas:
- Fiberglass Recycling Market sizing
- Fiberglass Recycling Market forecast
- Fiberglass Recycling Market industry analysis
The robust vendor analysis is designed to help clients improve their market position, and in line with this, this report provides a detailed analysis of several leading fiberglass recycling market vendors that include Adesso Advanced Materials, Borealis AG, Carbon Rivers Inc., Eco Wolf Inc., European Metal Recycling Ltd., Gen 2 Carbon Ltd., General Kinematics Corp., Global Fiberglass Solutions Inc., Johns Manville Corp, Neowa GmbH, Owens Corning, ReFiber ApS, Sinoma Science and Technology Co. Ltd., Strategic Materials Inc., Toray Industries Inc., Veolia Environnement SA, Vestas Wind Systems AS, and WindEurope VZW ASBL. Also, the fiberglass recycling market analysis report includes information on upcoming trends and challenges that will influence market growth. This is to help companies strategize and leverage all forthcoming growth opportunities.
The study was conducted using an objective combination of primary and secondary information including inputs from key participants in the industry. The report contains a comprehensive market and vendor landscape in addition to an analysis of the key vendors.
The publisher presents a detailed picture of the market by the way of study, synthesis, and summation of data from multiple sources by an analysis of key parameters such as profit, pricing, competition, and promotions. It presents various market facets by identifying the key industry influencers. The data presented is comprehensive, reliable, and a result of extensive primary and secondary research. The market research reports provide a complete competitive landscape and an in-depth vendor selection methodology and analysis using qualitative and quantitative research to forecast accurate market growth.
Table of Contents
1 Executive Summary
- 1.1 Market overview
- Executive Summary - Chart on Market Overview
- Executive Summary - Data Table on Market Overview
- Executive Summary - Chart on Global Market Characteristics
- Executive Summary - Chart on Market By Geographical Landscape
- Executive Summary - Chart on Market Segmentation by End-user
- Executive Summary - Chart on Market Segmentation by Type
- Executive Summary - Chart on Incremental Growth
- Executive Summary - Data Table on Incremental Growth
- Executive Summary - Chart on Company Market Positioning
2 Technavio Analysis
- 2.1 Analysis of price sensitivity, lifecycle, customer purchase basket, adoption rates, and purchase criteria
- Analysis of price sensitivity, lifecycle, customer purchase basket, adoption rates, and purchase criteria
- 2.2 Criticality of inputs and Factors of differentiation
- Overview on criticality of inputs and factors of differentiation
- 2.3 Factors of disruption
- Overview on factors of disruption
- 2.4 Impact of drivers and challenges
- Impact of drivers and challenges in 2023 and 2028
3 Market Landscape
- 3.1 Market ecosystem
- Parent Market
- Data Table on - Parent Market
- 3.2 Market characteristics
- Market characteristics analysis
- 3.3 Value chain analysis
- Value Chain Analysis
4 Market Sizing
- 4.1 Market definition
- Offerings of companies included in the market definition
- 4.2 Market segment analysis
- Market segments
- 4.3 Market size 2023
- 4.4 Market outlook: Forecast for 2023-2028
- Chart on Global - Market size and forecast 2023-2028 ($ million)
- Data Table on Global - Market size and forecast 2023-2028 ($ million)
- Chart on Global Market: Year-over-year growth 2023-2028 (%)
- Data Table on Global Market: Year-over-year growth 2023-2028 (%)
5 Historic Market Size
- 5.1 Global Fiberglass Recycling Market 2018 - 2022
- Historic Market Size - Data Table on Global Fiberglass Recycling Market 2018 - 2022 ($ million)
- 5.2 End-user segment analysis 2018 - 2022
- Historic Market Size - End-user Segment 2018 - 2022 ($ million)
- 5.3 Type segment analysis 2018 - 2022
- Historic Market Size - Type Segment 2018 - 2022 ($ million)
- 5.4 Geography segment analysis 2018 - 2022
- Historic Market Size - Geography Segment 2018 - 2022 ($ million)
- 5.5 Country segment analysis 2018 - 2022
- Historic Market Size - Country Segment 2018 - 2022 ($ million)
6 Qualitative Analysis
- 6.1 Impact of AI in the Global Fiberglass Recycling Market
7 Five Forces Analysis
- 7.1 Five forces summary
- Five forces analysis - Comparison between 2023 and 2028
- 7.2 Bargaining power of buyers
- Bargaining power of buyers - Impact of key factors 2023 and 2028
- 7.3 Bargaining power of suppliers
- Bargaining power of suppliers - Impact of key factors in 2023 and 2028
- 7.4 Threat of new entrants
- Threat of new entrants - Impact of key factors in 2023 and 2028
- 7.5 Threat of substitutes
- Threat of substitutes - Impact of key factors in 2023 and 2028
- 7.6 Threat of rivalry
- Threat of rivalry - Impact of key factors in 2023 and 2028
- 7.7 Market condition
- Chart on Market condition - Five forces 2023 and 2028
8 Market Segmentation by End-user
- 8.1 Market segments
- Chart on End-user - Market share 2023-2028 (%)
- Data Table on End-user - Market share 2023-2028 (%)
- 8.2 Comparison by End-user
- Chart on Comparison by End-user
- Data Table on Comparison by End-user
- 8.3 Construction - Market size and forecast 2023-2028
- Chart on Construction - Market size and forecast 2023-2028 ($ million)
- Data Table on Construction - Market size and forecast 2023-2028 ($ million)
- Chart on Construction - Year-over-year growth 2023-2028 (%)
- Data Table on Construction - Year-over-year growth 2023-2028 (%)
- 8.4 Automotive - Market size and forecast 2023-2028
- Chart on Automotive - Market size and forecast 2023-2028 ($ million)
- Data Table on Automotive - Market size and forecast 2023-2028 ($ million)
- Chart on Automotive - Year-over-year growth 2023-2028 (%)
- Data Table on Automotive - Year-over-year growth 2023-2028 (%)
- 8.5 Aerospace - Market size and forecast 2023-2028
- Chart on Aerospace - Market size and forecast 2023-2028 ($ million)
- Data Table on Aerospace - Market size and forecast 2023-2028 ($ million)
- Chart on Aerospace - Year-over-year growth 2023-2028 (%)
- Data Table on Aerospace - Year-over-year growth 2023-2028 (%)
- 8.6 Wind energy - Market size and forecast 2023-2028
- Chart on Wind energy - Market size and forecast 2023-2028 ($ million)
- Data Table on Wind energy - Market size and forecast 2023-2028 ($ million)
- Chart on Wind energy - Year-over-year growth 2023-2028 (%)
- Data Table on Wind energy - Year-over-year growth 2023-2028 (%)
- 8.7 Others - Market size and forecast 2023-2028
- Chart on Others - Market size and forecast 2023-2028 ($ million)
- Data Table on Others - Market size and forecast 2023-2028 ($ million)
- Chart on Others - Year-over-year growth 2023-2028 (%)
- Data Table on Others - Year-over-year growth 2023-2028 (%)
- 8.8 Market opportunity by End-user
- Market opportunity by End-user ($ million)
- Data Table on Market opportunity by End-user ($ million)
9 Market Segmentation by Type
- 9.1 Market segments
- Chart on Type - Market share 2023-2028 (%)
- Data Table on Type - Market share 2023-2028 (%)
- 9.2 Comparison by Type
- Chart on Comparison by Type
- Data Table on Comparison by Type
- 9.3 Mechanical recycling - Market size and forecast 2023-2028
- Chart on Mechanical recycling - Market size and forecast 2023-2028 ($ million)
- Data Table on Mechanical recycling - Market size and forecast 2023-2028 ($ million)
- Chart on Mechanical recycling - Year-over-year growth 2023-2028 (%)
- Data Table on Mechanical recycling - Year-over-year growth 2023-2028 (%)
- 9.4 Thermal recycling - Market size and forecast 2023-2028
- Chart on Thermal recycling - Market size and forecast 2023-2028 ($ million)
- Data Table on Thermal recycling - Market size and forecast 2023-2028 ($ million)
- Chart on Thermal recycling - Year-over-year growth 2023-2028 (%)
- Data Table on Thermal recycling - Year-over-year growth 2023-2028 (%)
- 9.5 Chemical recycling - Market size and forecast 2023-2028
- Chart on Chemical recycling - Market size and forecast 2023-2028 ($ million)
- Data Table on Chemical recycling - Market size and forecast 2023-2028 ($ million)
- Chart on Chemical recycling - Year-over-year growth 2023-2028 (%)
- Data Table on Chemical recycling - Year-over-year growth 2023-2028 (%)
- 9.6 Market opportunity by Type
- Market opportunity by Type ($ million)
- Data Table on Market opportunity by Type ($ million)
10 Customer Landscape
- 10.1 Customer landscape overview
- Analysis of price sensitivity, lifecycle, customer purchase basket, adoption rates, and purchase criteria
11 Geographic Landscape
- 11.1 Geographic segmentation
- Chart on Market share By Geographical Landscape 2023-2028 (%)
- Data Table on Market share By Geographical Landscape 2023-2028 (%)
- 11.2 Geographic comparison
- Chart on Geographic comparison
- Data Table on Geographic comparison
- 11.3 APAC - Market size and forecast 2023-2028
- Chart on APAC - Market size and forecast 2023-2028 ($ million)
- Data Table on APAC - Market size and forecast 2023-2028 ($ million)
- Chart on APAC - Year-over-year growth 2023-2028 (%)
- Data Table on APAC - Year-over-year growth 2023-2028 (%)
- 11.4 North America - Market size and forecast 2023-2028
- Chart on North America - Market size and forecast 2023-2028 ($ million)
- Data Table on North America - Market size and forecast 2023-2028 ($ million)
- Chart on North America - Year-over-year growth 2023-2028 (%)
- Data Table on North America - Year-over-year growth 2023-2028 (%)
- 11.5 Europe - Market size and forecast 2023-2028
- Chart on Europe - Market size and forecast 2023-2028 ($ million)
- Data Table on Europe - Market size and forecast 2023-2028 ($ million)
- Chart on Europe - Year-over-year growth 2023-2028 (%)
- Data Table on Europe - Year-over-year growth 2023-2028 (%)
- 11.6 South America - Market size and forecast 2023-2028
- Chart on South America - Market size and forecast 2023-2028 ($ million)
- Data Table on South America - Market size and forecast 2023-2028 ($ million)
- Chart on South America - Year-over-year growth 2023-2028 (%)
- Data Table on South America - Year-over-year growth 2023-2028 (%)
- 11.7 Middle East and Africa - Market size and forecast 2023-2028
- Chart on Middle East and Africa - Market size and forecast 2023-2028 ($ million)
- Data Table on Middle East and Africa - Market size and forecast 2023-2028 ($ million)
- Chart on Middle East and Africa - Year-over-year growth 2023-2028 (%)
- Data Table on Middle East and Africa - Year-over-year growth 2023-2028 (%)
- 11.8 US - Market size and forecast 2023-2028
- Chart on US - Market size and forecast 2023-2028 ($ million)
- Data Table on US - Market size and forecast 2023-2028 ($ million)
- Chart on US - Year-over-year growth 2023-2028 (%)
- Data Table on US - Year-over-year growth 2023-2028 (%)
- 11.9 China - Market size and forecast 2023-2028
- Chart on China - Market size and forecast 2023-2028 ($ million)
- Data Table on China - Market size and forecast 2023-2028 ($ million)
- Chart on China - Year-over-year growth 2023-2028 (%)
- Data Table on China - Year-over-year growth 2023-2028 (%)
- 11.10 Germany - Market size and forecast 2023-2028
- Chart on Germany - Market size and forecast 2023-2028 ($ million)
- Data Table on Germany - Market size and forecast 2023-2028 ($ million)
- Chart on Germany - Year-over-year growth 2023-2028 (%)
- Data Table on Germany - Year-over-year growth 2023-2028 (%)
- 11.11 Canada - Market size and forecast 2023-2028
- Chart on Canada - Market size and forecast 2023-2028 ($ million)
- Data Table on Canada - Market size and forecast 2023-2028 ($ million)
- Chart on Canada - Year-over-year growth 2023-2028 (%)
- Data Table on Canada - Year-over-year growth 2023-2028 (%)
- 11.12 Japan - Market size and forecast 2023-2028
- Chart on Japan - Market size and forecast 2023-2028 ($ million)
- Data Table on Japan - Market size and forecast 2023-2028 ($ million)
- Chart on Japan - Year-over-year growth 2023-2028 (%)
- Data Table on Japan - Year-over-year growth 2023-2028 (%)
- 11.13 UK - Market size and forecast 2023-2028
- Chart on UK - Market size and forecast 2023-2028 ($ million)
- Data Table on UK - Market size and forecast 2023-2028 ($ million)
- Chart on UK - Year-over-year growth 2023-2028 (%)
- Data Table on UK - Year-over-year growth 2023-2028 (%)
- 11.14 France - Market size and forecast 2023-2028
- Chart on France - Market size and forecast 2023-2028 ($ million)
- Data Table on France - Market size and forecast 2023-2028 ($ million)
- Chart on France - Year-over-year growth 2023-2028 (%)
- Data Table on France - Year-over-year growth 2023-2028 (%)
- 11.15 Spain - Market size and forecast 2023-2028
- Chart on Spain - Market size and forecast 2023-2028 ($ million)
- Data Table on Spain - Market size and forecast 2023-2028 ($ million)
- Chart on Spain - Year-over-year growth 2023-2028 (%)
- Data Table on Spain - Year-over-year growth 2023-2028 (%)
- 11.16 India - Market size and forecast 2023-2028
- Chart on India - Market size and forecast 2023-2028 ($ million)
- Data Table on India - Market size and forecast 2023-2028 ($ million)
- Chart on India - Year-over-year growth 2023-2028 (%)
- Data Table on India - Year-over-year growth 2023-2028 (%)
- 11.17 Brazil - Market size and forecast 2023-2028
- Chart on Brazil - Market size and forecast 2023-2028 ($ million)
- Data Table on Brazil - Market size and forecast 2023-2028 ($ million)
- Chart on Brazil - Year-over-year growth 2023-2028 (%)
- Data Table on Brazil - Year-over-year growth 2023-2028 (%)
- 11.18 Market opportunity By Geographical Landscape
- Market opportunity By Geographical Landscape ($ million)
- Data Tables on Market opportunity By Geographical Landscape ($ million)
12 Drivers, Challenges, and Opportunity/Restraints
- 12.1 Market drivers
- 12.2 Market challenges
- 12.3 Impact of drivers and challenges
- Impact of drivers and challenges in 2023 and 2028
- 12.4 Market opportunities/restraints
13 Competitive Landscape
- 13.1 Overview
- 13.2 Competitive Landscape
- Overview on criticality of inputs and factors of differentiation
- 13.3 Landscape disruption
- Overview on factors of disruption
- 13.4 Industry risks
- Impact of key risks on business
14 Competitive Analysis
- 14.1 Companies profiled
- Companies covered
- 14.2 Company ranking index
- Company ranking index
- 14.3 Market positioning of companies
- Matrix on companies position and classification
- 14.4 Adesso Advanced Materials
- Adesso Advanced Materials - Overview
- Adesso Advanced Materials - Product / Service
- Adesso Advanced Materials - Key offerings
- SWOT
- 14.5 Borealis AG
- Borealis AG - Overview
- Borealis AG - Business segments
- Borealis AG - Key offerings
- Borealis AG - Segment focus
- SWOT
- 14.6 Carbon Rivers Inc.
- Carbon Rivers Inc. - Overview
- Carbon Rivers Inc. - Product / Service
- Carbon Rivers Inc. - Key offerings
- SWOT
- 14.7 Eco Wolf Inc.
- Eco Wolf Inc. - Overview
- Eco Wolf Inc. - Product / Service
- Eco Wolf Inc. - Key offerings
- SWOT
- 14.8 Gen 2 Carbon Ltd.
- Gen 2 Carbon Ltd. - Overview
- Gen 2 Carbon Ltd. - Product / Service
- Gen 2 Carbon Ltd. - Key offerings
- SWOT
- 14.9 General Kinematics Corp.
- General Kinematics Corp. - Overview
- General Kinematics Corp. - Product / Service
- General Kinematics Corp. - Key offerings
- SWOT
- 14.10 Global Fiberglass Solutions Inc.
- Global Fiberglass Solutions Inc. - Overview
- Global Fiberglass Solutions Inc. - Product / Service
- Global Fiberglass Solutions Inc. - Key offerings
- SWOT
- 14.11 Johns Manville Corp
- Johns Manville Corp - Overview
- Johns Manville Corp - Product / Service
- Johns Manville Corp - Key offerings
- SWOT
- 14.12 Owens Corning
- Owens Corning - Overview
- Owens Corning - Business segments
- Owens Corning - Key news
- Owens Corning - Key offerings
- Owens Corning - Segment focus
- SWOT
- 14.13 ReFiber ApS
- ReFiber ApS - Overview
- ReFiber ApS - Product / Service
- ReFiber ApS - Key offerings
- SWOT
- 14.14 Sinoma Science and Technology Co. Ltd.
- Sinoma Science and Technology Co. Ltd. - Overview
- Sinoma Science and Technology Co. Ltd. - Product / Service
- Sinoma Science and Technology Co. Ltd. - Key offerings
- SWOT
- 14.15 Strategic Materials Inc.
- Strategic Materials Inc. - Overview
- Strategic Materials Inc. - Product / Service
- Strategic Materials Inc. - Key offerings
- SWOT
- 14.16 Toray Industries Inc.
- Toray Industries Inc. - Overview
- Toray Industries Inc. - Business segments
- Toray Industries Inc. - Key news
- Toray Industries Inc. - Key offerings
- Toray Industries Inc. - Segment focus
- SWOT
- 14.17 Veolia Environnement SA
- Veolia Environnement SA - Overview
- Veolia Environnement SA - Business segments
- Veolia Environnement SA - Key news
- Veolia Environnement SA - Key offerings
- Veolia Environnement SA - Segment focus
- SWOT
- 14.18 Vestas Wind Systems AS
- Vestas Wind Systems AS - Overview
- Vestas Wind Systems AS - Business segments
- Vestas Wind Systems AS - Key offerings
- Vestas Wind Systems AS - Segment focus
- SWOT
15 Appendix
- 15.1 Scope of the report
- 15.2 Inclusions and exclusions checklist
- Inclusions checklist
- Exclusions checklist
- 15.3 Currency conversion rates for US$
- Currency conversion rates for US$
- 15.4 Research methodology
- Research methodology
- 15.5 Data procurement
- Information sources
- 15.6 Data validation
- Data validation
- 15.7 Validation techniques employed for market sizing
- Validation techniques employed for market sizing
- 15.8 Data synthesis
- Data synthesis
- 15.9 360 degree market analysis
- 360 degree market analysis
- 15.10 List of abbreviations
- List of abbreviations

