|
|
市場調査レポート
商品コード
1581043
消火用スプリンクラーパイプの世界市場 (2024~2028年)Global Fire Sprinkler Pipes Market 2024-2028 |
||||||

|
|||||||
カスタマイズ可能
|
|||||||


| 消火用スプリンクラーパイプの世界市場 (2024~2028年) |
|
出版日: 2024年09月17日
発行: TechNavio
ページ情報: 英文 208 Pages
納期: 即納可能
|

全表示
- 概要
- 図表
- 目次
消火用スプリンクラーパイプ市場 (2024~2028年)
消火用スプリンクラーパイプ市場は2023年から2028年に55億7,800万米ドル分拡大し、予測期間中に7%のCAGRで成長すると予測されます。この調査レポートは、消火用スプリンクラーパイプ市場の全体分析、市場規模・予測、動向、成長促進要因、課題、約25社のベンダーを網羅したベンダー分析などを掲載しています。
当レポートでは、現在の市場シナリオ、最新動向と促進要因、市場環境全体に関する最新分析を提供しています。消火用スプリンクラーパイプの用途拡大、スプリンクラー設置義務化の推進、スプリンクラー装置の設置の容易さなどが、この市場を牽引しています。
| 市場範囲 | |
|---|---|
| 基準年 | 2024年 |
| 終了年 | 2028年 |
| 予測期間 | 2024~2028年 |
| 成長モメンタム | 加速 |
| 前年比 (2024年) | 5.8% |
| CAGR | 7% |
| 増分額 | 55億7,800万米ドル |
当レポートでは、今後数年間の消火用スプリンクラーパイプ市場の成長を促進する主な理由の一つとして、消火スプリンクラーの技術進歩を挙げています。また、市場ベンダー間の合併や買収の増加、耐腐食性の消火用スプリンクラーパイプの開発が、市場の大きな需要につながります。
目次
第1章 エグゼクティブサマリー
- 市場概要
第2章 Technavioによる分析
- 価格感応度・ライフサイクル・顧客購入バスケット・採用率・購入基準の分析
- インプットの重要性と差別化の要因
- 混乱の要因
- 促進要因と課題の影響
第3章 市場情勢
- 市場エコシステム
- 市場の特徴
- バリューチェーン分析
第4章 市場規模の評価
- 市場の定義
- 市場セグメント分析
- 市場規模 (2023年)
- 市場の見通し (2023~2028年)
第5章 市場規模実績
- 消火用スプリンクラーパイプの世界市場 (2018~2022年)
- 用途別分析 (2018~2022年)
- 材料別分析 (2018~2022年)
- 地域別分析 (2018~2022年)
- 国別分析 (2018~2022年)
第6章 定性分析
- 世界の消火用スプリンクラーパイプ市場におけるAIの影響
第7章 ファイブフォース分析
- ファイブフォースの要約
- 買い手の交渉力
- 供給企業の交渉力
- 新規参入業者の脅威
- 代替品の脅威
- 競争の脅威
- 市況
第8章 市場セグメンテーション:用途別
- 市場セグメンテーション
- 比較:用途別
- 商業用:市場規模と予測 (2023~2028年)
- 住宅用:市場規模と予測 (2023~2028年)
- 産業用:市場規模と予測 (2023~2028年)
- 用途別の市場機会
第9章 市場セグメンテーション:材料用
- 市場セグメンテーション
- 比較:材料用
- 鋼鉄:市場規模と予測 (2023~2028年)
- 銅:市場規模と予測 (2023~2028年)
- その他:市場規模と予測 (2023~2028年)
- 材料用の市場機会
第10章 顧客情勢
- 顧客情勢の概要
第11章 地域別情勢
- 地域別セグメンテーション
- 地域別比較
- アジア太平洋:市場規模と予測 (2023~2028年)
- 北米:市場規模と予測 (2023~2028年)
- 欧州:市場規模と予測 (2023~2028年)
- 中東・アフリカ:市場規模と予測 (2023~2028年)
- 南米:市場規模と予測 (2023~2028年)
- 米国:市場規模と予測 (2023~2028年)
- 中国:市場規模と予測 (2023~2028年)
- インド:市場規模と予測 (2023~2028年)
- ドイツ:市場規模と予測 (2023~2028年)
- 英国:市場規模と予測 (2023~2028年)
- フランス:市場規模と予測 (2023~2028年)
- 日本:市場規模と予測 (2023~2028年)
- ブラジル:市場規模と予測 (2023~2028年)
- カナダ:市場規模と予測 (2023~2028年)
- 韓国:市場規模と予測 (2023~2028年)
- 地域別の市場機会
第12章 促進要因・課題・機会・抑制要因
- 市場促進要因
- 市場の課題
- 促進要因と課題の影響
- 市場の機会・抑制要因
第13章 競合情勢
- 概要
- 競合情勢
- 混乱の状況
- 業界のリスク
第14章 競合分析
- 企業プロファイル
- 企業ランキング指数
- 企業の市場ポジショニング
- Aliaxis Holdings SA
- API Group Corp.
- Aquatherm LP
- ASC Engineered Solutions
- Johnson Controls International Plc.
- Mueller Water Products Inc
- NIBCO INC.
- Tata Steel Ltd.
- The Lubrizol Corp.
- The Supreme Industries Ltd.
- Uponor Corp.
- Victaulic Co.
- Viking Group Inc.
- Zekelman Industries
- Zurn Elkay Water Solutions Corp.
第15章 付録
Exhibits:
- Exhibits1: Executive Summary - Chart on Market Overview
- Exhibits2: Executive Summary - Data Table on Market Overview
- Exhibits3: Executive Summary - Chart on Global Market Characteristics
- Exhibits4: Executive Summary - Chart on Market By Geographical Landscape
- Exhibits5: Executive Summary - Chart on Market Segmentation by Application
- Exhibits6: Executive Summary - Chart on Market Segmentation by Material
- Exhibits7: Executive Summary - Chart on Incremental Growth
- Exhibits8: Executive Summary - Data Table on Incremental Growth
- Exhibits9: Executive Summary - Chart on Company Market Positioning
- Exhibits10: Analysis of price sensitivity, lifecycle, customer purchase basket, adoption rates, and purchase criteria
- Exhibits11: Overview on criticality of inputs and factors of differentiation
- Exhibits12: Overview on factors of disruption
- Exhibits13: Impact of drivers and challenges in 2023 and 2028
- Exhibits14: Parent Market
- Exhibits15: Data Table on - Parent Market
- Exhibits16: Market characteristics analysis
- Exhibits17: Value Chain Analysis
- Exhibits18: Offerings of companies included in the market definition
- Exhibits19: Market segments
- Exhibits20: Chart on Global - Market size and forecast 2023-2028 ($ million)
- Exhibits21: Data Table on Global - Market size and forecast 2023-2028 ($ million)
- Exhibits22: Chart on Global Market: Year-over-year growth 2023-2028 (%)
- Exhibits23: Data Table on Global Market: Year-over-year growth 2023-2028 (%)
- Exhibits24: Historic Market Size - Data Table on Global Fire Sprinkler Pipes Market 2018 - 2022 ($ million)
- Exhibits25: Historic Market Size - Application Segment 2018 - 2022 ($ million)
- Exhibits26: Historic Market Size - Material Segment 2018 - 2022 ($ million)
- Exhibits27: Historic Market Size - Geography Segment 2018 - 2022 ($ million)
- Exhibits28: Historic Market Size - Country Segment 2018 - 2022 ($ million)
- Exhibits29: Five forces analysis - Comparison between 2023 and 2028
- Exhibits30: Bargaining power of buyers - Impact of key factors 2023 and 2028
- Exhibits31: Bargaining power of suppliers - Impact of key factors in 2023 and 2028
- Exhibits32: Threat of new entrants - Impact of key factors in 2023 and 2028
- Exhibits33: Threat of substitutes - Impact of key factors in 2023 and 2028
- Exhibits34: Threat of rivalry - Impact of key factors in 2023 and 2028
- Exhibits35: Chart on Market condition - Five forces 2023 and 2028
- Exhibits36: Chart on Application - Market share 2023-2028 (%)
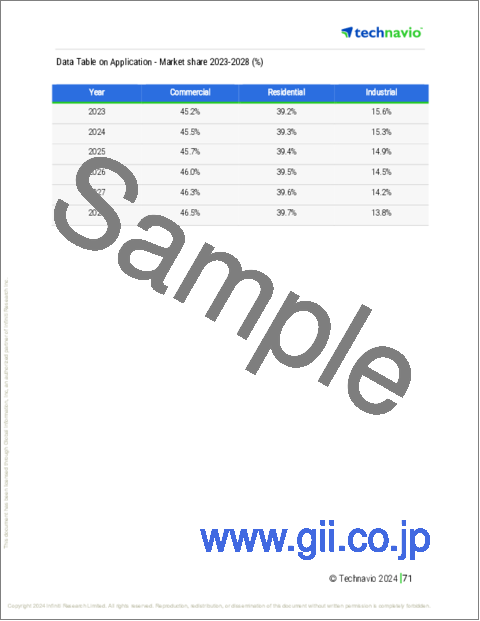
- Exhibits37: Data Table on Application - Market share 2023-2028 (%)
- Exhibits38: Chart on Comparison by Application
- Exhibits39: Data Table on Comparison by Application
- Exhibits40: Chart on Commercial - Market size and forecast 2023-2028 ($ million)
- Exhibits41: Data Table on Commercial - Market size and forecast 2023-2028 ($ million)
- Exhibits42: Chart on Commercial - Year-over-year growth 2023-2028 (%)
- Exhibits43: Data Table on Commercial - Year-over-year growth 2023-2028 (%)
- Exhibits44: Chart on Residential - Market size and forecast 2023-2028 ($ million)
- Exhibits45: Data Table on Residential - Market size and forecast 2023-2028 ($ million)
- Exhibits46: Chart on Residential - Year-over-year growth 2023-2028 (%)
- Exhibits47: Data Table on Residential - Year-over-year growth 2023-2028 (%)
- Exhibits48: Chart on Industrial - Market size and forecast 2023-2028 ($ million)
- Exhibits49: Data Table on Industrial - Market size and forecast 2023-2028 ($ million)
- Exhibits50: Chart on Industrial - Year-over-year growth 2023-2028 (%)
- Exhibits51: Data Table on Industrial - Year-over-year growth 2023-2028 (%)
- Exhibits52: Market opportunity by Application ($ million)
- Exhibits53: Data Table on Market opportunity by Application ($ million)
- Exhibits54: Chart on Material - Market share 2023-2028 (%)
- Exhibits55: Data Table on Material - Market share 2023-2028 (%)
- Exhibits56: Chart on Comparison by Material
- Exhibits57: Data Table on Comparison by Material
- Exhibits58: Chart on Steel - Market size and forecast 2023-2028 ($ million)
- Exhibits59: Data Table on Steel - Market size and forecast 2023-2028 ($ million)
- Exhibits60: Chart on Steel - Year-over-year growth 2023-2028 (%)
- Exhibits61: Data Table on Steel - Year-over-year growth 2023-2028 (%)
- Exhibits62: Chart on Copper - Market size and forecast 2023-2028 ($ million)
- Exhibits63: Data Table on Copper - Market size and forecast 2023-2028 ($ million)
- Exhibits64: Chart on Copper - Year-over-year growth 2023-2028 (%)
- Exhibits65: Data Table on Copper - Year-over-year growth 2023-2028 (%)
- Exhibits66: Chart on Others - Market size and forecast 2023-2028 ($ million)
- Exhibits67: Data Table on Others - Market size and forecast 2023-2028 ($ million)
- Exhibits68: Chart on Others - Year-over-year growth 2023-2028 (%)
- Exhibits69: Data Table on Others - Year-over-year growth 2023-2028 (%)
- Exhibits70: Market opportunity by Material ($ million)
- Exhibits71: Data Table on Market opportunity by Material ($ million)
- Exhibits72: Analysis of price sensitivity, lifecycle, customer purchase basket, adoption rates, and purchase criteria
- Exhibits73: Chart on Market share By Geographical Landscape 2023-2028 (%)
- Exhibits74: Data Table on Market share By Geographical Landscape 2023-2028 (%)
- Exhibits75: Chart on Geographic comparison
- Exhibits76: Data Table on Geographic comparison
- Exhibits77: Chart on APAC - Market size and forecast 2023-2028 ($ million)
- Exhibits78: Data Table on APAC - Market size and forecast 2023-2028 ($ million)
- Exhibits79: Chart on APAC - Year-over-year growth 2023-2028 (%)
- Exhibits80: Data Table on APAC - Year-over-year growth 2023-2028 (%)
- Exhibits81: Chart on North America - Market size and forecast 2023-2028 ($ million)
- Exhibits82: Data Table on North America - Market size and forecast 2023-2028 ($ million)
- Exhibits83: Chart on North America - Year-over-year growth 2023-2028 (%)
- Exhibits84: Data Table on North America - Year-over-year growth 2023-2028 (%)
- Exhibits85: Chart on Europe - Market size and forecast 2023-2028 ($ million)
- Exhibits86: Data Table on Europe - Market size and forecast 2023-2028 ($ million)
- Exhibits87: Chart on Europe - Year-over-year growth 2023-2028 (%)
- Exhibits88: Data Table on Europe - Year-over-year growth 2023-2028 (%)
- Exhibits89: Chart on Middle East and Africa - Market size and forecast 2023-2028 ($ million)
- Exhibits90: Data Table on Middle East and Africa - Market size and forecast 2023-2028 ($ million)
- Exhibits91: Chart on Middle East and Africa - Year-over-year growth 2023-2028 (%)
- Exhibits92: Data Table on Middle East and Africa - Year-over-year growth 2023-2028 (%)
- Exhibits93: Chart on South America - Market size and forecast 2023-2028 ($ million)
- Exhibits94: Data Table on South America - Market size and forecast 2023-2028 ($ million)
- Exhibits95: Chart on South America - Year-over-year growth 2023-2028 (%)
- Exhibits96: Data Table on South America - Year-over-year growth 2023-2028 (%)
- Exhibits97: Chart on US - Market size and forecast 2023-2028 ($ million)
- Exhibits98: Data Table on US - Market size and forecast 2023-2028 ($ million)
- Exhibits99: Chart on US - Year-over-year growth 2023-2028 (%)
- Exhibits100: Data Table on US - Year-over-year growth 2023-2028 (%)
- Exhibits101: Chart on China - Market size and forecast 2023-2028 ($ million)
- Exhibits102: Data Table on China - Market size and forecast 2023-2028 ($ million)
- Exhibits103: Chart on China - Year-over-year growth 2023-2028 (%)
- Exhibits104: Data Table on China - Year-over-year growth 2023-2028 (%)
- Exhibits105: Chart on India - Market size and forecast 2023-2028 ($ million)
- Exhibits106: Data Table on India - Market size and forecast 2023-2028 ($ million)
- Exhibits107: Chart on India - Year-over-year growth 2023-2028 (%)
- Exhibits108: Data Table on India - Year-over-year growth 2023-2028 (%)
- Exhibits109: Chart on Germany - Market size and forecast 2023-2028 ($ million)
- Exhibits110: Data Table on Germany - Market size and forecast 2023-2028 ($ million)
- Exhibits111: Chart on Germany - Year-over-year growth 2023-2028 (%)
- Exhibits112: Data Table on Germany - Year-over-year growth 2023-2028 (%)
- Exhibits113: Chart on UK - Market size and forecast 2023-2028 ($ million)
- Exhibits114: Data Table on UK - Market size and forecast 2023-2028 ($ million)
- Exhibits115: Chart on UK - Year-over-year growth 2023-2028 (%)
- Exhibits116: Data Table on UK - Year-over-year growth 2023-2028 (%)
- Exhibits117: Chart on France - Market size and forecast 2023-2028 ($ million)
- Exhibits118: Data Table on France - Market size and forecast 2023-2028 ($ million)
- Exhibits119: Chart on France - Year-over-year growth 2023-2028 (%)
- Exhibits120: Data Table on France - Year-over-year growth 2023-2028 (%)
- Exhibits121: Chart on Japan - Market size and forecast 2023-2028 ($ million)
- Exhibits122: Data Table on Japan - Market size and forecast 2023-2028 ($ million)
- Exhibits123: Chart on Japan - Year-over-year growth 2023-2028 (%)
- Exhibits124: Data Table on Japan - Year-over-year growth 2023-2028 (%)
- Exhibits125: Chart on Brazil - Market size and forecast 2023-2028 ($ million)
- Exhibits126: Data Table on Brazil - Market size and forecast 2023-2028 ($ million)
- Exhibits127: Chart on Brazil - Year-over-year growth 2023-2028 (%)
- Exhibits128: Data Table on Brazil - Year-over-year growth 2023-2028 (%)
- Exhibits129: Chart on Canada - Market size and forecast 2023-2028 ($ million)
- Exhibits130: Data Table on Canada - Market size and forecast 2023-2028 ($ million)
- Exhibits131: Chart on Canada - Year-over-year growth 2023-2028 (%)
- Exhibits132: Data Table on Canada - Year-over-year growth 2023-2028 (%)
- Exhibits133: Chart on South Korea - Market size and forecast 2023-2028 ($ million)
- Exhibits134: Data Table on South Korea - Market size and forecast 2023-2028 ($ million)
- Exhibits135: Chart on South Korea - Year-over-year growth 2023-2028 (%)
- Exhibits136: Data Table on South Korea - Year-over-year growth 2023-2028 (%)
- Exhibits137: Market opportunity By Geographical Landscape ($ million)
- Exhibits138: Data Tables on Market opportunity By Geographical Landscape ($ million)
- Exhibits139: Impact of drivers and challenges in 2023 and 2028
- Exhibits140: Overview on criticality of inputs and factors of differentiation
- Exhibits141: Overview on factors of disruption
- Exhibits142: Impact of key risks on business
- Exhibits143: Companies covered
- Exhibits144: Company ranking index
- Exhibits145: Matrix on companies position and classification
- Exhibits146: Aliaxis Holdings SA - Overview
- Exhibits147: Aliaxis Holdings SA - Product / Service
- Exhibits148: Aliaxis Holdings SA - Key news
- Exhibits149: Aliaxis Holdings SA - Key offerings
- Exhibits150: SWOT
- Exhibits151: API Group Corp. - Overview
- Exhibits152: API Group Corp. - Business segments
- Exhibits153: API Group Corp. - Key news
- Exhibits154: API Group Corp. - Key offerings
- Exhibits155: API Group Corp. - Segment focus
- Exhibits156: SWOT
- Exhibits157: Aquatherm LP - Overview
- Exhibits158: Aquatherm LP - Product / Service
- Exhibits159: Aquatherm LP - Key offerings
- Exhibits160: SWOT
- Exhibits161: ASC Engineered Solutions - Overview
- Exhibits162: ASC Engineered Solutions - Product / Service
- Exhibits163: ASC Engineered Solutions - Key offerings
- Exhibits164: SWOT
- Exhibits165: Johnson Controls International Plc. - Overview
- Exhibits166: Johnson Controls International Plc. - Business segments
- Exhibits167: Johnson Controls International Plc. - Key news
- Exhibits168: Johnson Controls International Plc. - Key offerings
- Exhibits169: Johnson Controls International Plc. - Segment focus
- Exhibits170: SWOT
- Exhibits171: Mueller Water Products Inc - Overview
- Exhibits172: Mueller Water Products Inc - Business segments
- Exhibits173: Mueller Water Products Inc - Key offerings
- Exhibits174: Mueller Water Products Inc - Segment focus
- Exhibits175: SWOT
- Exhibits176: NIBCO INC. - Overview
- Exhibits177: NIBCO INC. - Product / Service
- Exhibits178: NIBCO INC. - Key offerings
- Exhibits179: SWOT
- Exhibits180: Tata Steel Ltd. - Overview
- Exhibits181: Tata Steel Ltd. - Business segments
- Exhibits182: Tata Steel Ltd. - Key news
- Exhibits183: Tata Steel Ltd. - Key offerings
- Exhibits184: Tata Steel Ltd. - Segment focus
- Exhibits185: SWOT
- Exhibits186: The Lubrizol Corp. - Overview
- Exhibits187: The Lubrizol Corp. - Product / Service
- Exhibits188: The Lubrizol Corp. - Key offerings
- Exhibits189: SWOT
- Exhibits190: The Supreme Industries Ltd. - Overview
- Exhibits191: The Supreme Industries Ltd. - Business segments
- Exhibits192: The Supreme Industries Ltd. - Key offerings
- Exhibits193: The Supreme Industries Ltd. - Segment focus
- Exhibits194: SWOT
- Exhibits195: Uponor Corp. - Overview
- Exhibits196: Uponor Corp. - Business segments
- Exhibits197: Uponor Corp. - Key offerings
- Exhibits198: Uponor Corp. - Segment focus
- Exhibits199: SWOT
- Exhibits200: Victaulic Co. - Overview
- Exhibits201: Victaulic Co. - Product / Service
- Exhibits202: Victaulic Co. - Key offerings
- Exhibits203: SWOT
- Exhibits204: Viking Group Inc. - Overview
- Exhibits205: Viking Group Inc. - Product / Service
- Exhibits206: Viking Group Inc. - Key offerings
- Exhibits207: SWOT
- Exhibits208: Zekelman Industries - Overview
- Exhibits209: Zekelman Industries - Product / Service
- Exhibits210: Zekelman Industries - Key offerings
- Exhibits211: SWOT
- Exhibits212: Zurn Elkay Water Solutions Corp. - Overview
- Exhibits213: Zurn Elkay Water Solutions Corp. - Product / Service
- Exhibits214: Zurn Elkay Water Solutions Corp. - Key news
- Exhibits215: Zurn Elkay Water Solutions Corp. - Key offerings
- Exhibits216: SWOT
- Exhibits217: Inclusions checklist
- Exhibits218: Exclusions checklist
- Exhibits219: Currency conversion rates for US$
- Exhibits220: Research methodology
- Exhibits221: Information sources
- Exhibits222: Data validation
- Exhibits223: Validation techniques employed for market sizing
- Exhibits224: Data synthesis
- Exhibits225: 360 degree market analysis
- Exhibits226: List of abbreviations
Fire Sprinkler Pipes Market 2024-2028
The fire sprinkler pipes market is forecasted to grow by USD 5578 mn during 2023-2028, accelerating at a CAGR of 7% during the forecast period. The report on the fire sprinkler pipes market provides a holistic analysis, market size and forecast, trends, growth drivers, and challenges, as well as vendor analysis covering around 25 vendors.
The report offers an up-to-date analysis regarding the current market scenario, the latest trends and drivers, and the overall market environment. The market is driven by growing applications of fire sprinkler pipes, push toward mandatory installation of fire sprinklers, and easy installation of fire sprinkler systems.
| Market Scope | |
|---|---|
| Base Year | 2024 |
| End Year | 2028 |
| Series Year | 2024-2028 |
| Growth Momentum | Accelerate |
| YOY 2024 | 5.8% |
| CAGR | 7% |
| Incremental Value | $5578 mn |
Technavio's fire sprinkler pipes market is segmented as below:
By Application
- Commercial
- Residential
- Industrial
By Material
- Steel
- Copper
- Others
By Geographical Landscape
- APAC
- North America
- Europe
- Middle East and Africa
- South America
This study identifies the technological advancements in fire sprinklers as one of the prime reasons driving the fire sprinkler pipes market growth during the next few years. Also, growing mergers and acquisitions among market vendors and development of corrosion-resistant fire sprinkler pipes will lead to sizable demand in the market.
The report on the fire sprinkler pipes market covers the following areas:
- Fire sprinkler pipes market sizing
- Fire sprinkler pipes market forecast
- Fire sprinkler pipes market industry analysis
The robust vendor analysis is designed to help clients improve their market position, and in line with this, this report provides a detailed analysis of several leading fire sprinkler pipes market vendors that include Aliaxis Holdings SA, API Group Corp., Aquatherm LP, ASC Engineered Solutions, IPEX BRANDING INC., JM Eagle Inc, Johnson Controls International Plc., Mueller Water Products Inc, NIBCO INC., Spears Manufacturing Co., Tata Steel Ltd., The Lubrizol Corp., The Reliable Automatic Sprinkler Co. Inc., The Supreme Industries Ltd., Uponor Corp., Victaulic Co., Viking Group Inc., Zekelman Industries, and Zurn Elkay Water Solutions Corp.. Also, the fire sprinkler pipes market analysis report includes information on upcoming trends and challenges that will influence market growth. This is to help companies strategize and leverage all forthcoming growth opportunities.
The study was conducted using an objective combination of primary and secondary information including inputs from key participants in the industry. The report contains a comprehensive market and vendor landscape in addition to an analysis of the key vendors.
The publisher presents a detailed picture of the market by the way of study, synthesis, and summation of data from multiple sources by an analysis of key parameters such as profit, pricing, competition, and promotions. It presents various market facets by identifying the key industry influencers. The data presented is comprehensive, reliable, and a result of extensive primary and secondary research. The market research reports provide a complete competitive landscape and an in-depth vendor selection methodology and analysis using qualitative and quantitative research to forecast accurate market growth.
Table of Contents
1 Executive Summary
- 1.1 Market overview
- Executive Summary - Chart on Market Overview
- Executive Summary - Data Table on Market Overview
- Executive Summary - Chart on Global Market Characteristics
- Executive Summary - Chart on Market By Geographical Landscape
- Executive Summary - Chart on Market Segmentation by Application
- Executive Summary - Chart on Market Segmentation by Material
- Executive Summary - Chart on Incremental Growth
- Executive Summary - Data Table on Incremental Growth
- Executive Summary - Chart on Company Market Positioning
2 Technavio Analysis
- 2.1 Analysis of price sensitivity, lifecycle, customer purchase basket, adoption rates, and purchase criteria
- Analysis of price sensitivity, lifecycle, customer purchase basket, adoption rates, and purchase criteria
- 2.2 Criticality of inputs and Factors of differentiation
- Overview on criticality of inputs and factors of differentiation
- 2.3 Factors of disruption
- Overview on factors of disruption
- 2.4 Impact of drivers and challenges
- Impact of drivers and challenges in 2023 and 2028
3 Market Landscape
- 3.1 Market ecosystem
- Parent Market
- Data Table on - Parent Market
- 3.2 Market characteristics
- Market characteristics analysis
- 3.3 Value chain analysis
- Value Chain Analysis
4 Market Sizing
- 4.1 Market definition
- Offerings of companies included in the market definition
- 4.2 Market segment analysis
- Market segments
- 4.3 Market size 2023
- 4.4 Market outlook: Forecast for 2023-2028
- Chart on Global - Market size and forecast 2023-2028 ($ million)
- Data Table on Global - Market size and forecast 2023-2028 ($ million)
- Chart on Global Market: Year-over-year growth 2023-2028 (%)
- Data Table on Global Market: Year-over-year growth 2023-2028 (%)
5 Historic Market Size
- 5.1 Global Fire Sprinkler Pipes Market 2018 - 2022
- Historic Market Size - Data Table on Global Fire Sprinkler Pipes Market 2018 - 2022 ($ million)
- 5.2 Application segment analysis 2018 - 2022
- Historic Market Size - Application Segment 2018 - 2022 ($ million)
- 5.3 Material segment analysis 2018 - 2022
- Historic Market Size - Material Segment 2018 - 2022 ($ million)
- 5.4 Geography segment analysis 2018 - 2022
- Historic Market Size - Geography Segment 2018 - 2022 ($ million)
- 5.5 Country segment analysis 2018 - 2022
- Historic Market Size - Country Segment 2018 - 2022 ($ million)
6 Qualitative Analysis
- 6.1 Impact of AI on the global fire sprinkler pipes market
7 Five Forces Analysis
- 7.1 Five forces summary
- Five forces analysis - Comparison between 2023 and 2028
- 7.2 Bargaining power of buyers
- Bargaining power of buyers - Impact of key factors 2023 and 2028
- 7.3 Bargaining power of suppliers
- Bargaining power of suppliers - Impact of key factors in 2023 and 2028
- 7.4 Threat of new entrants
- Threat of new entrants - Impact of key factors in 2023 and 2028
- 7.5 Threat of substitutes
- Threat of substitutes - Impact of key factors in 2023 and 2028
- 7.6 Threat of rivalry
- Threat of rivalry - Impact of key factors in 2023 and 2028
- 7.7 Market condition
- Chart on Market condition - Five forces 2023 and 2028
8 Market Segmentation by Application
- 8.1 Market segments
- Chart on Application - Market share 2023-2028 (%)
- Data Table on Application - Market share 2023-2028 (%)
- 8.2 Comparison by Application
- Chart on Comparison by Application
- Data Table on Comparison by Application
- 8.3 Commercial - Market size and forecast 2023-2028
- Chart on Commercial - Market size and forecast 2023-2028 ($ million)
- Data Table on Commercial - Market size and forecast 2023-2028 ($ million)
- Chart on Commercial - Year-over-year growth 2023-2028 (%)
- Data Table on Commercial - Year-over-year growth 2023-2028 (%)
- 8.4 Residential - Market size and forecast 2023-2028
- Chart on Residential - Market size and forecast 2023-2028 ($ million)
- Data Table on Residential - Market size and forecast 2023-2028 ($ million)
- Chart on Residential - Year-over-year growth 2023-2028 (%)
- Data Table on Residential - Year-over-year growth 2023-2028 (%)
- 8.5 Industrial - Market size and forecast 2023-2028
- Chart on Industrial - Market size and forecast 2023-2028 ($ million)
- Data Table on Industrial - Market size and forecast 2023-2028 ($ million)
- Chart on Industrial - Year-over-year growth 2023-2028 (%)
- Data Table on Industrial - Year-over-year growth 2023-2028 (%)
- 8.6 Market opportunity by Application
- Market opportunity by Application ($ million)
- Data Table on Market opportunity by Application ($ million)
9 Market Segmentation by Material
- 9.1 Market segments
- Chart on Material - Market share 2023-2028 (%)
- Data Table on Material - Market share 2023-2028 (%)
- 9.2 Comparison by Material
- Chart on Comparison by Material
- Data Table on Comparison by Material
- 9.3 Steel - Market size and forecast 2023-2028
- Chart on Steel - Market size and forecast 2023-2028 ($ million)
- Data Table on Steel - Market size and forecast 2023-2028 ($ million)
- Chart on Steel - Year-over-year growth 2023-2028 (%)
- Data Table on Steel - Year-over-year growth 2023-2028 (%)
- 9.4 Copper - Market size and forecast 2023-2028
- Chart on Copper - Market size and forecast 2023-2028 ($ million)
- Data Table on Copper - Market size and forecast 2023-2028 ($ million)
- Chart on Copper - Year-over-year growth 2023-2028 (%)
- Data Table on Copper - Year-over-year growth 2023-2028 (%)
- 9.5 Others - Market size and forecast 2023-2028
- Chart on Others - Market size and forecast 2023-2028 ($ million)
- Data Table on Others - Market size and forecast 2023-2028 ($ million)
- Chart on Others - Year-over-year growth 2023-2028 (%)
- Data Table on Others - Year-over-year growth 2023-2028 (%)
- 9.6 Market opportunity by Material
- Market opportunity by Material ($ million)
- Data Table on Market opportunity by Material ($ million)
10 Customer Landscape
- 10.1 Customer landscape overview
- Analysis of price sensitivity, lifecycle, customer purchase basket, adoption rates, and purchase criteria
11 Geographic Landscape
- 11.1 Geographic segmentation
- Chart on Market share By Geographical Landscape 2023-2028 (%)
- Data Table on Market share By Geographical Landscape 2023-2028 (%)
- 11.2 Geographic comparison
- Chart on Geographic comparison
- Data Table on Geographic comparison
- 11.3 APAC - Market size and forecast 2023-2028
- Chart on APAC - Market size and forecast 2023-2028 ($ million)
- Data Table on APAC - Market size and forecast 2023-2028 ($ million)
- Chart on APAC - Year-over-year growth 2023-2028 (%)
- Data Table on APAC - Year-over-year growth 2023-2028 (%)
- 11.4 North America - Market size and forecast 2023-2028
- Chart on North America - Market size and forecast 2023-2028 ($ million)
- Data Table on North America - Market size and forecast 2023-2028 ($ million)
- Chart on North America - Year-over-year growth 2023-2028 (%)
- Data Table on North America - Year-over-year growth 2023-2028 (%)
- 11.5 Europe - Market size and forecast 2023-2028
- Chart on Europe - Market size and forecast 2023-2028 ($ million)
- Data Table on Europe - Market size and forecast 2023-2028 ($ million)
- Chart on Europe - Year-over-year growth 2023-2028 (%)
- Data Table on Europe - Year-over-year growth 2023-2028 (%)
- 11.6 Middle East and Africa - Market size and forecast 2023-2028
- Chart on Middle East and Africa - Market size and forecast 2023-2028 ($ million)
- Data Table on Middle East and Africa - Market size and forecast 2023-2028 ($ million)
- Chart on Middle East and Africa - Year-over-year growth 2023-2028 (%)
- Data Table on Middle East and Africa - Year-over-year growth 2023-2028 (%)
- 11.7 South America - Market size and forecast 2023-2028
- Chart on South America - Market size and forecast 2023-2028 ($ million)
- Data Table on South America - Market size and forecast 2023-2028 ($ million)
- Chart on South America - Year-over-year growth 2023-2028 (%)
- Data Table on South America - Year-over-year growth 2023-2028 (%)
- 11.8 US - Market size and forecast 2023-2028
- Chart on US - Market size and forecast 2023-2028 ($ million)
- Data Table on US - Market size and forecast 2023-2028 ($ million)
- Chart on US - Year-over-year growth 2023-2028 (%)
- Data Table on US - Year-over-year growth 2023-2028 (%)
- 11.9 China - Market size and forecast 2023-2028
- Chart on China - Market size and forecast 2023-2028 ($ million)
- Data Table on China - Market size and forecast 2023-2028 ($ million)
- Chart on China - Year-over-year growth 2023-2028 (%)
- Data Table on China - Year-over-year growth 2023-2028 (%)
- 11.10 India - Market size and forecast 2023-2028
- Chart on India - Market size and forecast 2023-2028 ($ million)
- Data Table on India - Market size and forecast 2023-2028 ($ million)
- Chart on India - Year-over-year growth 2023-2028 (%)
- Data Table on India - Year-over-year growth 2023-2028 (%)
- 11.11 Germany - Market size and forecast 2023-2028
- Chart on Germany - Market size and forecast 2023-2028 ($ million)
- Data Table on Germany - Market size and forecast 2023-2028 ($ million)
- Chart on Germany - Year-over-year growth 2023-2028 (%)
- Data Table on Germany - Year-over-year growth 2023-2028 (%)
- 11.12 UK - Market size and forecast 2023-2028
- Chart on UK - Market size and forecast 2023-2028 ($ million)
- Data Table on UK - Market size and forecast 2023-2028 ($ million)
- Chart on UK - Year-over-year growth 2023-2028 (%)
- Data Table on UK - Year-over-year growth 2023-2028 (%)
- 11.13 France - Market size and forecast 2023-2028
- Chart on France - Market size and forecast 2023-2028 ($ million)
- Data Table on France - Market size and forecast 2023-2028 ($ million)
- Chart on France - Year-over-year growth 2023-2028 (%)
- Data Table on France - Year-over-year growth 2023-2028 (%)
- 11.14 Japan - Market size and forecast 2023-2028
- Chart on Japan - Market size and forecast 2023-2028 ($ million)
- Data Table on Japan - Market size and forecast 2023-2028 ($ million)
- Chart on Japan - Year-over-year growth 2023-2028 (%)
- Data Table on Japan - Year-over-year growth 2023-2028 (%)
- 11.15 Brazil - Market size and forecast 2023-2028
- Chart on Brazil - Market size and forecast 2023-2028 ($ million)
- Data Table on Brazil - Market size and forecast 2023-2028 ($ million)
- Chart on Brazil - Year-over-year growth 2023-2028 (%)
- Data Table on Brazil - Year-over-year growth 2023-2028 (%)
- 11.16 Canada - Market size and forecast 2023-2028
- Chart on Canada - Market size and forecast 2023-2028 ($ million)
- Data Table on Canada - Market size and forecast 2023-2028 ($ million)
- Chart on Canada - Year-over-year growth 2023-2028 (%)
- Data Table on Canada - Year-over-year growth 2023-2028 (%)
- 11.17 South Korea - Market size and forecast 2023-2028
- Chart on South Korea - Market size and forecast 2023-2028 ($ million)
- Data Table on South Korea - Market size and forecast 2023-2028 ($ million)
- Chart on South Korea - Year-over-year growth 2023-2028 (%)
- Data Table on South Korea - Year-over-year growth 2023-2028 (%)
- 11.18 Market opportunity By Geographical Landscape
- Market opportunity By Geographical Landscape ($ million)
- Data Tables on Market opportunity By Geographical Landscape ($ million)
12 Drivers, Challenges, and Opportunity/Restraints
- 12.1 Market drivers
- 12.2 Market challenges
- 12.3 Impact of drivers and challenges
- Impact of drivers and challenges in 2023 and 2028
- 12.4 Market opportunities/restraints
13 Competitive Landscape
- 13.1 Overview
- 13.2 Competitive Landscape
- Overview on criticality of inputs and factors of differentiation
- 13.3 Landscape disruption
- Overview on factors of disruption
- 13.4 Industry risks
- Impact of key risks on business
14 Competitive Analysis
- 14.1 Companies profiled
- Companies covered
- 14.2 Company ranking index
- Company ranking index
- 14.3 Market positioning of companies
- Matrix on companies position and classification
- 14.4 Aliaxis Holdings SA
- Aliaxis Holdings SA - Overview
- Aliaxis Holdings SA - Product / Service
- Aliaxis Holdings SA - Key news
- Aliaxis Holdings SA - Key offerings
- SWOT
- 14.5 API Group Corp.
- API Group Corp. - Overview
- API Group Corp. - Business segments
- API Group Corp. - Key news
- API Group Corp. - Key offerings
- API Group Corp. - Segment focus
- SWOT
- 14.6 Aquatherm LP
- Aquatherm LP - Overview
- Aquatherm LP - Product / Service
- Aquatherm LP - Key offerings
- SWOT
- 14.7 ASC Engineered Solutions
- ASC Engineered Solutions - Overview
- ASC Engineered Solutions - Product / Service
- ASC Engineered Solutions - Key offerings
- SWOT
- 14.8 Johnson Controls International Plc.
- Johnson Controls International Plc. - Overview
- Johnson Controls International Plc. - Business segments
- Johnson Controls International Plc. - Key news
- Johnson Controls International Plc. - Key offerings
- Johnson Controls International Plc. - Segment focus
- SWOT
- 14.9 Mueller Water Products Inc
- Mueller Water Products Inc - Overview
- Mueller Water Products Inc - Business segments
- Mueller Water Products Inc - Key offerings
- Mueller Water Products Inc - Segment focus
- SWOT
- 14.10 NIBCO INC.
- NIBCO INC. - Overview
- NIBCO INC. - Product / Service
- NIBCO INC. - Key offerings
- SWOT
- 14.11 Tata Steel Ltd.
- Tata Steel Ltd. - Overview
- Tata Steel Ltd. - Business segments
- Tata Steel Ltd. - Key news
- Tata Steel Ltd. - Key offerings
- Tata Steel Ltd. - Segment focus
- SWOT
- 14.12 The Lubrizol Corp.
- The Lubrizol Corp. - Overview
- The Lubrizol Corp. - Product / Service
- The Lubrizol Corp. - Key offerings
- SWOT
- 14.13 The Supreme Industries Ltd.
- The Supreme Industries Ltd. - Overview
- The Supreme Industries Ltd. - Business segments
- The Supreme Industries Ltd. - Key offerings
- The Supreme Industries Ltd. - Segment focus
- SWOT
- 14.14 Uponor Corp.
- Uponor Corp. - Overview
- Uponor Corp. - Business segments
- Uponor Corp. - Key offerings
- Uponor Corp. - Segment focus
- SWOT
- 14.15 Victaulic Co.
- Victaulic Co. - Overview
- Victaulic Co. - Product / Service
- Victaulic Co. - Key offerings
- SWOT
- 14.16 Viking Group Inc.
- Viking Group Inc. - Overview
- Viking Group Inc. - Product / Service
- Viking Group Inc. - Key offerings
- SWOT
- 14.17 Zekelman Industries
- Zekelman Industries - Overview
- Zekelman Industries - Product / Service
- Zekelman Industries - Key offerings
- SWOT
- 14.18 Zurn Elkay Water Solutions Corp.
- Zurn Elkay Water Solutions Corp. - Overview
- Zurn Elkay Water Solutions Corp. - Product / Service
- Zurn Elkay Water Solutions Corp. - Key news
- Zurn Elkay Water Solutions Corp. - Key offerings
- SWOT
15 Appendix
- 15.1 Scope of the report
- 15.2 Inclusions and exclusions checklist
- Inclusions checklist
- Exclusions checklist
- 15.3 Currency conversion rates for US$
- Currency conversion rates for US$
- 15.4 Research methodology
- Research methodology
- 15.5 Data procurement
- Information sources
- 15.6 Data validation
- Data validation
- 15.7 Validation techniques employed for market sizing
- Validation techniques employed for market sizing
- 15.8 Data synthesis
- Data synthesis
- 15.9 360 degree market analysis
- 360 degree market analysis
- 15.10 List of abbreviations
- List of abbreviations

