|
|
市場調査レポート
商品コード
1911273
世界の配管用パイプ及び継手市場2026-2030年Global Plumbing Pipes And Pipe Fittings Market 2026-2030 |
||||||
|
|||||||
カスタマイズ可能
|
|||||||

| 世界の配管用パイプ及び継手市場2026-2030年 |
|
出版日: 2026年01月14日
発行: TechNavio
ページ情報: 英文 292 Pages
納期: 即納可能
|

概要
世界の配管用パイプおよび継手市場は、2025年から2030年にかけて527億7,510万米ドルの成長が見込まれ、予測期間中のCAGRは15.9%と予測されています。
本報告書では、世界の配管用パイプおよび継手市場に関する包括的な分析、市場規模と予測、動向、成長要因、課題に加え、約25社のベンダー分析を提供しております。
本レポートでは、現在の市場状況、最新の動向と促進要因、市場環境全般に関する最新の分析を提供しております。市場の成長要因としては、建設活動の増加、配管パイプおよび継手の購入におけるECサイトの利用拡大、プレハブ住宅への需要急増が挙げられます。
本調査は、業界の主要関係者からの情報を含む、一次情報と二次情報の客観的な組み合わせを用いて実施されました。本レポートには、主要企業の分析に加え、包括的な市場規模データ、地域別分析を伴うセグメント、ベンダー情勢が含まれています。レポートには過去データと予測データが掲載されています。
| 市場範囲 | |
|---|---|
| 基準年 | 2026年 |
| 終了年 | 2030年 |
| 予測期間 | 2026-2030 |
| 成長モメンタム | 加速 |
| 前年比2026年 | 14.9% |
| CAGR | 15.9% |
| 増分額 | 527億7,510万米ドル |
本調査では、今後数年間における世界の配管用パイプおよび継手市場の成長を牽引する主要な要因の一つとして、持続可能な配管用パイプおよび継手に対する需要の急増を特定しております。また、無機的成長戦略への注目の高まりと、配管用パイプおよび継手に使用される材料の進歩が、市場における相当な需要につながると見込まれます。
目次
第1章 エグゼクティブサマリー
- 市場概要
第2章 Technavio分析
- 価格・ライフサイクル・顧客購入バスケット・採用率・購入基準の分析
- インプットの重要性と差別化の要因
- 混乱の要因
- 促進要因と課題の影響
第3章 市場情勢
- 市場エコシステム
- 市場の特徴
- バリューチェーン分析
第4章 市場規模
- 市場の定義
- 市場セグメント分析
- 市場規模 2025
- 市場の見通し 2025-2030
第5章 市場規模実績
- 世界の配管用パイプ及び継手市場 2020-2024
- 製品セグメント分析 2020-2024
- 用途別セグメント分析 2020-2024
- 材質セグメント分析 2020-2024
- 地域別セグメント分析 2020-2024
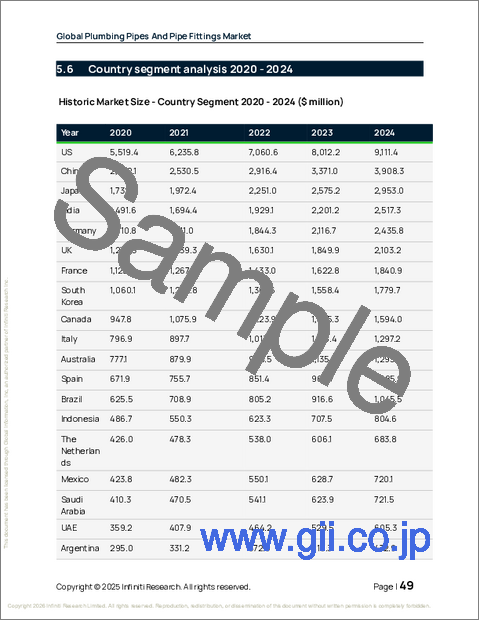
- 国別セグメント分析 2020-2024
第6章 定性分析
- 人工知能(AI)が世界の配管用パイプ及び継手市場
第7章 ファイブフォース分析
- ファイブフォースの要約
- 買い手の交渉力
- 供給企業の交渉力
- 新規参入業者の脅威
- 代替品の脅威
- 競争の脅威
- 市況
第8章 市場セグメンテーション:製品別
- 市場セグメント
- 比較:製品別
- パイプ:市場規模と予測 2025-2030
- 継手:市場規模と予測 2025-2030
- 市場機会:製品別
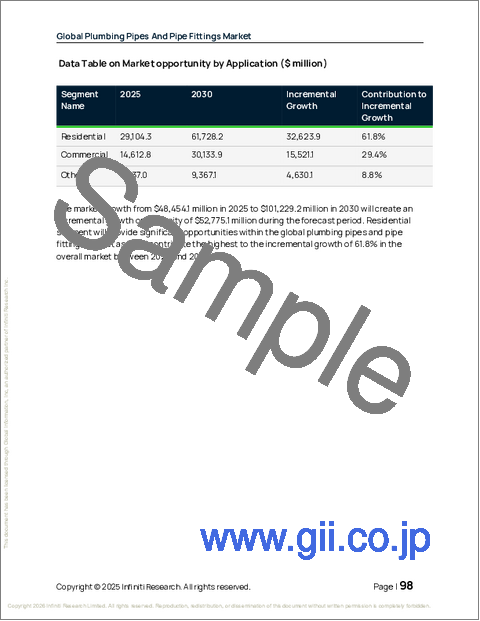
第9章 市場セグメンテーション:用途別
- 市場セグメント
- 比較:用途別
- 住宅用:市場規模と予測 2025-2030
- 商業用:市場規模と予測 2025-2030
- その他:市場規模と予測 2025-2030
- 市場機会:用途別
第10章 市場セグメンテーション:素材別
- 市場セグメント
- 比較:素材別
- 銅:市場規模と予測 2025-2030
- 鋼材:市場規模と予測 2025-2030
- CPVC:市場規模と予測 2025-2030
- 真鍮:市場規模と予測 2025-2030
- 市場機会:素材別
第11章 顧客情勢
- 顧客情勢の概要
第12章 地域別情勢
- 地域別セグメンテーション
- 地域別比較
- アジア太平洋:市場規模と予測 2025-2030
- 北米:市場規模と予測 2025-2030
- 欧州:市場規模と予測 2025-2030
- 中東・アフリカ:市場規模と予測 2025-2030
- 南米:市場規模と予測 2025-2030
- 市場機会:地域別
第13章 促進要因、課題、および機会
- 市場促進要因
- 市場の課題
- 促進要因と課題の影響
- 市場機会
第14章 競合情勢
- 概要
- 競合情勢
- 混乱の状況
- 業界のリスク
第15章 競合分析
- 企業プロファイル
- 企業ランキング指標
- 企業の市場ポジショニング
- Aliaxis Holdings SA
- Apollo Pipes Ltd.
- Astral Ltd.
- Chevron Phillips Chemical Co.
- China Lesso Group Holdings
- Compagnie de Saint Gobain SA
- Finolex Industries Ltd.
- Hindware Ltd.
- IPEX BRANDING INC.
- JM Eagle Inc.
- Pipelife International GmbH
- The Supreme Industries Ltd.
- Uponor Corp.
- Viega GmbH and Co. KG
- Wavin BV
