|
|
市場調査レポート
商品コード
1580801
廃熱回収の世界市場、2024~2028年Global Waste Heat Recovery Market 2024-2028 |
||||||

|
|||||||
カスタマイズ可能
|
|||||||

| 廃熱回収の世界市場、2024~2028年 |
|
出版日: 2024年10月16日
発行: TechNavio
ページ情報: 英文 160 Pages
納期: 即納可能
|

全表示
- 概要
- 図表
- 目次
廃熱回収市場、2024~2028年
廃熱回収市場は2023~2028年に225億5,860万米ドル、予測期間中のCAGRは7.1%で成長すると予測されます。当レポートでは、廃熱回収市場の全体的な分析、市場規模・予測、動向、成長促進要因、課題、約25のベンダーを網羅したベンダー分析などを掲載しています。
現在の市場シナリオ、最新動向と促進要因、市場環境全体に関する最新分析を提供しています。市場は、ブリックスにおける工業化の進展、エネルギーコストの上昇、厳しい排出規制によって牽引されています。
| 市場範囲 | |
|---|---|
| 基準年 | 2024年 |
| 終了年 | 2028年 |
| 予測期間 | 2024~2028年 |
| 成長モメンタム | 加速 |
| 前年比[2024年] | 6.5% |
| CAGR | 7.1% |
| 増分額 | 225億5,860万米ドル |
本調査では、熱電材料を使用した直接廃熱回収の出現が、今後数年間の廃熱回収市場成長を促進する主要要因の一つであると指摘しています。また、内燃機関における廃熱回収システムの使用増加や廃熱回収の先端技術の出現は、市場の大きな需要につながります。
目次
第1章 エグゼクティブサマリー
- 市場概要
第2章 市場情勢
- 市場エコシステム
- 市場の特徴
- バリューチェーン分析
第3章 市場規模の評価
- 市場の定義
- 市場セグメント分析
- 市場規模 2023年
- 市場の展望 2023~2028年
第4章 市場規模実績
- 廃熱回収の世界市場 2018~2022年
- エンドユーザー別セグメント分析 2018~2022年
- 地域別セグメント分析 2018~2022年
- 国別セグメント分析 2018~2022年
第5章 ファイブフォース分析
- ファイブフォースの要約
- 買い手の交渉力
- 供給企業の交渉力
- 新規参入業者の脅威
- 代替品の脅威
- 競争の脅威
- 市況
第6章 市場セグメンテーション:エンドユーザー別
- 市場セグメンテーション
- 比較:エンドユーザー別
- 化学薬品:市場規模と予測 2023~2028年
- 石油精製:市場規模と予測 2023~2028年
- 紙:市場規模と予測 2023~2028年
- 商業と機関:市場規模と予測 2023~2028年
- その他:市場規模と予測 2023~2028年
- エンドユーザー別の市場機会
第7章 顧客情勢
- 顧客情勢概要
第8章 地域別情勢
- 地域別セグメンテーション
- 比較:地域別
- 北米:市場規模と予測 2023~2028年
- 欧州:市場規模と予測 2023~2028年
- アジア太平洋:市場規模と予測 2023~2028年
- 中東・アフリカ:市場規模と予測 2023~2028年
- 南米:市場規模と予測 2023~2028年
- 米国:市場規模と予測 2023~2028年
- 中国:市場規模と予測 2023~2028年
- 日本:市場規模と予測 2023~2028年
- ドイツ:市場規模と予測 2023~2028年
- 韓国:市場規模と予測 2023~2028年
- 地域情勢別の市場機会
第9章 促進要因・課題・機会・抑制要因
- 市場促進要因
- 市場課題
- 促進要因と課題の影響
- 市場の機会・抑制要因
第10章 競合情勢
- 概要
- 競合情勢
- 混乱の状況
- 業界のリスク
第11章 競合分析
- 企業プロファイル
- 企業の市場ポジショニング
- ABB Ltd.
- Alfa Laval AB
- Clean Energy Technologies Inc.
- GEA Group AG
- General Electric Co.
- John Wood Group PLC
- Mitsubishi Heavy Industries Ltd
- Robert Bosch GmbH
- Siemens AG
- Thermax Ltd.
第12章 付録
Exhibits:
- Exhibits1: Executive Summary - Chart on Market Overview
- Exhibits2: Executive Summary - Data Table on Market Overview
- Exhibits3: Executive Summary - Chart on Global Market Characteristics
- Exhibits4: Executive Summary - Chart on Market By Geographical Landscape
- Exhibits5: Executive Summary - Chart on Market Segmentation by End-user
- Exhibits6: Executive Summary - Chart on Incremental Growth
- Exhibits7: Executive Summary - Data Table on Incremental Growth
- Exhibits8: Executive Summary - Chart on Company Market Positioning
- Exhibits9: Parent Market
- Exhibits10: Data Table on - Parent Market
- Exhibits11: Market characteristics analysis
- Exhibits12: Value Chain Analysis
- Exhibits13: Offerings of companies included in the market definition
- Exhibits14: Market segments
- Exhibits15: Chart on Global - Market size and forecast 2023-2028 ($ million)
- Exhibits16: Data Table on Global - Market size and forecast 2023-2028 ($ million)
- Exhibits17: Chart on Global Market: Year-over-year growth 2023-2028 (%)
- Exhibits18: Data Table on Global Market: Year-over-year growth 2023-2028 (%)
- Exhibits19: Historic Market Size - Data Table on Global Waste Heat Recovery Market 2018 - 2022 ($ million)
- Exhibits20: Historic Market Size - End-user Segment 2018 - 2022 ($ million)
- Exhibits21: Historic Market Size - Geography Segment 2018 - 2022 ($ million)
- Exhibits22: Historic Market Size - Country Segment 2018 - 2022 ($ million)
- Exhibits23: Five forces analysis - Comparison between 2023 and 2028
- Exhibits24: Bargaining power of buyers - Impact of key factors 2023 and 2028
- Exhibits25: Bargaining power of suppliers - Impact of key factors in 2023 and 2028
- Exhibits26: Threat of new entrants - Impact of key factors in 2023 and 2028
- Exhibits27: Threat of substitutes - Impact of key factors in 2023 and 2028
- Exhibits28: Threat of rivalry - Impact of key factors in 2023 and 2028
- Exhibits29: Chart on Market condition - Five forces 2023 and 2028
- Exhibits30: Chart on End-user - Market share 2023-2028 (%)
- Exhibits31: Data Table on End-user - Market share 2023-2028 (%)
- Exhibits32: Chart on Comparison by End-user
- Exhibits33: Data Table on Comparison by End-user
- Exhibits34: Chart on Chemical - Market size and forecast 2023-2028 ($ million)
- Exhibits35: Data Table on Chemical - Market size and forecast 2023-2028 ($ million)
- Exhibits36: Chart on Chemical - Year-over-year growth 2023-2028 (%)
- Exhibits37: Data Table on Chemical - Year-over-year growth 2023-2028 (%)
- Exhibits38: Chart on Petroleum refining - Market size and forecast 2023-2028 ($ million)
- Exhibits39: Data Table on Petroleum refining - Market size and forecast 2023-2028 ($ million)
- Exhibits40: Chart on Petroleum refining - Year-over-year growth 2023-2028 (%)
- Exhibits41: Data Table on Petroleum refining - Year-over-year growth 2023-2028 (%)
- Exhibits42: Chart on Paper - Market size and forecast 2023-2028 ($ million)
- Exhibits43: Data Table on Paper - Market size and forecast 2023-2028 ($ million)
- Exhibits44: Chart on Paper - Year-over-year growth 2023-2028 (%)
- Exhibits45: Data Table on Paper - Year-over-year growth 2023-2028 (%)
- Exhibits46: Chart on Commercial and institutional - Market size and forecast 2023-2028 ($ million)
- Exhibits47: Data Table on Commercial and institutional - Market size and forecast 2023-2028 ($ million)
- Exhibits48: Chart on Commercial and institutional - Year-over-year growth 2023-2028 (%)
- Exhibits49: Data Table on Commercial and institutional - Year-over-year growth 2023-2028 (%)
- Exhibits50: Chart on Others - Market size and forecast 2023-2028 ($ million)
- Exhibits51: Data Table on Others - Market size and forecast 2023-2028 ($ million)
- Exhibits52: Chart on Others - Year-over-year growth 2023-2028 (%)
- Exhibits53: Data Table on Others - Year-over-year growth 2023-2028 (%)
- Exhibits54: Market opportunity by End-user ($ million)
- Exhibits55: Data Table on Market opportunity by End-user ($ million)
- Exhibits56: Analysis of price sensitivity, lifecycle, customer purchase basket, adoption rates, and purchase criteria
- Exhibits57: Chart on Market share By Geographical Landscape 2023-2028 (%)
- Exhibits58: Data Table on Market share By Geographical Landscape 2023-2028 (%)
- Exhibits59: Chart on Geographic comparison
- Exhibits60: Data Table on Geographic comparison
- Exhibits61: Chart on North America - Market size and forecast 2023-2028 ($ million)
- Exhibits62: Data Table on North America - Market size and forecast 2023-2028 ($ million)
- Exhibits63: Chart on North America - Year-over-year growth 2023-2028 (%)
- Exhibits64: Data Table on North America - Year-over-year growth 2023-2028 (%)
- Exhibits65: Chart on Europe - Market size and forecast 2023-2028 ($ million)
- Exhibits66: Data Table on Europe - Market size and forecast 2023-2028 ($ million)
- Exhibits67: Chart on Europe - Year-over-year growth 2023-2028 (%)
- Exhibits68: Data Table on Europe - Year-over-year growth 2023-2028 (%)
- Exhibits69: Chart on APAC - Market size and forecast 2023-2028 ($ million)
- Exhibits70: Data Table on APAC - Market size and forecast 2023-2028 ($ million)
- Exhibits71: Chart on APAC - Year-over-year growth 2023-2028 (%)
- Exhibits72: Data Table on APAC - Year-over-year growth 2023-2028 (%)
- Exhibits73: Chart on Middle East and Africa - Market size and forecast 2023-2028 ($ million)
- Exhibits74: Data Table on Middle East and Africa - Market size and forecast 2023-2028 ($ million)
- Exhibits75: Chart on Middle East and Africa - Year-over-year growth 2023-2028 (%)
- Exhibits76: Data Table on Middle East and Africa - Year-over-year growth 2023-2028 (%)
- Exhibits77: Chart on South America - Market size and forecast 2023-2028 ($ million)
- Exhibits78: Data Table on South America - Market size and forecast 2023-2028 ($ million)
- Exhibits79: Chart on South America - Year-over-year growth 2023-2028 (%)
- Exhibits80: Data Table on South America - Year-over-year growth 2023-2028 (%)
- Exhibits81: Chart on US - Market size and forecast 2023-2028 ($ million)
- Exhibits82: Data Table on US - Market size and forecast 2023-2028 ($ million)
- Exhibits83: Chart on US - Year-over-year growth 2023-2028 (%)
- Exhibits84: Data Table on US - Year-over-year growth 2023-2028 (%)
- Exhibits85: Chart on China - Market size and forecast 2023-2028 ($ million)
- Exhibits86: Data Table on China - Market size and forecast 2023-2028 ($ million)
- Exhibits87: Chart on China - Year-over-year growth 2023-2028 (%)
- Exhibits88: Data Table on China - Year-over-year growth 2023-2028 (%)
- Exhibits89: Chart on Japan - Market size and forecast 2023-2028 ($ million)
- Exhibits90: Data Table on Japan - Market size and forecast 2023-2028 ($ million)
- Exhibits91: Chart on Japan - Year-over-year growth 2023-2028 (%)
- Exhibits92: Data Table on Japan - Year-over-year growth 2023-2028 (%)
- Exhibits93: Chart on Germany - Market size and forecast 2023-2028 ($ million)
- Exhibits94: Data Table on Germany - Market size and forecast 2023-2028 ($ million)
- Exhibits95: Chart on Germany - Year-over-year growth 2023-2028 (%)
- Exhibits96: Data Table on Germany - Year-over-year growth 2023-2028 (%)
- Exhibits97: Chart on South Korea - Market size and forecast 2023-2028 ($ million)
- Exhibits98: Data Table on South Korea - Market size and forecast 2023-2028 ($ million)
- Exhibits99: Chart on South Korea - Year-over-year growth 2023-2028 (%)
- Exhibits100: Data Table on South Korea - Year-over-year growth 2023-2028 (%)
- Exhibits101: Market opportunity By Geographical Landscape ($ million)
- Exhibits102: Data Tables on Market opportunity By Geographical Landscape ($ million)
- Exhibits103: Impact of drivers and challenges in 2023 and 2028
- Exhibits104: Overview on criticality of inputs and factors of differentiation
- Exhibits105: Overview on factors of disruption
- Exhibits106: Impact of key risks on business
- Exhibits107: Companies covered
- Exhibits108: Matrix on companies position and classification
- Exhibits109: ABB Ltd. - Overview
- Exhibits110: ABB Ltd. - Business segments
- Exhibits111: ABB Ltd. - Key news
- Exhibits112: ABB Ltd. - Key offerings
- Exhibits113: ABB Ltd. - Segment focus
- Exhibits114: Alfa Laval AB - Overview
- Exhibits115: Alfa Laval AB - Business segments
- Exhibits116: Alfa Laval AB - Key news
- Exhibits117: Alfa Laval AB - Key offerings
- Exhibits118: Alfa Laval AB - Segment focus
- Exhibits119: Clean Energy Technologies Inc. - Overview
- Exhibits120: Clean Energy Technologies Inc. - Business segments
- Exhibits121: Clean Energy Technologies Inc. - Key offerings
- Exhibits122: Clean Energy Technologies Inc. - Segment focus
- Exhibits123: GEA Group AG - Overview
- Exhibits124: GEA Group AG - Business segments
- Exhibits125: GEA Group AG - Key offerings
- Exhibits126: GEA Group AG - Segment focus
- Exhibits127: General Electric Co. - Overview
- Exhibits128: General Electric Co. - Business segments
- Exhibits129: General Electric Co. - Key news
- Exhibits130: General Electric Co. - Key offerings
- Exhibits131: General Electric Co. - Segment focus
- Exhibits132: John Wood Group PLC - Overview
- Exhibits133: John Wood Group PLC - Business segments
- Exhibits134: John Wood Group PLC - Key offerings
- Exhibits135: John Wood Group PLC - Segment focus
- Exhibits136: Mitsubishi Heavy Industries Ltd - Overview
- Exhibits137: Mitsubishi Heavy Industries Ltd - Business segments
- Exhibits138: Mitsubishi Heavy Industries Ltd - Key news
- Exhibits139: Mitsubishi Heavy Industries Ltd - Key offerings
- Exhibits140: Mitsubishi Heavy Industries Ltd - Segment focus
- Exhibits141: Robert Bosch GmbH - Overview
- Exhibits142: Robert Bosch GmbH - Product / Service
- Exhibits143: Robert Bosch GmbH - Key news
- Exhibits144: Robert Bosch GmbH - Key offerings
- Exhibits145: Siemens AG - Overview
- Exhibits146: Siemens AG - Business segments
- Exhibits147: Siemens AG - Key news
- Exhibits148: Siemens AG - Key offerings
- Exhibits149: Siemens AG - Segment focus
- Exhibits150: Thermax Ltd. - Overview
- Exhibits151: Thermax Ltd. - Business segments
- Exhibits152: Thermax Ltd. - Key news
- Exhibits153: Thermax Ltd. - Key offerings
- Exhibits154: Thermax Ltd. - Segment focus
- Exhibits155: Inclusions checklist
- Exhibits156: Exclusions checklist
- Exhibits157: Currency conversion rates for US$
- Exhibits158: Research methodology
- Exhibits159: Information sources
- Exhibits160: Data validation
- Exhibits161: Validation techniques employed for market sizing
- Exhibits162: Data synthesis
- Exhibits163: 360 degree market analysis
- Exhibits164: List of abbreviations
Waste Heat Recovery Market 2024-2028
The waste heat recovery market is forecasted to grow by USD 22558.6 mn during 2023-2028, accelerating at a CAGR of 7.1% during the forecast period. The report on the waste heat recovery market provides a holistic analysis, market size and forecast, trends, growth drivers, and challenges, as well as vendor analysis covering around 25 vendors.
The report offers an up-to-date analysis regarding the current market scenario, the latest trends and drivers, and the overall market environment. The market is driven by rise in industrialization in brics, increase in energy costs, and stringent emission regulations.
| Market Scope | |
|---|---|
| Base Year | 2024 |
| End Year | 2028 |
| Series Year | 2024-2028 |
| Growth Momentum | Accelerate |
| YOY 2024 | 6.5% |
| CAGR | 7.1% |
| Incremental Value | $22558.6 mn |
Technavio's waste heat recovery market is segmented as below:
By End-user
- Chemical
- Petroleum refining
- Paper
- Commercial and institutional
- Others
By Geographical Landscape
- North America
- Europe
- APAC
- Middle East and Africa
- South America
This study identifies the emergence of direct waste heat recovery using thermoelectric materials as one of the prime reasons driving the waste heat recovery market growth during the next few years. Also, rise in use of waste heat recovery systems in combustion engines and emergence of advanced technologies for waste heat recovery will lead to sizable demand in the market.
The report on the waste heat recovery market covers the following areas:
- Waste Heat Recovery Market sizing
- Waste Heat Recovery Market forecast
- Waste Heat Recovery Market industry analysis
The robust vendor analysis is designed to help clients improve their market position, and in line with this, this report provides a detailed analysis of several leading waste heat recovery market vendors that include ABB Ltd., Alfa Laval AB, ALSTOM SA, Cannon Spa, Clean Energy Technologies Inc., Econotherm Ltd., Forbes Marshall Pvt. Ltd., GEA Group AG, General Electric Co., John Wood Group PLC, KNM Group Berhad, Mitsubishi Heavy Industries Ltd, Muhibbah Engineering M Bhd., Ormat Technologies Inc., Promec Engineering Ltd., Questor Technology Inc., Robert Bosch GmbH, Siemens AG, Thermax Ltd., and Transparent Energy Systems Pvt. Ltd.. Also, the waste heat recovery market analysis report includes information on upcoming trends and challenges that will influence market growth. This is to help companies strategize and leverage all forthcoming growth opportunities.
The study was conducted using an objective combination of primary and secondary information including inputs from key participants in the industry. The report contains a comprehensive market and vendor landscape in addition to an analysis of the key vendors.
The publisher presents a detailed picture of the market by the way of study, synthesis, and summation of data from multiple sources by an analysis of key parameters such as profit, pricing, competition, and promotions. It presents various market facets by identifying the key industry influencers. The data presented is comprehensive, reliable, and a result of extensive primary and secondary research. The market research reports provide a complete competitive landscape and an in-depth vendor selection methodology and analysis using qualitative and quantitative research to forecast accurate market growth.
Table of Contents
1 Executive Summary
- 1.1 Market overview
- Executive Summary - Chart on Market Overview
- Executive Summary - Data Table on Market Overview
- Executive Summary - Chart on Global Market Characteristics
- Executive Summary - Chart on Market By Geographical Landscape
- Executive Summary - Chart on Market Segmentation by End-user
- Executive Summary - Chart on Incremental Growth
- Executive Summary - Data Table on Incremental Growth
- Executive Summary - Chart on Company Market Positioning
2 Market Landscape
- 2.1 Market ecosystem
- Parent Market
- Data Table on - Parent Market
- 2.2 Market characteristics
- Market characteristics analysis
- 2.3 Value chain analysis
- Value Chain Analysis
3 Market Sizing
- 3.1 Market definition
- Offerings of companies included in the market definition
- 3.2 Market segment analysis
- Market segments
- 3.3 Market size 2023
- 3.4 Market outlook: Forecast for 2023-2028
- Chart on Global - Market size and forecast 2023-2028 ($ million)
- Data Table on Global - Market size and forecast 2023-2028 ($ million)
- Chart on Global Market: Year-over-year growth 2023-2028 (%)
- Data Table on Global Market: Year-over-year growth 2023-2028 (%)
4 Historic Market Size
- 4.1 Global Waste Heat Recovery Market 2018 - 2022
- Historic Market Size - Data Table on Global Waste Heat Recovery Market 2018 - 2022 ($ million)
- 4.2 End-user segment analysis 2018 - 2022
- Historic Market Size - End-user Segment 2018 - 2022 ($ million)
- 4.3 Geography segment analysis 2018 - 2022
- Historic Market Size - Geography Segment 2018 - 2022 ($ million)
- 4.4 Country segment analysis 2018 - 2022
- Historic Market Size - Country Segment 2018 - 2022 ($ million)
5 Five Forces Analysis
- 5.1 Five forces summary
- Five forces analysis - Comparison between 2023 and 2028
- 5.2 Bargaining power of buyers
- Bargaining power of buyers - Impact of key factors 2023 and 2028
- 5.3 Bargaining power of suppliers
- Bargaining power of suppliers - Impact of key factors in 2023 and 2028
- 5.4 Threat of new entrants
- Threat of new entrants - Impact of key factors in 2023 and 2028
- 5.5 Threat of substitutes
- Threat of substitutes - Impact of key factors in 2023 and 2028
- 5.6 Threat of rivalry
- Threat of rivalry - Impact of key factors in 2023 and 2028
- 5.7 Market condition
- Chart on Market condition - Five forces 2023 and 2028
6 Market Segmentation by End-user
- 6.1 Market segments
- Chart on End-user - Market share 2023-2028 (%)
- Data Table on End-user - Market share 2023-2028 (%)
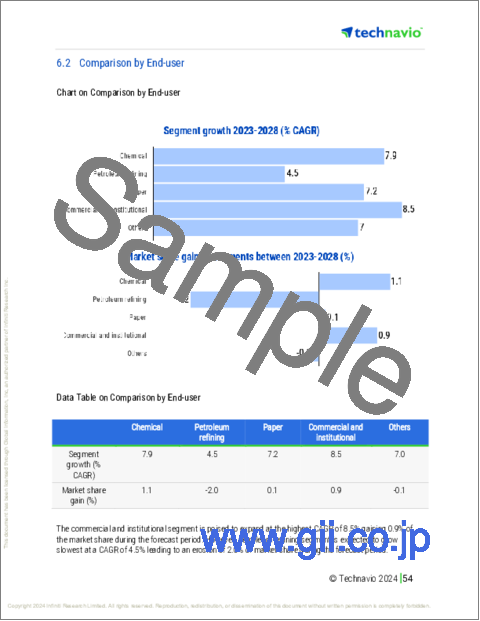
- 6.2 Comparison by End-user
- Chart on Comparison by End-user
- Data Table on Comparison by End-user
- 6.3 Chemical - Market size and forecast 2023-2028
- Chart on Chemical - Market size and forecast 2023-2028 ($ million)
- Data Table on Chemical - Market size and forecast 2023-2028 ($ million)
- Chart on Chemical - Year-over-year growth 2023-2028 (%)
- Data Table on Chemical - Year-over-year growth 2023-2028 (%)
- 6.4 Petroleum refining - Market size and forecast 2023-2028
- Chart on Petroleum refining - Market size and forecast 2023-2028 ($ million)
- Data Table on Petroleum refining - Market size and forecast 2023-2028 ($ million)
- Chart on Petroleum refining - Year-over-year growth 2023-2028 (%)
- Data Table on Petroleum refining - Year-over-year growth 2023-2028 (%)
- 6.5 Paper - Market size and forecast 2023-2028
- Chart on Paper - Market size and forecast 2023-2028 ($ million)
- Data Table on Paper - Market size and forecast 2023-2028 ($ million)
- Chart on Paper - Year-over-year growth 2023-2028 (%)
- Data Table on Paper - Year-over-year growth 2023-2028 (%)
- 6.6 Commercial and institutional - Market size and forecast 2023-2028
- Chart on Commercial and institutional - Market size and forecast 2023-2028 ($ million)
- Data Table on Commercial and institutional - Market size and forecast 2023-2028 ($ million)
- Chart on Commercial and institutional - Year-over-year growth 2023-2028 (%)
- Data Table on Commercial and institutional - Year-over-year growth 2023-2028 (%)
- 6.7 Others - Market size and forecast 2023-2028
- Chart on Others - Market size and forecast 2023-2028 ($ million)
- Data Table on Others - Market size and forecast 2023-2028 ($ million)
- Chart on Others - Year-over-year growth 2023-2028 (%)
- Data Table on Others - Year-over-year growth 2023-2028 (%)
- 6.8 Market opportunity by End-user
- Market opportunity by End-user ($ million)
- Data Table on Market opportunity by End-user ($ million)
7 Customer Landscape
- 7.1 Customer landscape overview
- Analysis of price sensitivity, lifecycle, customer purchase basket, adoption rates, and purchase criteria
8 Geographic Landscape
- 8.1 Geographic segmentation
- Chart on Market share By Geographical Landscape 2023-2028 (%)
- Data Table on Market share By Geographical Landscape 2023-2028 (%)
- 8.2 Geographic comparison
- Chart on Geographic comparison
- Data Table on Geographic comparison
- 8.3 North America - Market size and forecast 2023-2028
- Chart on North America - Market size and forecast 2023-2028 ($ million)
- Data Table on North America - Market size and forecast 2023-2028 ($ million)
- Chart on North America - Year-over-year growth 2023-2028 (%)
- Data Table on North America - Year-over-year growth 2023-2028 (%)
- 8.4 Europe - Market size and forecast 2023-2028
- Chart on Europe - Market size and forecast 2023-2028 ($ million)
- Data Table on Europe - Market size and forecast 2023-2028 ($ million)
- Chart on Europe - Year-over-year growth 2023-2028 (%)
- Data Table on Europe - Year-over-year growth 2023-2028 (%)
- 8.5 APAC - Market size and forecast 2023-2028
- Chart on APAC - Market size and forecast 2023-2028 ($ million)
- Data Table on APAC - Market size and forecast 2023-2028 ($ million)
- Chart on APAC - Year-over-year growth 2023-2028 (%)
- Data Table on APAC - Year-over-year growth 2023-2028 (%)
- 8.6 Middle East and Africa - Market size and forecast 2023-2028
- Chart on Middle East and Africa - Market size and forecast 2023-2028 ($ million)
- Data Table on Middle East and Africa - Market size and forecast 2023-2028 ($ million)
- Chart on Middle East and Africa - Year-over-year growth 2023-2028 (%)
- Data Table on Middle East and Africa - Year-over-year growth 2023-2028 (%)
- 8.7 South America - Market size and forecast 2023-2028
- Chart on South America - Market size and forecast 2023-2028 ($ million)
- Data Table on South America - Market size and forecast 2023-2028 ($ million)
- Chart on South America - Year-over-year growth 2023-2028 (%)
- Data Table on South America - Year-over-year growth 2023-2028 (%)
- 8.8 US - Market size and forecast 2023-2028
- Chart on US - Market size and forecast 2023-2028 ($ million)
- Data Table on US - Market size and forecast 2023-2028 ($ million)
- Chart on US - Year-over-year growth 2023-2028 (%)
- Data Table on US - Year-over-year growth 2023-2028 (%)
- 8.9 China - Market size and forecast 2023-2028
- Chart on China - Market size and forecast 2023-2028 ($ million)
- Data Table on China - Market size and forecast 2023-2028 ($ million)
- Chart on China - Year-over-year growth 2023-2028 (%)
- Data Table on China - Year-over-year growth 2023-2028 (%)
- 8.10 Japan - Market size and forecast 2023-2028
- Chart on Japan - Market size and forecast 2023-2028 ($ million)
- Data Table on Japan - Market size and forecast 2023-2028 ($ million)
- Chart on Japan - Year-over-year growth 2023-2028 (%)
- Data Table on Japan - Year-over-year growth 2023-2028 (%)
- 8.11 Germany - Market size and forecast 2023-2028
- Chart on Germany - Market size and forecast 2023-2028 ($ million)
- Data Table on Germany - Market size and forecast 2023-2028 ($ million)
- Chart on Germany - Year-over-year growth 2023-2028 (%)
- Data Table on Germany - Year-over-year growth 2023-2028 (%)
- 8.12 South Korea - Market size and forecast 2023-2028
- Chart on South Korea - Market size and forecast 2023-2028 ($ million)
- Data Table on South Korea - Market size and forecast 2023-2028 ($ million)
- Chart on South Korea - Year-over-year growth 2023-2028 (%)
- Data Table on South Korea - Year-over-year growth 2023-2028 (%)
- 8.13 Market opportunity By Geographical Landscape
- Market opportunity By Geographical Landscape ($ million)
- Data Tables on Market opportunity By Geographical Landscape ($ million)
9 Drivers, Challenges, and Opportunity/Restraints
- 9.1 Market drivers
- 9.2 Market challenges
- 9.3 Impact of drivers and challenges
- Impact of drivers and challenges in 2023 and 2028
- 9.4 Market opportunities/restraints
10 Competitive Landscape
- 10.1 Overview
- 10.2 Competitive Landscape
- Overview on criticality of inputs and factors of differentiation
- 10.3 Landscape disruption
- Overview on factors of disruption
- 10.4 Industry risks
- Impact of key risks on business
11 Competitive Analysis
- 11.1 Companies profiled
- Companies covered
- 11.2 Market positioning of companies
- Matrix on companies position and classification
- 11.3 ABB Ltd.
- ABB Ltd. - Overview
- ABB Ltd. - Business segments
- ABB Ltd. - Key news
- ABB Ltd. - Key offerings
- ABB Ltd. - Segment focus
- 11.4 Alfa Laval AB
- Alfa Laval AB - Overview
- Alfa Laval AB - Business segments
- Alfa Laval AB - Key news
- Alfa Laval AB - Key offerings
- Alfa Laval AB - Segment focus
- 11.5 Clean Energy Technologies Inc.
- Clean Energy Technologies Inc. - Overview
- Clean Energy Technologies Inc. - Business segments
- Clean Energy Technologies Inc. - Key offerings
- Clean Energy Technologies Inc. - Segment focus
- 11.6 GEA Group AG
- GEA Group AG - Overview
- GEA Group AG - Business segments
- GEA Group AG - Key offerings
- GEA Group AG - Segment focus
- 11.7 General Electric Co.
- General Electric Co. - Overview
- General Electric Co. - Business segments
- General Electric Co. - Key news
- General Electric Co. - Key offerings
- General Electric Co. - Segment focus
- 11.8 John Wood Group PLC
- John Wood Group PLC - Overview
- John Wood Group PLC - Business segments
- John Wood Group PLC - Key offerings
- John Wood Group PLC - Segment focus
- 11.9 Mitsubishi Heavy Industries Ltd
- Mitsubishi Heavy Industries Ltd - Overview
- Mitsubishi Heavy Industries Ltd - Business segments
- Mitsubishi Heavy Industries Ltd - Key news
- Mitsubishi Heavy Industries Ltd - Key offerings
- Mitsubishi Heavy Industries Ltd - Segment focus
- 11.10 Robert Bosch GmbH
- Robert Bosch GmbH - Overview
- Robert Bosch GmbH - Product / Service
- Robert Bosch GmbH - Key news
- Robert Bosch GmbH - Key offerings
- 11.11 Siemens AG
- Siemens AG - Overview
- Siemens AG - Business segments
- Siemens AG - Key news
- Siemens AG - Key offerings
- Siemens AG - Segment focus
- 11.12 Thermax Ltd.
- Thermax Ltd. - Overview
- Thermax Ltd. - Business segments
- Thermax Ltd. - Key news
- Thermax Ltd. - Key offerings
- Thermax Ltd. - Segment focus
12 Appendix
- 12.1 Scope of the report
- 12.2 Inclusions and exclusions checklist
- Inclusions checklist
- Exclusions checklist
- 12.3 Currency conversion rates for US$
- Currency conversion rates for US$
- 12.4 Research methodology
- Research methodology
- 12.5 Data procurement
- Information sources
- 12.6 Data validation
- Data validation
- 12.7 Validation techniques employed for market sizing
- Validation techniques employed for market sizing
- 12.8 Data synthesis
- Data synthesis
- 12.9 360 degree market analysis
- 360 degree market analysis
- 12.10 List of abbreviations
- List of abbreviations

