|
|
市場調査レポート
商品コード
1580783
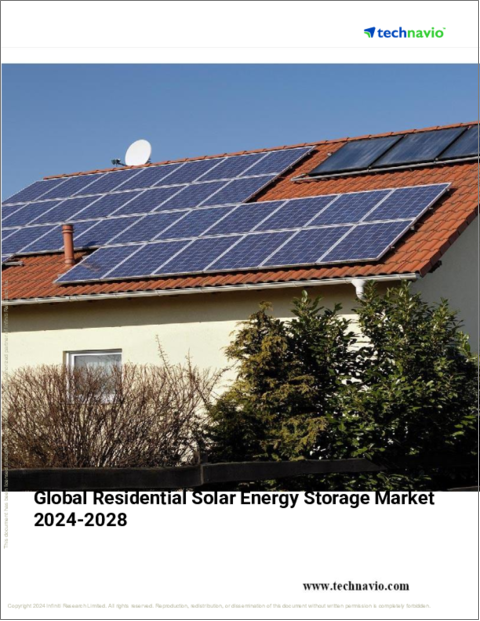
住宅用太陽エネルギー貯蔵の世界市場、2024~2028年Global Residential Solar Energy Storage Market 2024-2028 |
||||||
|
|||||||
カスタマイズ可能
|
|||||||


| 住宅用太陽エネルギー貯蔵の世界市場、2024~2028年 |
|
出版日: 2024年10月18日
発行: TechNavio
ページ情報: 英文 155 Pages
納期: 即納可能
|

全表示
- 概要
- 図表
- 目次
住宅用太陽エネルギー貯蔵市場、2024~2028年
住宅用太陽エネルギー貯蔵市場は2023~2028年に1,135億5,420万米ドル、予測期間中のCAGRは52.6%で成長すると予測されます。当レポートでは、住宅用太陽エネルギー貯蔵市場の全体的な分析、市場規模・予測、動向、成長促進要因、課題、約25のベンダーを網羅したベンダー分析などを掲載しています。
現在の市場シナリオ、最新動向と促進要因、市場環境全体に関する最新分析を提供しています。市場を牽引するのは、太陽光発電と蓄電システムのコスト削減、自家消費の増加とインセンティブの利用可能性、エネルギーコストの上昇です。
| 市場範囲 | |
|---|---|
| 基準年 | 2024年 |
| 終了年 | 2028年 |
| 予測期間 | 2024~2028年 |
| 成長モメンタム | 加速 |
| 前年比[2024年] | 40.2% |
| CAGR | 52.6% |
| 増分額 | 1,135億5,420万米ドル |
本調査では、仮想発電所としての住宅用エネルギー貯蔵が、今後数年間の住宅用太陽エネルギー貯蔵市場成長を牽引する主要因の1つであるとしています。また、市場の新たなベンダーの魅力、グリーン建設支出の増加、ゼロエネルギー住宅が市場の大きな需要につながります。
目次
第1章 エグゼクティブサマリー
- 市場概要
第2章 市場情勢
- 市場エコシステム
- 市場の特徴
- バリューチェーン分析
第3章 市場規模の評価
- 市場の定義
- 市場セグメント分析
- 市場規模 2023年
- 市場の展望 2023~2028年
第4章 市場規模実績
- 住宅用太陽エネルギー貯蔵の世界市場 2018~2022年
- 技術別セグメント分析 2018~2022年
- 地域別セグメント分析 2018~2022年
- 国別セグメント分析 2018~2022年
第5章 ファイブフォース分析
- ファイブフォースの要約
- 買い手の交渉力
- 供給企業の交渉力
- 新規参入業者の脅威
- 代替品の脅威
- 競争の脅威
- 市況
第6章 市場セグメンテーション:技術別
- 市場セグメンテーション
- 比較:技術別
- リチウムイオン電池:市場規模と予測 2023~2028年
- 鉛蓄電池:市場規模と予測 2023~2028年
- 技術別の市場機会
第7章 顧客情勢
- 顧客情勢概要
第8章 地域別情勢
- 地域別セグメンテーション
- 比較:地域別
- アジア太平洋:市場規模と予測 2023~2028年
- 北米:市場規模と予測 2023~2028年
- 欧州:市場規模と予測 2023~2028年
- 南米:市場規模と予測 2023~2028年
- 中東・アフリカ:市場規模と予測 2023~2028年
- 中国:市場規模と予測 2023~2028年
- 米国:市場規模と予測 2023~2028年
- 日本:市場規模と予測 2023~2028年
- カナダ:市場規模と予測 2023~2028年
- ドイツ:市場規模と予測 2023~2028年
- 地域情勢別の市場機会
第9章 促進要因・課題・機会・抑制要因
- 市場促進要因
- 市場課題
- 促進要因と課題の影響
- 市場の機会・抑制要因
第10章 競合情勢
- 概要
- 競合情勢
- 混乱の状況
- 業界のリスク
第11章 競合分析
- 企業プロファイル
- 企業の市場ポジショニング
- East Penn Manufacturing Co. Inc.
- Enphase Energy Inc.
- Invinity Energy Systems plc
- LG Electronics Inc.
- Panasonic Holdings Corp.
- Samsung SDI Co. Ltd.
- Shell plc
- SOLARWATT GmbH
- Sony Group Corp.
- TotalEnergies SE
第12章 付録
Exhibits:
- Exhibits1: Executive Summary - Chart on Market Overview
- Exhibits2: Executive Summary - Data Table on Market Overview
- Exhibits3: Executive Summary - Chart on Global Market Characteristics
- Exhibits4: Executive Summary - Chart on Market By Geographical Landscape
- Exhibits5: Executive Summary - Chart on Market Segmentation by Technology
- Exhibits6: Executive Summary - Chart on Incremental Growth
- Exhibits7: Executive Summary - Data Table on Incremental Growth
- Exhibits8: Executive Summary - Chart on Company Market Positioning
- Exhibits9: Parent Market
- Exhibits10: Data Table on - Parent Market
- Exhibits11: Market characteristics analysis
- Exhibits12: Value Chain Analysis
- Exhibits13: Offerings of companies included in the market definition
- Exhibits14: Market segments
- Exhibits15: Chart on Global - Market size and forecast 2023-2028 ($ million)
- Exhibits16: Data Table on Global - Market size and forecast 2023-2028 ($ million)
- Exhibits17: Chart on Global Market: Year-over-year growth 2023-2028 (%)
- Exhibits18: Data Table on Global Market: Year-over-year growth 2023-2028 (%)
- Exhibits19: Historic Market Size - Data Table on Global Residential Solar Energy Storage Market 2018 - 2022 ($ million)
- Exhibits20: Historic Market Size - Technology Segment 2018 - 2022 ($ million)
- Exhibits21: Historic Market Size - Geography Segment 2018 - 2022 ($ million)
- Exhibits22: Historic Market Size - Country Segment 2018 - 2022 ($ million)
- Exhibits23: Five forces analysis - Comparison between 2023 and 2028
- Exhibits24: Bargaining power of buyers - Impact of key factors 2023 and 2028
- Exhibits25: Bargaining power of suppliers - Impact of key factors in 2023 and 2028
- Exhibits26: Threat of new entrants - Impact of key factors in 2023 and 2028
- Exhibits27: Threat of substitutes - Impact of key factors in 2023 and 2028
- Exhibits28: Threat of rivalry - Impact of key factors in 2023 and 2028
- Exhibits29: Chart on Market condition - Five forces 2023 and 2028
- Exhibits30: Chart on Technology - Market share 2023-2028 (%)
- Exhibits31: Data Table on Technology - Market share 2023-2028 (%)
- Exhibits32: Chart on Comparison by Technology
- Exhibits33: Data Table on Comparison by Technology
- Exhibits34: Chart on Li-ion batteries - Market size and forecast 2023-2028 ($ million)
- Exhibits35: Data Table on Li-ion batteries - Market size and forecast 2023-2028 ($ million)
- Exhibits36: Chart on Li-ion batteries - Year-over-year growth 2023-2028 (%)
- Exhibits37: Data Table on Li-ion batteries - Year-over-year growth 2023-2028 (%)
- Exhibits38: Chart on Lead acid batteries - Market size and forecast 2023-2028 ($ million)
- Exhibits39: Data Table on Lead acid batteries - Market size and forecast 2023-2028 ($ million)
- Exhibits40: Chart on Lead acid batteries - Year-over-year growth 2023-2028 (%)
- Exhibits41: Data Table on Lead acid batteries - Year-over-year growth 2023-2028 (%)
- Exhibits42: Market opportunity by Technology ($ million)
- Exhibits43: Data Table on Market opportunity by Technology ($ million)
- Exhibits44: Analysis of price sensitivity, lifecycle, customer purchase basket, adoption rates, and purchase criteria
- Exhibits45: Chart on Market share By Geographical Landscape 2023-2028 (%)
- Exhibits46: Data Table on Market share By Geographical Landscape 2023-2028 (%)
- Exhibits47: Chart on Geographic comparison
- Exhibits48: Data Table on Geographic comparison
- Exhibits49: Chart on APAC - Market size and forecast 2023-2028 ($ million)
- Exhibits50: Data Table on APAC - Market size and forecast 2023-2028 ($ million)
- Exhibits51: Chart on APAC - Year-over-year growth 2023-2028 (%)
- Exhibits52: Data Table on APAC - Year-over-year growth 2023-2028 (%)
- Exhibits53: Chart on North America - Market size and forecast 2023-2028 ($ million)
- Exhibits54: Data Table on North America - Market size and forecast 2023-2028 ($ million)
- Exhibits55: Chart on North America - Year-over-year growth 2023-2028 (%)
- Exhibits56: Data Table on North America - Year-over-year growth 2023-2028 (%)
- Exhibits57: Chart on Europe - Market size and forecast 2023-2028 ($ million)
- Exhibits58: Data Table on Europe - Market size and forecast 2023-2028 ($ million)
- Exhibits59: Chart on Europe - Year-over-year growth 2023-2028 (%)
- Exhibits60: Data Table on Europe - Year-over-year growth 2023-2028 (%)
- Exhibits61: Chart on South America - Market size and forecast 2023-2028 ($ million)
- Exhibits62: Data Table on South America - Market size and forecast 2023-2028 ($ million)
- Exhibits63: Chart on South America - Year-over-year growth 2023-2028 (%)
- Exhibits64: Data Table on South America - Year-over-year growth 2023-2028 (%)
- Exhibits65: Chart on Middle East and Africa - Market size and forecast 2023-2028 ($ million)
- Exhibits66: Data Table on Middle East and Africa - Market size and forecast 2023-2028 ($ million)
- Exhibits67: Chart on Middle East and Africa - Year-over-year growth 2023-2028 (%)
- Exhibits68: Data Table on Middle East and Africa - Year-over-year growth 2023-2028 (%)
- Exhibits69: Chart on China - Market size and forecast 2023-2028 ($ million)
- Exhibits70: Data Table on China - Market size and forecast 2023-2028 ($ million)
- Exhibits71: Chart on China - Year-over-year growth 2023-2028 (%)
- Exhibits72: Data Table on China - Year-over-year growth 2023-2028 (%)
- Exhibits73: Chart on US - Market size and forecast 2023-2028 ($ million)
- Exhibits74: Data Table on US - Market size and forecast 2023-2028 ($ million)
- Exhibits75: Chart on US - Year-over-year growth 2023-2028 (%)
- Exhibits76: Data Table on US - Year-over-year growth 2023-2028 (%)
- Exhibits77: Chart on Japan - Market size and forecast 2023-2028 ($ million)
- Exhibits78: Data Table on Japan - Market size and forecast 2023-2028 ($ million)
- Exhibits79: Chart on Japan - Year-over-year growth 2023-2028 (%)
- Exhibits80: Data Table on Japan - Year-over-year growth 2023-2028 (%)
- Exhibits81: Chart on Canada - Market size and forecast 2023-2028 ($ million)
- Exhibits82: Data Table on Canada - Market size and forecast 2023-2028 ($ million)
- Exhibits83: Chart on Canada - Year-over-year growth 2023-2028 (%)
- Exhibits84: Data Table on Canada - Year-over-year growth 2023-2028 (%)
- Exhibits85: Chart on Germany - Market size and forecast 2023-2028 ($ million)
- Exhibits86: Data Table on Germany - Market size and forecast 2023-2028 ($ million)
- Exhibits87: Chart on Germany - Year-over-year growth 2023-2028 (%)
- Exhibits88: Data Table on Germany - Year-over-year growth 2023-2028 (%)
- Exhibits89: Market opportunity By Geographical Landscape ($ million)
- Exhibits90: Data Tables on Market opportunity By Geographical Landscape ($ million)
- Exhibits91: Impact of drivers and challenges in 2023 and 2028
- Exhibits92: Overview on criticality of inputs and factors of differentiation
- Exhibits93: Overview on factors of disruption
- Exhibits94: Impact of key risks on business
- Exhibits95: Companies covered
- Exhibits96: Matrix on companies position and classification
- Exhibits97: East Penn Manufacturing Co. Inc. - Overview
- Exhibits98: East Penn Manufacturing Co. Inc. - Product / Service
- Exhibits99: East Penn Manufacturing Co. Inc. - Key news
- Exhibits100: East Penn Manufacturing Co. Inc. - Key offerings
- Exhibits101: Enphase Energy Inc. - Overview
- Exhibits102: Enphase Energy Inc. - Product / Service
- Exhibits103: Enphase Energy Inc. - Key news
- Exhibits104: Enphase Energy Inc. - Key offerings
- Exhibits105: Invinity Energy Systems plc - Overview
- Exhibits106: Invinity Energy Systems plc - Product / Service
- Exhibits107: Invinity Energy Systems plc - Key offerings
- Exhibits108: LG Electronics Inc. - Overview
- Exhibits109: LG Electronics Inc. - Product / Service
- Exhibits110: LG Electronics Inc. - Key offerings
- Exhibits111: Panasonic Holdings Corp. - Overview
- Exhibits112: Panasonic Holdings Corp. - Business segments
- Exhibits113: Panasonic Holdings Corp. - Key news
- Exhibits114: Panasonic Holdings Corp. - Key offerings
- Exhibits115: Panasonic Holdings Corp. - Segment focus
- Exhibits116: Samsung SDI Co. Ltd. - Overview
- Exhibits117: Samsung SDI Co. Ltd. - Business segments
- Exhibits118: Samsung SDI Co. Ltd. - Key offerings
- Exhibits119: Samsung SDI Co. Ltd. - Segment focus
- Exhibits120: Shell plc - Overview
- Exhibits121: Shell plc - Business segments
- Exhibits122: Shell plc - Key news
- Exhibits123: Shell plc - Key offerings
- Exhibits124: Shell plc - Segment focus
- Exhibits125: SOLARWATT GmbH - Overview
- Exhibits126: SOLARWATT GmbH - Product / Service
- Exhibits127: SOLARWATT GmbH - Key offerings
- Exhibits128: Sony Group Corp. - Overview
- Exhibits129: Sony Group Corp. - Business segments
- Exhibits130: Sony Group Corp. - Key offerings
- Exhibits131: Sony Group Corp. - Segment focus
- Exhibits132: TotalEnergies SE - Overview
- Exhibits133: TotalEnergies SE - Business segments
- Exhibits134: TotalEnergies SE - Key news
- Exhibits135: TotalEnergies SE - Key offerings
- Exhibits136: TotalEnergies SE - Segment focus
- Exhibits137: Inclusions checklist
- Exhibits138: Exclusions checklist
- Exhibits139: Currency conversion rates for US$
- Exhibits140: Research methodology
- Exhibits141: Information sources
- Exhibits142: Data validation
- Exhibits143: Validation techniques employed for market sizing
- Exhibits144: Data synthesis
- Exhibits145: 360 degree market analysis
- Exhibits146: List of abbreviations
Residential Solar Energy Storage Market 2024-2028
The residential solar energy storage market is forecasted to grow by USD 113554.2 mn during 2023-2028, accelerating at a CAGR of 52.6% during the forecast period. The report on the residential solar energy storage market provides a holistic analysis, market size and forecast, trends, growth drivers, and challenges, as well as vendor analysis covering around 25 vendors.
The report offers an up-to-date analysis regarding the current market scenario, the latest trends and drivers, and the overall market environment. The market is driven by reduction in pv and energy storage system costs, increasing self-consumption and availability of incentives, and rising energy costs.
| Market Scope | |
|---|---|
| Base Year | 2024 |
| End Year | 2028 |
| Series Year | 2024-2028 |
| Growth Momentum | Accelerate |
| YOY 2024 | 40.2% |
| CAGR | 52.6% |
| Incremental Value | $113554.2 mn |
Technavio's residential solar energy storage market is segmented as below:
By Technology
- Li-ion batteries
- Lead acid batteries
By Geographical Landscape
- APAC
- North America
- Europe
- South America
- Middle East and Africa
This study identifies the residential energy storage as virtual power plants as one of the prime reasons driving the residential solar energy storage market growth during the next few years. Also, market attracting new vendors and increased green construction spending and zero-energy homes will lead to sizable demand in the market.
The report on the residential solar energy storage market covers the following areas:
- Residential Solar Energy Storage Market sizing
- Residential Solar Energy Storage Market forecast
- Residential Solar Energy Storage Market industry analysis
The robust vendor analysis is designed to help clients improve their market position, and in line with this, this report provides a detailed analysis of several leading residential solar energy storage market vendors that include ABB, ACME Cleantech Solutions Pvt. Ltd., Adara Power, E.ON UK Plc, E3 DC, East Penn Manufacturing Co. Inc., Enphase Energy Inc., Invinity Energy Systems plc, LG Electronics Inc., Mercedes Benz Group AG, Panasonic Holdings Corp., Samsung SDI Co. Ltd., Shell plc, SOLARWATT GmbH, Sony Group Corp., Tesla Inc., The BYD Motors Inc., TotalEnergies SE, Trojan Battery Co. LLC, and Wanxiang New Energy LLC. Also, the residential solar energy storage market analysis report includes information on upcoming trends and challenges that will influence market growth. This is to help companies strategize and leverage all forthcoming growth opportunities.
The study was conducted using an objective combination of primary and secondary information including inputs from key participants in the industry. The report contains a comprehensive market and vendor landscape in addition to an analysis of the key vendors.
The publisher presents a detailed picture of the market by the way of study, synthesis, and summation of data from multiple sources by an analysis of key parameters such as profit, pricing, competition, and promotions. It presents various market facets by identifying the key industry influencers. The data presented is comprehensive, reliable, and a result of extensive primary and secondary research. The market research reports provide a complete competitive landscape and an in-depth vendor selection methodology and analysis using qualitative and quantitative research to forecast accurate market growth.
Table of Contents
1 Executive Summary
- 1.1 Market overview
- Executive Summary - Chart on Market Overview
- Executive Summary - Data Table on Market Overview
- Executive Summary - Chart on Global Market Characteristics
- Executive Summary - Chart on Market By Geographical Landscape
- Executive Summary - Chart on Market Segmentation by Technology
- Executive Summary - Chart on Incremental Growth
- Executive Summary - Data Table on Incremental Growth
- Executive Summary - Chart on Company Market Positioning
2 Market Landscape
- 2.1 Market ecosystem
- Parent Market
- Data Table on - Parent Market
- 2.2 Market characteristics
- Market characteristics analysis
- 2.3 Value chain analysis
- Value Chain Analysis
3 Market Sizing
- 3.1 Market definition
- Offerings of companies included in the market definition
- 3.2 Market segment analysis
- Market segments
- 3.3 Market size 2023
- 3.4 Market outlook: Forecast for 2023-2028
- Chart on Global - Market size and forecast 2023-2028 ($ million)
- Data Table on Global - Market size and forecast 2023-2028 ($ million)
- Chart on Global Market: Year-over-year growth 2023-2028 (%)
- Data Table on Global Market: Year-over-year growth 2023-2028 (%)
4 Historic Market Size
- 4.1 Global Residential Solar Energy Storage Market 2018 - 2022
- Historic Market Size - Data Table on Global Residential Solar Energy Storage Market 2018 - 2022 ($ million)
- 4.2 Technology segment analysis 2018 - 2022
- Historic Market Size - Technology Segment 2018 - 2022 ($ million)
- 4.3 Geography segment analysis 2018 - 2022
- Historic Market Size - Geography Segment 2018 - 2022 ($ million)
- 4.4 Country segment analysis 2018 - 2022
- Historic Market Size - Country Segment 2018 - 2022 ($ million)
5 Five Forces Analysis
- 5.1 Five forces summary
- Five forces analysis - Comparison between 2023 and 2028
- 5.2 Bargaining power of buyers
- Bargaining power of buyers - Impact of key factors 2023 and 2028
- 5.3 Bargaining power of suppliers
- Bargaining power of suppliers - Impact of key factors in 2023 and 2028
- 5.4 Threat of new entrants
- Threat of new entrants - Impact of key factors in 2023 and 2028
- 5.5 Threat of substitutes
- Threat of substitutes - Impact of key factors in 2023 and 2028
- 5.6 Threat of rivalry
- Threat of rivalry - Impact of key factors in 2023 and 2028
- 5.7 Market condition
- Chart on Market condition - Five forces 2023 and 2028
6 Market Segmentation by Technology
- 6.1 Market segments
- Chart on Technology - Market share 2023-2028 (%)
- Data Table on Technology - Market share 2023-2028 (%)
- 6.2 Comparison by Technology
- Chart on Comparison by Technology
- Data Table on Comparison by Technology
- 6.3 Li-ion batteries - Market size and forecast 2023-2028
- Chart on Li-ion batteries - Market size and forecast 2023-2028 ($ million)
- Data Table on Li-ion batteries - Market size and forecast 2023-2028 ($ million)
- Chart on Li-ion batteries - Year-over-year growth 2023-2028 (%)
- Data Table on Li-ion batteries - Year-over-year growth 2023-2028 (%)
- 6.4 Lead acid batteries - Market size and forecast 2023-2028
- Chart on Lead acid batteries - Market size and forecast 2023-2028 ($ million)
- Data Table on Lead acid batteries - Market size and forecast 2023-2028 ($ million)
- Chart on Lead acid batteries - Year-over-year growth 2023-2028 (%)
- Data Table on Lead acid batteries - Year-over-year growth 2023-2028 (%)
- 6.5 Market opportunity by Technology
- Market opportunity by Technology ($ million)
- Data Table on Market opportunity by Technology ($ million)
7 Customer Landscape
- 7.1 Customer landscape overview
- Analysis of price sensitivity, lifecycle, customer purchase basket, adoption rates, and purchase criteria
8 Geographic Landscape
- 8.1 Geographic segmentation
- Chart on Market share By Geographical Landscape 2023-2028 (%)
- Data Table on Market share By Geographical Landscape 2023-2028 (%)
- 8.2 Geographic comparison
- Chart on Geographic comparison
- Data Table on Geographic comparison
- 8.3 APAC - Market size and forecast 2023-2028
- Chart on APAC - Market size and forecast 2023-2028 ($ million)
- Data Table on APAC - Market size and forecast 2023-2028 ($ million)
- Chart on APAC - Year-over-year growth 2023-2028 (%)
- Data Table on APAC - Year-over-year growth 2023-2028 (%)
- 8.4 North America - Market size and forecast 2023-2028
- Chart on North America - Market size and forecast 2023-2028 ($ million)
- Data Table on North America - Market size and forecast 2023-2028 ($ million)
- Chart on North America - Year-over-year growth 2023-2028 (%)
- Data Table on North America - Year-over-year growth 2023-2028 (%)
- 8.5 Europe - Market size and forecast 2023-2028
- Chart on Europe - Market size and forecast 2023-2028 ($ million)
- Data Table on Europe - Market size and forecast 2023-2028 ($ million)
- Chart on Europe - Year-over-year growth 2023-2028 (%)
- Data Table on Europe - Year-over-year growth 2023-2028 (%)
- 8.6 South America - Market size and forecast 2023-2028
- Chart on South America - Market size and forecast 2023-2028 ($ million)
- Data Table on South America - Market size and forecast 2023-2028 ($ million)
- Chart on South America - Year-over-year growth 2023-2028 (%)
- Data Table on South America - Year-over-year growth 2023-2028 (%)
- 8.7 Middle East and Africa - Market size and forecast 2023-2028
- Chart on Middle East and Africa - Market size and forecast 2023-2028 ($ million)
- Data Table on Middle East and Africa - Market size and forecast 2023-2028 ($ million)
- Chart on Middle East and Africa - Year-over-year growth 2023-2028 (%)
- Data Table on Middle East and Africa - Year-over-year growth 2023-2028 (%)
- 8.8 China - Market size and forecast 2023-2028
- Chart on China - Market size and forecast 2023-2028 ($ million)
- Data Table on China - Market size and forecast 2023-2028 ($ million)
- Chart on China - Year-over-year growth 2023-2028 (%)
- Data Table on China - Year-over-year growth 2023-2028 (%)
- 8.9 US - Market size and forecast 2023-2028
- Chart on US - Market size and forecast 2023-2028 ($ million)
- Data Table on US - Market size and forecast 2023-2028 ($ million)
- Chart on US - Year-over-year growth 2023-2028 (%)
- Data Table on US - Year-over-year growth 2023-2028 (%)
- 8.10 Japan - Market size and forecast 2023-2028
- Chart on Japan - Market size and forecast 2023-2028 ($ million)
- Data Table on Japan - Market size and forecast 2023-2028 ($ million)
- Chart on Japan - Year-over-year growth 2023-2028 (%)
- Data Table on Japan - Year-over-year growth 2023-2028 (%)
- 8.11 Canada - Market size and forecast 2023-2028
- Chart on Canada - Market size and forecast 2023-2028 ($ million)
- Data Table on Canada - Market size and forecast 2023-2028 ($ million)
- Chart on Canada - Year-over-year growth 2023-2028 (%)
- Data Table on Canada - Year-over-year growth 2023-2028 (%)
- 8.12 Germany - Market size and forecast 2023-2028
- Chart on Germany - Market size and forecast 2023-2028 ($ million)
- Data Table on Germany - Market size and forecast 2023-2028 ($ million)
- Chart on Germany - Year-over-year growth 2023-2028 (%)
- Data Table on Germany - Year-over-year growth 2023-2028 (%)
- 8.13 Market opportunity By Geographical Landscape
- Market opportunity By Geographical Landscape ($ million)
- Data Tables on Market opportunity By Geographical Landscape ($ million)
9 Drivers, Challenges, and Opportunity/Restraints
- 9.1 Market drivers
- 9.2 Market challenges
- 9.3 Impact of drivers and challenges
- Impact of drivers and challenges in 2023 and 2028
- 9.4 Market opportunities/restraints
10 Competitive Landscape
- 10.1 Overview
- 10.2 Competitive Landscape
- Overview on criticality of inputs and factors of differentiation
- 10.3 Landscape disruption
- Overview on factors of disruption
- 10.4 Industry risks
- Impact of key risks on business
11 Competitive Analysis
- 11.1 Companies profiled
- Companies covered
- 11.2 Market positioning of companies
- Matrix on companies position and classification
- 11.3 East Penn Manufacturing Co. Inc.
- East Penn Manufacturing Co. Inc. - Overview
- East Penn Manufacturing Co. Inc. - Product / Service
- East Penn Manufacturing Co. Inc. - Key news
- East Penn Manufacturing Co. Inc. - Key offerings
- 11.4 Enphase Energy Inc.
- Enphase Energy Inc. - Overview
- Enphase Energy Inc. - Product / Service
- Enphase Energy Inc. - Key news
- Enphase Energy Inc. - Key offerings
- 11.5 Invinity Energy Systems plc
- Invinity Energy Systems plc - Overview
- Invinity Energy Systems plc - Product / Service
- Invinity Energy Systems plc - Key offerings
- 11.6 LG Electronics Inc.
- LG Electronics Inc. - Overview
- LG Electronics Inc. - Product / Service
- LG Electronics Inc. - Key offerings
- 11.7 Panasonic Holdings Corp.
- Panasonic Holdings Corp. - Overview
- Panasonic Holdings Corp. - Business segments
- Panasonic Holdings Corp. - Key news
- Panasonic Holdings Corp. - Key offerings
- Panasonic Holdings Corp. - Segment focus
- 11.8 Samsung SDI Co. Ltd.
- Samsung SDI Co. Ltd. - Overview
- Samsung SDI Co. Ltd. - Business segments
- Samsung SDI Co. Ltd. - Key offerings
- Samsung SDI Co. Ltd. - Segment focus
- 11.9 Shell plc
- Shell plc - Overview
- Shell plc - Business segments
- Shell plc - Key news
- Shell plc - Key offerings
- Shell plc - Segment focus
- 11.10 SOLARWATT GmbH
- SOLARWATT GmbH - Overview
- SOLARWATT GmbH - Product / Service
- SOLARWATT GmbH - Key offerings
- 11.11 Sony Group Corp.
- Sony Group Corp. - Overview
- Sony Group Corp. - Business segments
- Sony Group Corp. - Key offerings
- Sony Group Corp. - Segment focus
- 11.12 TotalEnergies SE
- TotalEnergies SE - Overview
- TotalEnergies SE - Business segments
- TotalEnergies SE - Key news
- TotalEnergies SE - Key offerings
- TotalEnergies SE - Segment focus
12 Appendix
- 12.1 Scope of the report
- 12.2 Inclusions and exclusions checklist
- Inclusions checklist
- Exclusions checklist
- 12.3 Currency conversion rates for US$
- Currency conversion rates for US$
- 12.4 Research methodology
- Research methodology
- 12.5 Data procurement
- Information sources
- 12.6 Data validation
- Data validation
- 12.7 Validation techniques employed for market sizing
- Validation techniques employed for market sizing
- 12.8 Data synthesis
- Data synthesis
- 12.9 360 degree market analysis
- 360 degree market analysis
- 12.10 List of abbreviations
- List of abbreviations
