|
|
市場調査レポート
商品コード
1580775
フェノールの世界市場 (2024~2028年)Global Phenol Market 2024-2028 |
||||||

|
|||||||
カスタマイズ可能
|
|||||||

| フェノールの世界市場 (2024~2028年) |
|
出版日: 2024年10月16日
発行: TechNavio
ページ情報: 英文 158 Pages
納期: 即納可能
|

全表示
- 概要
- 図表
- 目次
フェノール市場 (2024~2028年)
フェノール市場は2023~2028年に43億170万米ドル拡大し、予測期間中のCAGRは3.3%で成長すると予測されます。当レポートでは、フェノール市場の全体的な分析、市場規模・予測、動向、成長促進要因、課題、約25のベンダーを網羅したベンダー分析などを掲載しています。
現在の市場シナリオ、最新動向と促進要因、市場環境全体に関する最新分析を提供しています。市場は、様々な分野でのフェノールの利用増加、新興国でのフェノール需要の増加、世界の風力エネルギー市場の急速な進歩によって牽引されています。
| 市場範囲 | |
|---|---|
| 基準年 | 2024年 |
| 終了年 | 2028年 |
| 予測期間 | 2024~2028年 |
| 成長モメンタム | 加速 |
| 前年比 (2024年) | 3.1% |
| CAGR | 3.3% |
| 増分額 | 43億170万米ドル |
当レポートでは、今後数年間におけるフェノール市場の成長を促進する主な理由の一つとして、EUによる特定のフェノールベースの玩具に対する規制を挙げています。また、代替製造プロセスの出現と原油価格の変動は、市場の大きな需要につながります。
目次
第1章 エグゼクティブサマリー
- 市場概要
第2章 市場情勢
- 市場エコシステム
- 市場の特徴
- バリューチェーン分析
第3章 市場規模の評価
- 市場の定義
- 市場セグメント分析
- 市場規模 (2023年)
- 市場の見通し (2023~2028年)
第4章 市場規模実績
- フェノールの世界市場 (2018~2022年)
- 誘導体の種類別の分析 (2018~2022年)
- 地域別の分析 (2018~2022年)
- 国別の分析 (2018~2022年)
第5章 ファイブフォース分析
- ファイブフォースの要約
- 買い手の交渉力
- 供給企業の交渉力
- 新規参入業者の脅威
- 代替品の脅威
- 競争の脅威
- 市況
第6章 市場区分:誘導体の種類別
- 市場セグメンテーション
- 比較:誘導体の種類別
- ビスフェノールA:市場規模と予測 (2023~2028年)
- フェノール樹脂:市場規模と予測 (2023~2028年)
- ナイロンKAオイル:市場規模と予測 (2023~2028年)
- その他:市場規模と予測 (2023~2028年)
- 誘導体の種類別の市場機会
第7章 顧客情勢
- 顧客情勢の概要
第8章 地域別情勢
- 地域別の内訳
- 地域別の比較
- アジア太平洋:市場規模と予測 (2023~2028年)
- 欧州:市場規模と予測 (2023~2028年)
- 北米:市場規模と予測 (2023~2028年)
- 南米:市場規模と予測 (2023~2028年)
- 中東・アフリカ:市場規模と予測 (2023~2028年)
- 中国:市場規模と予測 (2023~2028年)
- 米国:市場規模と予測 (2023~2028年)
- 台湾:市場規模と予測 (2023~2028年)
- 韓国:市場規模と予測 (2023~2028年)
- ドイツ:市場規模と予測 (2023~2028年)
- 地域情勢別の市場機会
第9章 促進要因・課題・機会・抑制要因
- 市場の促進要因
- 市場の課題
- 促進要因と課題の影響
- 市場機会と抑制要因
第10章 競合情勢
- 概要
- 競合情勢
- 情勢の混乱
- 業界のリスク
第11章 競合分析
- 企業プロファイル
- 企業の市場ポジショニング
- Compania Espanola de Petroleos SA
- Covestro AG
- Honeywell International Inc.
- INEOS Group Holdings S.A.
- Kumho Petrochemical Co. Ltd.
- Mitsubishi Chemical Group Corp.
- Mitsui Chemicals Inc.
- PTT Global Chemical Public Co. Ltd.
- Shell plc
- Solvay SA
第12章 付録
Exhibits:
- Exhibits1: Executive Summary - Chart on Market Overview
- Exhibits2: Executive Summary - Data Table on Market Overview
- Exhibits3: Executive Summary - Chart on Global Market Characteristics
- Exhibits4: Executive Summary - Chart on Market By Geographical Landscape
- Exhibits5: Executive Summary - Chart on Market Segmentation by Derivative Type
- Exhibits6: Executive Summary - Chart on Incremental Growth
- Exhibits7: Executive Summary - Data Table on Incremental Growth
- Exhibits8: Executive Summary - Chart on Company Market Positioning
- Exhibits9: Parent Market
- Exhibits10: Data Table on - Parent Market
- Exhibits11: Market characteristics analysis
- Exhibits12: Value Chain Analysis
- Exhibits13: Offerings of companies included in the market definition
- Exhibits14: Market segments
- Exhibits15: Chart on Global - Market size and forecast 2023-2028 ($ million)
- Exhibits16: Data Table on Global - Market size and forecast 2023-2028 ($ million)
- Exhibits17: Chart on Global Market: Year-over-year growth 2023-2028 (%)
- Exhibits18: Data Table on Global Market: Year-over-year growth 2023-2028 (%)
- Exhibits19: Historic Market Size - Data Table on Global Phenol Market 2018 - 2022 ($ million)
- Exhibits20: Historic Market Size - Derivative Type Segment 2018 - 2022 ($ million)
- Exhibits21: Historic Market Size - Geography Segment 2018 - 2022 ($ million)
- Exhibits22: Historic Market Size - Country Segment 2018 - 2022 ($ million)
- Exhibits23: Five forces analysis - Comparison between 2023 and 2028
- Exhibits24: Bargaining power of buyers - Impact of key factors 2023 and 2028
- Exhibits25: Bargaining power of suppliers - Impact of key factors in 2023 and 2028
- Exhibits26: Threat of new entrants - Impact of key factors in 2023 and 2028
- Exhibits27: Threat of substitutes - Impact of key factors in 2023 and 2028
- Exhibits28: Threat of rivalry - Impact of key factors in 2023 and 2028
- Exhibits29: Chart on Market condition - Five forces 2023 and 2028
- Exhibits30: Chart on Derivative Type - Market share 2023-2028 (%)
- Exhibits31: Data Table on Derivative Type - Market share 2023-2028 (%)
- Exhibits32: Chart on Comparison by Derivative Type
- Exhibits33: Data Table on Comparison by Derivative Type
- Exhibits34: Chart on BPA - Market size and forecast 2023-2028 ($ million)
- Exhibits35: Data Table on BPA - Market size and forecast 2023-2028 ($ million)
- Exhibits36: Chart on BPA - Year-over-year growth 2023-2028 (%)
- Exhibits37: Data Table on BPA - Year-over-year growth 2023-2028 (%)
- Exhibits38: Chart on Phenolic resins - Market size and forecast 2023-2028 ($ million)
- Exhibits39: Data Table on Phenolic resins - Market size and forecast 2023-2028 ($ million)
- Exhibits40: Chart on Phenolic resins - Year-over-year growth 2023-2028 (%)
- Exhibits41: Data Table on Phenolic resins - Year-over-year growth 2023-2028 (%)
- Exhibits42: Chart on Nylon-KA oil - Market size and forecast 2023-2028 ($ million)
- Exhibits43: Data Table on Nylon-KA oil - Market size and forecast 2023-2028 ($ million)
- Exhibits44: Chart on Nylon-KA oil - Year-over-year growth 2023-2028 (%)
- Exhibits45: Data Table on Nylon-KA oil - Year-over-year growth 2023-2028 (%)
- Exhibits46: Chart on Others - Market size and forecast 2023-2028 ($ million)
- Exhibits47: Data Table on Others - Market size and forecast 2023-2028 ($ million)
- Exhibits48: Chart on Others - Year-over-year growth 2023-2028 (%)
- Exhibits49: Data Table on Others - Year-over-year growth 2023-2028 (%)
- Exhibits50: Market opportunity by Derivative Type ($ million)
- Exhibits51: Data Table on Market opportunity by Derivative Type ($ million)
- Exhibits52: Analysis of price sensitivity, lifecycle, customer purchase basket, adoption rates, and purchase criteria
- Exhibits53: Chart on Market share By Geographical Landscape 2023-2028 (%)
- Exhibits54: Data Table on Market share By Geographical Landscape 2023-2028 (%)
- Exhibits55: Chart on Geographic comparison
- Exhibits56: Data Table on Geographic comparison
- Exhibits57: Chart on APAC - Market size and forecast 2023-2028 ($ million)
- Exhibits58: Data Table on APAC - Market size and forecast 2023-2028 ($ million)
- Exhibits59: Chart on APAC - Year-over-year growth 2023-2028 (%)
- Exhibits60: Data Table on APAC - Year-over-year growth 2023-2028 (%)
- Exhibits61: Chart on Europe - Market size and forecast 2023-2028 ($ million)
- Exhibits62: Data Table on Europe - Market size and forecast 2023-2028 ($ million)
- Exhibits63: Chart on Europe - Year-over-year growth 2023-2028 (%)
- Exhibits64: Data Table on Europe - Year-over-year growth 2023-2028 (%)
- Exhibits65: Chart on North America - Market size and forecast 2023-2028 ($ million)
- Exhibits66: Data Table on North America - Market size and forecast 2023-2028 ($ million)
- Exhibits67: Chart on North America - Year-over-year growth 2023-2028 (%)
- Exhibits68: Data Table on North America - Year-over-year growth 2023-2028 (%)
- Exhibits69: Chart on South America - Market size and forecast 2023-2028 ($ million)
- Exhibits70: Data Table on South America - Market size and forecast 2023-2028 ($ million)
- Exhibits71: Chart on South America - Year-over-year growth 2023-2028 (%)
- Exhibits72: Data Table on South America - Year-over-year growth 2023-2028 (%)
- Exhibits73: Chart on Middle East and Africa - Market size and forecast 2023-2028 ($ million)
- Exhibits74: Data Table on Middle East and Africa - Market size and forecast 2023-2028 ($ million)
- Exhibits75: Chart on Middle East and Africa - Year-over-year growth 2023-2028 (%)
- Exhibits76: Data Table on Middle East and Africa - Year-over-year growth 2023-2028 (%)
- Exhibits77: Chart on China - Market size and forecast 2023-2028 ($ million)
- Exhibits78: Data Table on China - Market size and forecast 2023-2028 ($ million)
- Exhibits79: Chart on China - Year-over-year growth 2023-2028 (%)
- Exhibits80: Data Table on China - Year-over-year growth 2023-2028 (%)
- Exhibits81: Chart on US - Market size and forecast 2023-2028 ($ million)
- Exhibits82: Data Table on US - Market size and forecast 2023-2028 ($ million)
- Exhibits83: Chart on US - Year-over-year growth 2023-2028 (%)
- Exhibits84: Data Table on US - Year-over-year growth 2023-2028 (%)
- Exhibits85: Chart on Taiwan - Market size and forecast 2023-2028 ($ million)
- Exhibits86: Data Table on Taiwan - Market size and forecast 2023-2028 ($ million)
- Exhibits87: Chart on Taiwan - Year-over-year growth 2023-2028 (%)
- Exhibits88: Data Table on Taiwan - Year-over-year growth 2023-2028 (%)
- Exhibits89: Chart on South Korea - Market size and forecast 2023-2028 ($ million)
- Exhibits90: Data Table on South Korea - Market size and forecast 2023-2028 ($ million)
- Exhibits91: Chart on South Korea - Year-over-year growth 2023-2028 (%)
- Exhibits92: Data Table on South Korea - Year-over-year growth 2023-2028 (%)
- Exhibits93: Chart on Germany - Market size and forecast 2023-2028 ($ million)
- Exhibits94: Data Table on Germany - Market size and forecast 2023-2028 ($ million)
- Exhibits95: Chart on Germany - Year-over-year growth 2023-2028 (%)
- Exhibits96: Data Table on Germany - Year-over-year growth 2023-2028 (%)
- Exhibits97: Market opportunity By Geographical Landscape ($ million)
- Exhibits98: Data Tables on Market opportunity By Geographical Landscape ($ million)
- Exhibits99: Impact of drivers and challenges in 2023 and 2028
- Exhibits100: Overview on criticality of inputs and factors of differentiation
- Exhibits101: Overview on factors of disruption
- Exhibits102: Impact of key risks on business
- Exhibits103: Companies covered
- Exhibits104: Matrix on companies position and classification
- Exhibits105: Compania Espanola de Petroleos SA - Overview
- Exhibits106: Compania Espanola de Petroleos SA - Business segments
- Exhibits107: Compania Espanola de Petroleos SA - Key offerings
- Exhibits108: Compania Espanola de Petroleos SA - Segment focus
- Exhibits109: Covestro AG - Overview
- Exhibits110: Covestro AG - Business segments
- Exhibits111: Covestro AG - Key news
- Exhibits112: Covestro AG - Key offerings
- Exhibits113: Covestro AG - Segment focus
- Exhibits114: Honeywell International Inc. - Overview
- Exhibits115: Honeywell International Inc. - Business segments
- Exhibits116: Honeywell International Inc. - Key news
- Exhibits117: Honeywell International Inc. - Key offerings
- Exhibits118: Honeywell International Inc. - Segment focus
- Exhibits119: INEOS Group Holdings S.A. - Overview
- Exhibits120: INEOS Group Holdings S.A. - Product / Service
- Exhibits121: INEOS Group Holdings S.A. - Key news
- Exhibits122: INEOS Group Holdings S.A. - Key offerings
- Exhibits123: Kumho Petrochemical Co. Ltd. - Overview
- Exhibits124: Kumho Petrochemical Co. Ltd. - Product / Service
- Exhibits125: Kumho Petrochemical Co. Ltd. - Key news
- Exhibits126: Kumho Petrochemical Co. Ltd. - Key offerings
- Exhibits127: Mitsubishi Chemical Group Corp. - Overview
- Exhibits128: Mitsubishi Chemical Group Corp. - Business segments
- Exhibits129: Mitsubishi Chemical Group Corp. - Key news
- Exhibits130: Mitsubishi Chemical Group Corp. - Key offerings
- Exhibits131: Mitsubishi Chemical Group Corp. - Segment focus
- Exhibits132: Mitsui Chemicals Inc. - Overview
- Exhibits133: Mitsui Chemicals Inc. - Business segments
- Exhibits134: Mitsui Chemicals Inc. - Key offerings
- Exhibits135: Mitsui Chemicals Inc. - Segment focus
- Exhibits136: PTT Global Chemical Public Co. Ltd. - Overview
- Exhibits137: PTT Global Chemical Public Co. Ltd. - Business segments
- Exhibits138: PTT Global Chemical Public Co. Ltd. - Key offerings
- Exhibits139: PTT Global Chemical Public Co. Ltd. - Segment focus
- Exhibits140: Shell plc - Overview
- Exhibits141: Shell plc - Business segments
- Exhibits142: Shell plc - Key news
- Exhibits143: Shell plc - Key offerings
- Exhibits144: Shell plc - Segment focus
- Exhibits145: Solvay SA - Overview
- Exhibits146: Solvay SA - Business segments
- Exhibits147: Solvay SA - Key news
- Exhibits148: Solvay SA - Key offerings
- Exhibits149: Solvay SA - Segment focus
- Exhibits150: Inclusions checklist
- Exhibits151: Exclusions checklist
- Exhibits152: Currency conversion rates for US$
- Exhibits153: Research methodology
- Exhibits154: Information sources
- Exhibits155: Data validation
- Exhibits156: Validation techniques employed for market sizing
- Exhibits157: Data synthesis
- Exhibits158: 360 degree market analysis
- Exhibits159: List of abbreviations
Phenol Market 2024-2028
The phenol market is forecasted to grow by USD 4301.7 mn during 2023-2028, accelerating at a CAGR of 3.3% during the forecast period. The report on the phenol market provides a holistic analysis, market size and forecast, trends, growth drivers, and challenges, as well as vendor analysis covering around 25 vendors.
The report offers an up-to-date analysis regarding the current market scenario, the latest trends and drivers, and the overall market environment. The market is driven by increasing application of phenol across various sectors, increasing demand for phenol from developing economies, and rapid advances in global wind energy market.
| Market Scope | |
|---|---|
| Base Year | 2024 |
| End Year | 2028 |
| Series Year | 2024-2028 |
| Growth Momentum | Accelerate |
| YOY 2024 | 3.1% |
| CAGR | 3.3% |
| Incremental Value | $4301.7 mn |
Technavio's phenol market is segmented as below:
By Derivative Type
- BPA
- Phenolic resins
- Nylon-KA oil
- Others
By Geographical Landscape
- APAC
- Europe
- North America
- South America
- Middle East and Africa
This study identifies the restrictions on specific phenol-based toys by eu as one of the prime reasons driving the phenol market growth during the next few years. Also, emergence of alternative manufacturing process and fluctuating crude oil prices will lead to sizable demand in the market.
The report on the phenol market covers the following areas:
- Phenol Market sizing
- Phenol Market forecast
- Phenol Market industry analysis
The robust vendor analysis is designed to help clients improve their market position, and in line with this, this report provides a detailed analysis of several leading phenol market vendors that include Aditya Birla Management Corp. Pvt. Ltd., AdvanSix Inc., ALTIVIA, Compania Espanola de Petroleos SA, Covestro AG, Deepak Nitrite Ltd., Domo Chemicals GmbH, Dow Inc., Essential Industries Inc, Formosa Chemicals and Fibre Corp., Honeywell International Inc., INEOS Group Holdings S.A., Jinan Shengquan Group Share Holding Co Ltd, Kumho Petrochemical Co. Ltd., LG Chem Ltd., Mitsubishi Chemical Group Corp., Mitsui Chemicals Inc., PTT Global Chemical Public Co. Ltd., Shell plc, and Solvay SA. Also, the phenol market analysis report includes information on upcoming trends and challenges that will influence market growth. This is to help companies strategize and leverage all forthcoming growth opportunities.
The study was conducted using an objective combination of primary and secondary information including inputs from key participants in the industry. The report contains a comprehensive market and vendor landscape in addition to an analysis of the key vendors.
The publisher presents a detailed picture of the market by the way of study, synthesis, and summation of data from multiple sources by an analysis of key parameters such as profit, pricing, competition, and promotions. It presents various market facets by identifying the key industry influencers. The data presented is comprehensive, reliable, and a result of extensive primary and secondary research. The market research reports provide a complete competitive landscape and an in-depth vendor selection methodology and analysis using qualitative and quantitative research to forecast accurate market growth.
Table of Contents
1 Executive Summary
- 1.1 Market overview
- Executive Summary - Chart on Market Overview
- Executive Summary - Data Table on Market Overview
- Executive Summary - Chart on Global Market Characteristics
- Executive Summary - Chart on Market By Geographical Landscape
- Executive Summary - Chart on Market Segmentation by Derivative Type
- Executive Summary - Chart on Incremental Growth
- Executive Summary - Data Table on Incremental Growth
- Executive Summary - Chart on Company Market Positioning
2 Market Landscape
- 2.1 Market ecosystem
- Parent Market
- Data Table on - Parent Market
- 2.2 Market characteristics
- Market characteristics analysis
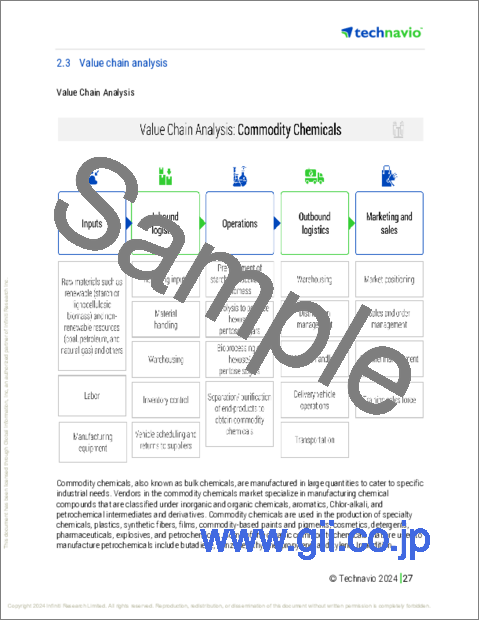
- 2.3 Value chain analysis
- Value Chain Analysis
3 Market Sizing
- 3.1 Market definition
- Offerings of companies included in the market definition
- 3.2 Market segment analysis
- Market segments
- 3.3 Market size 2023
- 3.4 Market outlook: Forecast for 2023-2028
- Chart on Global - Market size and forecast 2023-2028 ($ million)
- Data Table on Global - Market size and forecast 2023-2028 ($ million)
- Chart on Global Market: Year-over-year growth 2023-2028 (%)
- Data Table on Global Market: Year-over-year growth 2023-2028 (%)
4 Historic Market Size
- 4.1 Global Phenol Market 2018 - 2022
- Historic Market Size - Data Table on Global Phenol Market 2018 - 2022 ($ million)
- 4.2 Derivative Type segment analysis 2018 - 2022
- Historic Market Size - Derivative Type Segment 2018 - 2022 ($ million)
- 4.3 Geography segment analysis 2018 - 2022
- Historic Market Size - Geography Segment 2018 - 2022 ($ million)
- 4.4 Country segment analysis 2018 - 2022
- Historic Market Size - Country Segment 2018 - 2022 ($ million)
5 Five Forces Analysis
- 5.1 Five forces summary
- Five forces analysis - Comparison between 2023 and 2028
- 5.2 Bargaining power of buyers
- Bargaining power of buyers - Impact of key factors 2023 and 2028
- 5.3 Bargaining power of suppliers
- Bargaining power of suppliers - Impact of key factors in 2023 and 2028
- 5.4 Threat of new entrants
- Threat of new entrants - Impact of key factors in 2023 and 2028
- 5.5 Threat of substitutes
- Threat of substitutes - Impact of key factors in 2023 and 2028
- 5.6 Threat of rivalry
- Threat of rivalry - Impact of key factors in 2023 and 2028
- 5.7 Market condition
- Chart on Market condition - Five forces 2023 and 2028
6 Market Segmentation by Derivative Type
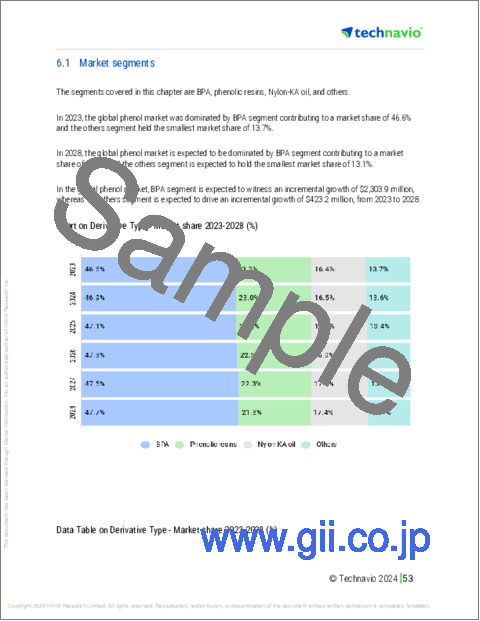
- 6.1 Market segments
- Chart on Derivative Type - Market share 2023-2028 (%)
- Data Table on Derivative Type - Market share 2023-2028 (%)
- 6.2 Comparison by Derivative Type
- Chart on Comparison by Derivative Type
- Data Table on Comparison by Derivative Type
- 6.3 BPA - Market size and forecast 2023-2028
- Chart on BPA - Market size and forecast 2023-2028 ($ million)
- Data Table on BPA - Market size and forecast 2023-2028 ($ million)
- Chart on BPA - Year-over-year growth 2023-2028 (%)
- Data Table on BPA - Year-over-year growth 2023-2028 (%)
- 6.4 Phenolic resins - Market size and forecast 2023-2028
- Chart on Phenolic resins - Market size and forecast 2023-2028 ($ million)
- Data Table on Phenolic resins - Market size and forecast 2023-2028 ($ million)
- Chart on Phenolic resins - Year-over-year growth 2023-2028 (%)
- Data Table on Phenolic resins - Year-over-year growth 2023-2028 (%)
- 6.5 Nylon-KA oil - Market size and forecast 2023-2028
- Chart on Nylon-KA oil - Market size and forecast 2023-2028 ($ million)
- Data Table on Nylon-KA oil - Market size and forecast 2023-2028 ($ million)
- Chart on Nylon-KA oil - Year-over-year growth 2023-2028 (%)
- Data Table on Nylon-KA oil - Year-over-year growth 2023-2028 (%)
- 6.6 Others - Market size and forecast 2023-2028
- Chart on Others - Market size and forecast 2023-2028 ($ million)
- Data Table on Others - Market size and forecast 2023-2028 ($ million)
- Chart on Others - Year-over-year growth 2023-2028 (%)
- Data Table on Others - Year-over-year growth 2023-2028 (%)
- 6.7 Market opportunity by Derivative Type
- Market opportunity by Derivative Type ($ million)
- Data Table on Market opportunity by Derivative Type ($ million)
7 Customer Landscape
- 7.1 Customer landscape overview
- Analysis of price sensitivity, lifecycle, customer purchase basket, adoption rates, and purchase criteria
8 Geographic Landscape
- 8.1 Geographic segmentation
- Chart on Market share By Geographical Landscape 2023-2028 (%)
- Data Table on Market share By Geographical Landscape 2023-2028 (%)
- 8.2 Geographic comparison
- Chart on Geographic comparison
- Data Table on Geographic comparison
- 8.3 APAC - Market size and forecast 2023-2028
- Chart on APAC - Market size and forecast 2023-2028 ($ million)
- Data Table on APAC - Market size and forecast 2023-2028 ($ million)
- Chart on APAC - Year-over-year growth 2023-2028 (%)
- Data Table on APAC - Year-over-year growth 2023-2028 (%)
- 8.4 Europe - Market size and forecast 2023-2028
- Chart on Europe - Market size and forecast 2023-2028 ($ million)
- Data Table on Europe - Market size and forecast 2023-2028 ($ million)
- Chart on Europe - Year-over-year growth 2023-2028 (%)
- Data Table on Europe - Year-over-year growth 2023-2028 (%)
- 8.5 North America - Market size and forecast 2023-2028
- Chart on North America - Market size and forecast 2023-2028 ($ million)
- Data Table on North America - Market size and forecast 2023-2028 ($ million)
- Chart on North America - Year-over-year growth 2023-2028 (%)
- Data Table on North America - Year-over-year growth 2023-2028 (%)
- 8.6 South America - Market size and forecast 2023-2028
- Chart on South America - Market size and forecast 2023-2028 ($ million)
- Data Table on South America - Market size and forecast 2023-2028 ($ million)
- Chart on South America - Year-over-year growth 2023-2028 (%)
- Data Table on South America - Year-over-year growth 2023-2028 (%)
- 8.7 Middle East and Africa - Market size and forecast 2023-2028
- Chart on Middle East and Africa - Market size and forecast 2023-2028 ($ million)
- Data Table on Middle East and Africa - Market size and forecast 2023-2028 ($ million)
- Chart on Middle East and Africa - Year-over-year growth 2023-2028 (%)
- Data Table on Middle East and Africa - Year-over-year growth 2023-2028 (%)
- 8.8 China - Market size and forecast 2023-2028
- Chart on China - Market size and forecast 2023-2028 ($ million)
- Data Table on China - Market size and forecast 2023-2028 ($ million)
- Chart on China - Year-over-year growth 2023-2028 (%)
- Data Table on China - Year-over-year growth 2023-2028 (%)
- 8.9 US - Market size and forecast 2023-2028
- Chart on US - Market size and forecast 2023-2028 ($ million)
- Data Table on US - Market size and forecast 2023-2028 ($ million)
- Chart on US - Year-over-year growth 2023-2028 (%)
- Data Table on US - Year-over-year growth 2023-2028 (%)
- 8.10 Taiwan - Market size and forecast 2023-2028
- Chart on Taiwan - Market size and forecast 2023-2028 ($ million)
- Data Table on Taiwan - Market size and forecast 2023-2028 ($ million)
- Chart on Taiwan - Year-over-year growth 2023-2028 (%)
- Data Table on Taiwan - Year-over-year growth 2023-2028 (%)
- 8.11 South Korea - Market size and forecast 2023-2028
- Chart on South Korea - Market size and forecast 2023-2028 ($ million)
- Data Table on South Korea - Market size and forecast 2023-2028 ($ million)
- Chart on South Korea - Year-over-year growth 2023-2028 (%)
- Data Table on South Korea - Year-over-year growth 2023-2028 (%)
- 8.12 Germany - Market size and forecast 2023-2028
- Chart on Germany - Market size and forecast 2023-2028 ($ million)
- Data Table on Germany - Market size and forecast 2023-2028 ($ million)
- Chart on Germany - Year-over-year growth 2023-2028 (%)
- Data Table on Germany - Year-over-year growth 2023-2028 (%)
- 8.13 Market opportunity By Geographical Landscape
- Market opportunity By Geographical Landscape ($ million)
- Data Tables on Market opportunity By Geographical Landscape ($ million)
9 Drivers, Challenges, and Opportunity/Restraints
- 9.1 Market drivers
- 9.2 Market challenges
- 9.3 Impact of drivers and challenges
- Impact of drivers and challenges in 2023 and 2028
- 9.4 Market opportunities/restraints
10 Competitive Landscape
- 10.1 Overview
- 10.2 Competitive Landscape
- Overview on criticality of inputs and factors of differentiation
- 10.3 Landscape disruption
- Overview on factors of disruption
- 10.4 Industry risks
- Impact of key risks on business
11 Competitive Analysis
- 11.1 Companies profiled
- Companies covered
- 11.2 Market positioning of companies
- Matrix on companies position and classification
- 11.3 Compania Espanola de Petroleos SA
- Compania Espanola de Petroleos SA - Overview
- Compania Espanola de Petroleos SA - Business segments
- Compania Espanola de Petroleos SA - Key offerings
- Compania Espanola de Petroleos SA - Segment focus
- 11.4 Covestro AG
- Covestro AG - Overview
- Covestro AG - Business segments
- Covestro AG - Key news
- Covestro AG - Key offerings
- Covestro AG - Segment focus
- 11.5 Honeywell International Inc.
- Honeywell International Inc. - Overview
- Honeywell International Inc. - Business segments
- Honeywell International Inc. - Key news
- Honeywell International Inc. - Key offerings
- Honeywell International Inc. - Segment focus
- 11.6 INEOS Group Holdings S.A.
- INEOS Group Holdings S.A. - Overview
- INEOS Group Holdings S.A. - Product / Service
- INEOS Group Holdings S.A. - Key news
- INEOS Group Holdings S.A. - Key offerings
- 11.7 Kumho Petrochemical Co. Ltd.
- Kumho Petrochemical Co. Ltd. - Overview
- Kumho Petrochemical Co. Ltd. - Product / Service
- Kumho Petrochemical Co. Ltd. - Key news
- Kumho Petrochemical Co. Ltd. - Key offerings
- 11.8 Mitsubishi Chemical Group Corp.
- Mitsubishi Chemical Group Corp. - Overview
- Mitsubishi Chemical Group Corp. - Business segments
- Mitsubishi Chemical Group Corp. - Key news
- Mitsubishi Chemical Group Corp. - Key offerings
- Mitsubishi Chemical Group Corp. - Segment focus
- 11.9 Mitsui Chemicals Inc.
- Mitsui Chemicals Inc. - Overview
- Mitsui Chemicals Inc. - Business segments
- Mitsui Chemicals Inc. - Key offerings
- Mitsui Chemicals Inc. - Segment focus
- 11.10 PTT Global Chemical Public Co. Ltd.
- PTT Global Chemical Public Co. Ltd. - Overview
- PTT Global Chemical Public Co. Ltd. - Business segments
- PTT Global Chemical Public Co. Ltd. - Key offerings
- PTT Global Chemical Public Co. Ltd. - Segment focus
- 11.11 Shell plc
- Shell plc - Overview
- Shell plc - Business segments
- Shell plc - Key news
- Shell plc - Key offerings
- Shell plc - Segment focus
- 11.12 Solvay SA
- Solvay SA - Overview
- Solvay SA - Business segments
- Solvay SA - Key news
- Solvay SA - Key offerings
- Solvay SA - Segment focus
12 Appendix
- 12.1 Scope of the report
- 12.2 Inclusions and exclusions checklist
- Inclusions checklist
- Exclusions checklist
- 12.3 Currency conversion rates for US$
- Currency conversion rates for US$
- 12.4 Research methodology
- Research methodology
- 12.5 Data procurement
- Information sources
- 12.6 Data validation
- Data validation
- 12.7 Validation techniques employed for market sizing
- Validation techniques employed for market sizing
- 12.8 Data synthesis
- Data synthesis
- 12.9 360 degree market analysis
- 360 degree market analysis
- 12.10 List of abbreviations
- List of abbreviations

