|
|
市場調査レポート
商品コード
1559441
硝酸アンモニウムの世界市場、2024~2028年Global Ammonium Nitrate Market 2024-2028 |
||||||
|
|||||||
カスタマイズ可能
|
|||||||

| 硝酸アンモニウムの世界市場、2024~2028年 |
|
出版日: 2024年08月27日
発行: TechNavio
ページ情報: 英文 190 Pages
納期: 即納可能
|

全表示
- 概要
- 図表
- 目次
硝酸アンモニウム市場は2023~2028年に12億8,150万米ドル、予測期間中のCAGRは3.68%で成長すると予測されます。
当レポートでは、硝酸アンモニウム市場の全体的な分析、市場規模・予測、動向、成長促進要因、課題、約25のベンダーを網羅したベンダー分析などを掲載しています。
現在の市場シナリオ、最新動向と促進要因、市場環境全体に関する最新分析を提供しています。市場は、様々な産業用途における硝酸アンモニウムの使用量の増加、高品質な作物に対する需要の増加、世界の急速な都市化と人口増加が牽引しています。
| 市場範囲 | |
|---|---|
| 基準年 | 2024年 |
| 終了年 | 2028年 |
| 予測期間 | 2024~2028年 |
| 成長モメンタム | 加速 |
| 前年比[2024年] | 3.46% |
| CAGR | 3.68% |
| 増分額 | 12億8,150万米ドル |
本調査では、今後数年間の硝酸アンモニウム市場の成長を促進する主要理由の1つとして、肥料の処方と施用方法における技術的進歩を挙げています。また、有機農法やサステイナブル農法への注目が高まり、特殊肥料へのシフトが市場の大きな需要につながります。
目次
第1章 エグゼクティブサマリー
- 市場概要
第2章 Technavio分析
- 価格・ライフサイクル・顧客購入バスケット・採用率・購入基準の分析
- インプットの重要性と差別化の要因
- 混乱の要因
- 促進要因と課題の影響
第3章 市場情勢
- 市場エコシステム
- 市場の特徴
- バリューチェーン分析
第4章 市場規模の評価
- 市場の定義
- 市場セグメント分析
- 市場規模 2023年
- 市場の展望 2023~2028年
第5章 市場規模実績
- 硝酸アンモニウムの世界市場 2018~2022年
- 用途別セグメント分析 2018~2022年
- エンドユーザー別セグメント分析 2018~2022年
- 地域別セグメント分析 2018~2022年
- 国別セグメント分析 2018~2022年
第6章 ファイブフォース分析
- ファイブフォースの要約
- 買い手の交渉力
- 供給企業の交渉力
- 新規参入業者の脅威
- 代替品の脅威
- 競争の脅威
- 市況
第7章 市場セグメンテーション:用途別
- 市場セグメンテーション
- 比較:用途別
- 肥料:市場規模と予測 2023~2028年
- 爆発物:市場規模と予測 2023~2028年
- その他:市場規模と予測 2023~2028年
- 市場機会:用途別
第8章 市場セグメンテーション:エンドユーザー別
- 市場セグメンテーション
- 比較:エンドユーザー別
- 農業:市場規模と予測 2023~2028年
- 鉱業:市場規模と予測 2023~2028年
- その他:市場規模と予測 2023~2028年
- 市場機会:エンドユーザー別
第9章 顧客情勢
- 顧客情勢概要
第10章 地域別情勢
- 地域別セグメンテーション
- 比較:地域別
- アジア太平洋:市場規模と予測 2023~2028年
- 欧州:市場規模と予測 2023~2028年
- 北米:市場規模と予測 2023~2028年
- 南米:市場規模と予測 2023~2028年
- 中東・アフリカ:市場規模と予測 2023~2028年
- 中国:市場規模と予測 2023~2028年
- 米国:市場規模と予測 2023~2028年
- ロシア:市場規模と予測 2023~2028年
- インド:市場規模と予測 2023~2028年
- フランス:市場規模と予測 2023~2028年
- 市場機会:地域情勢別
第11章 促進要因・課題・機会・抑制要因
- 市場促進要因
- 市場課題
- 促進要因と課題の影響
- 市場の機会・抑制要因
第12章 競合情勢
- 概要
- 競合情勢
- 混乱の状況
- 業界のリスク
第13章 競合分析
- 企業プロファイル
- 企業ランキング指数
- 企業の市場ポジショニング
- Acron Group
- Austin Powder
- CF Industries Holdings Inc.
- Dyno Nobel
- ENAEX S.A.
- EuroChem Group AG
- Group DF Ltd.
- Incitec Pivot Ltd.
- LSB Industries Inc
- MAXAMCORP HOLDING SL
- Neochim PLC
- Nutrien Ltd.
- Orica Ltd.
- Uralchem JSC
- Yara International ASA
第14章 付録
Exhibits:
- Exhibits1: Executive Summary - Chart on Market Overview
- Exhibits2: Executive Summary - Data Table on Market Overview
- Exhibits3: Executive Summary - Chart on Global Market Characteristics
- Exhibits4: Executive Summary - Chart on Market By Geographical Landscape
- Exhibits5: Executive Summary - Chart on Market Segmentation by Application
- Exhibits6: Executive Summary - Chart on Market Segmentation by End-user
- Exhibits7: Executive Summary - Chart on Incremental Growth
- Exhibits8: Executive Summary - Data Table on Incremental Growth
- Exhibits9: Executive Summary - Chart on Company Market Positioning
- Exhibits10: Analysis of price sensitivity, lifecycle, customer purchase basket, adoption rates, and purchase criteria
- Exhibits11: Overview on criticality of inputs and factors of differentiation
- Exhibits12: Overview on factors of disruption
- Exhibits13: Impact of drivers and challenges in 2023 and 2028
- Exhibits14: Parent Market
- Exhibits15: Data Table on - Parent Market
- Exhibits16: Market characteristics analysis
- Exhibits17: Value Chain Analysis
- Exhibits18: Offerings of companies included in the market definition
- Exhibits19: Market segments
- Exhibits20: Chart on Global - Market size and forecast 2023-2028 ($ million)
- Exhibits21: Data Table on Global - Market size and forecast 2023-2028 ($ million)
- Exhibits22: Chart on Global Market: Year-over-year growth 2023-2028 (%)
- Exhibits23: Data Table on Global Market: Year-over-year growth 2023-2028 (%)
- Exhibits24: Historic Market Size - Data Table on Global Ammonium Nitrate Market 2018 - 2022 ($ million)
- Exhibits25: Historic Market Size - Application Segment 2018 - 2022 ($ million)
- Exhibits26: Historic Market Size - End-user Segment 2018 - 2022 ($ million)
- Exhibits27: Historic Market Size - Geography Segment 2018 - 2022 ($ million)
- Exhibits28: Historic Market Size - Country Segment 2018 - 2022 ($ million)
- Exhibits29: Five forces analysis - Comparison between 2023 and 2028
- Exhibits30: Bargaining power of buyers - Impact of key factors 2023 and 2028
- Exhibits31: Bargaining power of suppliers - Impact of key factors in 2023 and 2028
- Exhibits32: Threat of new entrants - Impact of key factors in 2023 and 2028
- Exhibits33: Threat of substitutes - Impact of key factors in 2023 and 2028
- Exhibits34: Threat of rivalry - Impact of key factors in 2023 and 2028
- Exhibits35: Chart on Market condition - Five forces 2023 and 2028
- Exhibits36: Chart on Application - Market share 2023-2028 (%)
- Exhibits37: Data Table on Application - Market share 2023-2028 (%)
- Exhibits38: Chart on Comparison by Application
- Exhibits39: Data Table on Comparison by Application
- Exhibits40: Chart on Fertilizer - Market size and forecast 2023-2028 ($ million)
- Exhibits41: Data Table on Fertilizer - Market size and forecast 2023-2028 ($ million)
- Exhibits42: Chart on Fertilizer - Year-over-year growth 2023-2028 (%)
- Exhibits43: Data Table on Fertilizer - Year-over-year growth 2023-2028 (%)
- Exhibits44: Chart on Explosives - Market size and forecast 2023-2028 ($ million)
- Exhibits45: Data Table on Explosives - Market size and forecast 2023-2028 ($ million)
- Exhibits46: Chart on Explosives - Year-over-year growth 2023-2028 (%)
- Exhibits47: Data Table on Explosives - Year-over-year growth 2023-2028 (%)
- Exhibits48: Chart on Others - Market size and forecast 2023-2028 ($ million)
- Exhibits49: Data Table on Others - Market size and forecast 2023-2028 ($ million)
- Exhibits50: Chart on Others - Year-over-year growth 2023-2028 (%)
- Exhibits51: Data Table on Others - Year-over-year growth 2023-2028 (%)
- Exhibits52: Market opportunity by Application ($ million)
- Exhibits53: Data Table on Market opportunity by Application ($ million)
- Exhibits54: Chart on End-user - Market share 2023-2028 (%)
- Exhibits55: Data Table on End-user - Market share 2023-2028 (%)
- Exhibits56: Chart on Comparison by End-user
- Exhibits57: Data Table on Comparison by End-user
- Exhibits58: Chart on Agriculture - Market size and forecast 2023-2028 ($ million)
- Exhibits59: Data Table on Agriculture - Market size and forecast 2023-2028 ($ million)
- Exhibits60: Chart on Agriculture - Year-over-year growth 2023-2028 (%)
- Exhibits61: Data Table on Agriculture - Year-over-year growth 2023-2028 (%)
- Exhibits62: Chart on Mining - Market size and forecast 2023-2028 ($ million)
- Exhibits63: Data Table on Mining - Market size and forecast 2023-2028 ($ million)
- Exhibits64: Chart on Mining - Year-over-year growth 2023-2028 (%)
- Exhibits65: Data Table on Mining - Year-over-year growth 2023-2028 (%)
- Exhibits66: Chart on Others - Market size and forecast 2023-2028 ($ million)
- Exhibits67: Data Table on Others - Market size and forecast 2023-2028 ($ million)
- Exhibits68: Chart on Others - Year-over-year growth 2023-2028 (%)
- Exhibits69: Data Table on Others - Year-over-year growth 2023-2028 (%)
- Exhibits70: Market opportunity by End-user ($ million)
- Exhibits71: Data Table on Market opportunity by End-user ($ million)
- Exhibits72: Analysis of price sensitivity, lifecycle, customer purchase basket, adoption rates, and purchase criteria
- Exhibits73: Chart on Market share By Geographical Landscape 2023-2028 (%)
- Exhibits74: Data Table on Market share By Geographical Landscape 2023-2028 (%)
- Exhibits75: Chart on Geographic comparison
- Exhibits76: Data Table on Geographic comparison
- Exhibits77: Chart on APAC - Market size and forecast 2023-2028 ($ million)
- Exhibits78: Data Table on APAC - Market size and forecast 2023-2028 ($ million)
- Exhibits79: Chart on APAC - Year-over-year growth 2023-2028 (%)
- Exhibits80: Data Table on APAC - Year-over-year growth 2023-2028 (%)
- Exhibits81: Chart on Europe - Market size and forecast 2023-2028 ($ million)
- Exhibits82: Data Table on Europe - Market size and forecast 2023-2028 ($ million)
- Exhibits83: Chart on Europe - Year-over-year growth 2023-2028 (%)
- Exhibits84: Data Table on Europe - Year-over-year growth 2023-2028 (%)
- Exhibits85: Chart on North America - Market size and forecast 2023-2028 ($ million)
- Exhibits86: Data Table on North America - Market size and forecast 2023-2028 ($ million)
- Exhibits87: Chart on North America - Year-over-year growth 2023-2028 (%)
- Exhibits88: Data Table on North America - Year-over-year growth 2023-2028 (%)
- Exhibits89: Chart on South America - Market size and forecast 2023-2028 ($ million)
- Exhibits90: Data Table on South America - Market size and forecast 2023-2028 ($ million)
- Exhibits91: Chart on South America - Year-over-year growth 2023-2028 (%)
- Exhibits92: Data Table on South America - Year-over-year growth 2023-2028 (%)
- Exhibits93: Chart on Middle East and Africa - Market size and forecast 2023-2028 ($ million)
- Exhibits94: Data Table on Middle East and Africa - Market size and forecast 2023-2028 ($ million)
- Exhibits95: Chart on Middle East and Africa - Year-over-year growth 2023-2028 (%)
- Exhibits96: Data Table on Middle East and Africa - Year-over-year growth 2023-2028 (%)
- Exhibits97: Chart on China - Market size and forecast 2023-2028 ($ million)
- Exhibits98: Data Table on China - Market size and forecast 2023-2028 ($ million)
- Exhibits99: Chart on China - Year-over-year growth 2023-2028 (%)
- Exhibits100: Data Table on China - Year-over-year growth 2023-2028 (%)
- Exhibits101: Chart on US - Market size and forecast 2023-2028 ($ million)
- Exhibits102: Data Table on US - Market size and forecast 2023-2028 ($ million)
- Exhibits103: Chart on US - Year-over-year growth 2023-2028 (%)
- Exhibits104: Data Table on US - Year-over-year growth 2023-2028 (%)
- Exhibits105: Chart on Russia - Market size and forecast 2023-2028 ($ million)
- Exhibits106: Data Table on Russia - Market size and forecast 2023-2028 ($ million)
- Exhibits107: Chart on Russia - Year-over-year growth 2023-2028 (%)
- Exhibits108: Data Table on Russia - Year-over-year growth 2023-2028 (%)
- Exhibits109: Chart on India - Market size and forecast 2023-2028 ($ million)
- Exhibits110: Data Table on India - Market size and forecast 2023-2028 ($ million)
- Exhibits111: Chart on India - Year-over-year growth 2023-2028 (%)
- Exhibits112: Data Table on India - Year-over-year growth 2023-2028 (%)
- Exhibits113: Chart on France - Market size and forecast 2023-2028 ($ million)
- Exhibits114: Data Table on France - Market size and forecast 2023-2028 ($ million)
- Exhibits115: Chart on France - Year-over-year growth 2023-2028 (%)
- Exhibits116: Data Table on France - Year-over-year growth 2023-2028 (%)
- Exhibits117: Market opportunity By Geographical Landscape ($ million)
- Exhibits118: Data Tables on Market opportunity By Geographical Landscape ($ million)
- Exhibits119: Impact of drivers and challenges in 2023 and 2028
- Exhibits120: Overview on criticality of inputs and factors of differentiation
- Exhibits121: Overview on factors of disruption
- Exhibits122: Impact of key risks on business
- Exhibits123: Companies covered
- Exhibits124: Company ranking index
- Exhibits125: Matrix on companies position and classification
- Exhibits126: Acron Group - Overview
- Exhibits127: Acron Group - Business segments
- Exhibits128: Acron Group - Key offerings
- Exhibits129: Acron Group - Segment focus
- Exhibits130: SWOT
- Exhibits131: Austin Powder - Overview
- Exhibits132: Austin Powder - Product / Service
- Exhibits133: Austin Powder - Key offerings
- Exhibits134: SWOT
- Exhibits135: CF Industries Holdings Inc. - Overview
- Exhibits136: CF Industries Holdings Inc. - Business segments
- Exhibits137: CF Industries Holdings Inc. - Key offerings
- Exhibits138: CF Industries Holdings Inc. - Segment focus
- Exhibits139: SWOT
- Exhibits140: Dyno Nobel - Overview
- Exhibits141: Dyno Nobel - Product / Service
- Exhibits142: Dyno Nobel - Key offerings
- Exhibits143: SWOT
- Exhibits144: ENAEX S.A. - Overview
- Exhibits145: ENAEX S.A. - Product / Service
- Exhibits146: ENAEX S.A. - Key offerings
- Exhibits147: SWOT
- Exhibits148: EuroChem Group AG - Overview
- Exhibits149: EuroChem Group AG - Product / Service
- Exhibits150: EuroChem Group AG - Key offerings
- Exhibits151: SWOT
- Exhibits152: Group DF Ltd. - Overview
- Exhibits153: Group DF Ltd. - Product / Service
- Exhibits154: Group DF Ltd. - Key offerings
- Exhibits155: SWOT
- Exhibits156: Incitec Pivot Ltd. - Overview
- Exhibits157: Incitec Pivot Ltd. - Product / Service
- Exhibits158: Incitec Pivot Ltd. - Key offerings
- Exhibits159: SWOT
- Exhibits160: LSB Industries Inc - Overview
- Exhibits161: LSB Industries Inc - Product / Service
- Exhibits162: LSB Industries Inc - Key offerings
- Exhibits163: SWOT
- Exhibits164: MAXAMCORP HOLDING SL - Overview
- Exhibits165: MAXAMCORP HOLDING SL - Product / Service
- Exhibits166: MAXAMCORP HOLDING SL - Key offerings
- Exhibits167: SWOT
- Exhibits168: Neochim PLC - Overview
- Exhibits169: Neochim PLC - Product / Service
- Exhibits170: Neochim PLC - Key offerings
- Exhibits171: SWOT
- Exhibits172: Nutrien Ltd. - Overview
- Exhibits173: Nutrien Ltd. - Business segments
- Exhibits174: Nutrien Ltd. - Key offerings
- Exhibits175: Nutrien Ltd. - Segment focus
- Exhibits176: SWOT
- Exhibits177: Orica Ltd. - Overview
- Exhibits178: Orica Ltd. - Business segments
- Exhibits179: Orica Ltd. - Key offerings
- Exhibits180: Orica Ltd. - Segment focus
- Exhibits181: SWOT
- Exhibits182: Uralchem JSC - Overview
- Exhibits183: Uralchem JSC - Product / Service
- Exhibits184: Uralchem JSC - Key offerings
- Exhibits185: SWOT
- Exhibits186: Yara International ASA - Overview
- Exhibits187: Yara International ASA - Business segments
- Exhibits188: Yara International ASA - Key offerings
- Exhibits189: Yara International ASA - Segment focus
- Exhibits190: SWOT
- Exhibits191: Inclusions checklist
- Exhibits192: Exclusions checklist
- Exhibits193: Currency conversion rates for US$
- Exhibits194: Research methodology
- Exhibits195: Information sources
- Exhibits196: Data validation
- Exhibits197: Validation techniques employed for market sizing
- Exhibits198: Data synthesis
- Exhibits199: 360 degree market analysis
- Exhibits200: List of abbreviations
The ammonium nitrate market is forecasted to grow by USD 1281.5 mn during 2023-2028, accelerating at a CAGR of 3.68% during the forecast period. The report on the ammonium nitrate market provides a holistic analysis, market size and forecast, trends, growth drivers, and challenges, as well as vendor analysis covering around 25 vendors.
The report offers an up-to-date analysis regarding the current market scenario, the latest trends and drivers, and the overall market environment. The market is driven by rising use of ammonium nitrate in various industrial applications, increase in demand for high-quality crops, and rapid urbanization and population growth worldwide.
Technavio's ammonium nitrate market is segmented as below:
| Market Scope | |
|---|---|
| Base Year | 2024 |
| End Year | 2028 |
| Series Year | 2024-2028 |
| Growth Momentum | Accelerate |
| YOY 2024 | 3.46% |
| CAGR | 3.68% |
| Incremental Value | $1281.5 mn |
By Application
- Fertilizer
- Explosives
- Others
By End-user
- Agriculture
- Mining
- Others
By Geographical Landscape
- APAC
- Europe
- North America
- South America
- Middle East and Africa
This study identifies the technological advancements in fertilizer formulation and application methods as one of the prime reasons driving the ammonium nitrate market growth during the next few years. Also, growing focus on organic and sustainable farming practices and shift toward specialty fertilizers will lead to sizable demand in the market.
The report on the ammonium nitrate market covers the following areas:
- Ammonium nitrate market sizing
- Ammonium nitrate market forecast
- Ammonium nitrate market industry analysis
The robust vendor analysis is designed to help clients improve their market position, and in line with this, this report provides a detailed analysis of several leading ammonium nitrate market vendors that include Acron Group, Austin Powder, CF Industries Holdings Inc., Deepak Fertilisers and Petrochemicals Corp. Ltd., Dyno Nobel, ENAEX S.A., EuroChem Group AG, Group DF Ltd., Hanwha Corp., Incitec Pivot Ltd., Koch Industries Inc., LSB Industries Inc, MAXAMCORP HOLDING SL, Neochim PLC, Nutrien Ltd., Orica Ltd., PJSC Togliattiazot, Sasol Ltd., Uralchem JSC, and Yara International ASA. Also, the ammonium nitrate market analysis report includes information on upcoming trends and challenges that will influence market growth. This is to help companies strategize and leverage all forthcoming growth opportunities.
The study was conducted using an objective combination of primary and secondary information including inputs from key participants in the industry. The report contains a comprehensive market and vendor landscape in addition to an analysis of the key vendors.
The publisher presents a detailed picture of the market by the way of study, synthesis, and summation of data from multiple sources by an analysis of key parameters such as profit, pricing, competition, and promotions. It presents various market facets by identifying the key industry influencers. The data presented is comprehensive, reliable, and a result of extensive research - both primary and secondary. The market research reports provide a complete competitive landscape and an in-depth vendor selection methodology and analysis using qualitative and quantitative research to forecast the accurate market growth.
Table of Contents
1 Executive Summary
- 1.1 Market overview
- Executive Summary - Chart on Market Overview
- Executive Summary - Data Table on Market Overview
- Executive Summary - Chart on Global Market Characteristics
- Executive Summary - Chart on Market By Geographical Landscape
- Executive Summary - Chart on Market Segmentation by Application
- Executive Summary - Chart on Market Segmentation by End-user
- Executive Summary - Chart on Incremental Growth
- Executive Summary - Data Table on Incremental Growth
- Executive Summary - Chart on Company Market Positioning
2 Technavio Analysis
- 2.1 Analysis of price sensitivity, lifecycle, customer purchase basket, adoption rates, and purchase criteria
- Analysis of price sensitivity, lifecycle, customer purchase basket, adoption rates, and purchase criteria
- 2.2 Criticality of inputs and Factors of differentiation
- Overview on criticality of inputs and factors of differentiation
- 2.3 Factors of disruption
- Overview on factors of disruption
- 2.4 Impact of drivers and challenges
- Impact of drivers and challenges in 2023 and 2028
3 Market Landscape
- 3.1 Market ecosystem
- Parent Market
- Data Table on - Parent Market
- 3.2 Market characteristics
- Market characteristics analysis
- 3.3 Value chain analysis
- Value Chain Analysis
4 Market Sizing
- 4.1 Market definition
- Offerings of companies included in the market definition
- 4.2 Market segment analysis
- Market segments
- 4.3 Market size 2023
- 4.4 Market outlook: Forecast for 2023-2028
- Chart on Global - Market size and forecast 2023-2028 ($ million)
- Data Table on Global - Market size and forecast 2023-2028 ($ million)
- Chart on Global Market: Year-over-year growth 2023-2028 (%)
- Data Table on Global Market: Year-over-year growth 2023-2028 (%)
5 Historic Market Size
- 5.1 Global Ammonium Nitrate Market 2018 - 2022
- Historic Market Size - Data Table on Global Ammonium Nitrate Market 2018 - 2022 ($ million)
- 5.2 Application segment analysis 2018 - 2022
- Historic Market Size - Application Segment 2018 - 2022 ($ million)
- 5.3 End-user segment analysis 2018 - 2022
- Historic Market Size - End-user Segment 2018 - 2022 ($ million)
- 5.4 Geography segment analysis 2018 - 2022
- Historic Market Size - Geography Segment 2018 - 2022 ($ million)
- 5.5 Country segment analysis 2018 - 2022
- Historic Market Size - Country Segment 2018 - 2022 ($ million)
6 Five Forces Analysis
- 6.1 Five forces summary
- Five forces analysis - Comparison between 2023 and 2028
- 6.2 Bargaining power of buyers
- Bargaining power of buyers - Impact of key factors 2023 and 2028
- 6.3 Bargaining power of suppliers
- Bargaining power of suppliers - Impact of key factors in 2023 and 2028
- 6.4 Threat of new entrants
- Threat of new entrants - Impact of key factors in 2023 and 2028
- 6.5 Threat of substitutes
- Threat of substitutes - Impact of key factors in 2023 and 2028
- 6.6 Threat of rivalry
- Threat of rivalry - Impact of key factors in 2023 and 2028
- 6.7 Market condition
- Chart on Market condition - Five forces 2023 and 2028
7 Market Segmentation by Application
- 7.1 Market segments
- Chart on Application - Market share 2023-2028 (%)
- Data Table on Application - Market share 2023-2028 (%)
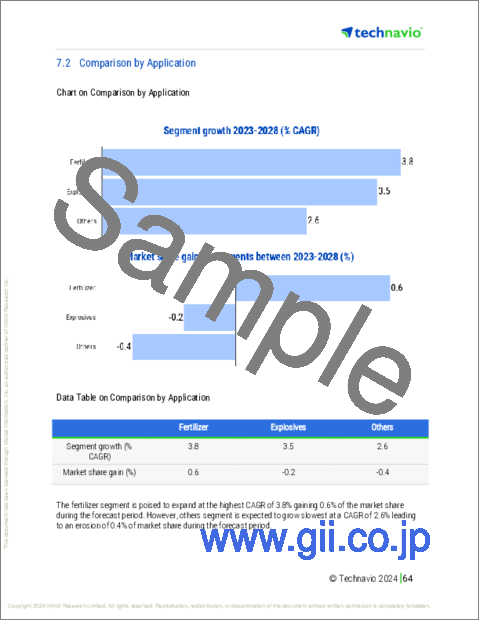
- 7.2 Comparison by Application
- Chart on Comparison by Application
- Data Table on Comparison by Application
- 7.3 Fertilizer - Market size and forecast 2023-2028
- Chart on Fertilizer - Market size and forecast 2023-2028 ($ million)
- Data Table on Fertilizer - Market size and forecast 2023-2028 ($ million)
- Chart on Fertilizer - Year-over-year growth 2023-2028 (%)
- Data Table on Fertilizer - Year-over-year growth 2023-2028 (%)
- 7.4 Explosives - Market size and forecast 2023-2028
- Chart on Explosives - Market size and forecast 2023-2028 ($ million)
- Data Table on Explosives - Market size and forecast 2023-2028 ($ million)
- Chart on Explosives - Year-over-year growth 2023-2028 (%)
- Data Table on Explosives - Year-over-year growth 2023-2028 (%)
- 7.5 Others - Market size and forecast 2023-2028
- Chart on Others - Market size and forecast 2023-2028 ($ million)
- Data Table on Others - Market size and forecast 2023-2028 ($ million)
- Chart on Others - Year-over-year growth 2023-2028 (%)
- Data Table on Others - Year-over-year growth 2023-2028 (%)
- 7.6 Market opportunity by Application
- Market opportunity by Application ($ million)
- Data Table on Market opportunity by Application ($ million)
8 Market Segmentation by End-user
- 8.1 Market segments
- Chart on End-user - Market share 2023-2028 (%)
- Data Table on End-user - Market share 2023-2028 (%)
- 8.2 Comparison by End-user
- Chart on Comparison by End-user
- Data Table on Comparison by End-user
- 8.3 Agriculture - Market size and forecast 2023-2028
- Chart on Agriculture - Market size and forecast 2023-2028 ($ million)
- Data Table on Agriculture - Market size and forecast 2023-2028 ($ million)
- Chart on Agriculture - Year-over-year growth 2023-2028 (%)
- Data Table on Agriculture - Year-over-year growth 2023-2028 (%)
- 8.4 Mining - Market size and forecast 2023-2028
- Chart on Mining - Market size and forecast 2023-2028 ($ million)
- Data Table on Mining - Market size and forecast 2023-2028 ($ million)
- Chart on Mining - Year-over-year growth 2023-2028 (%)
- Data Table on Mining - Year-over-year growth 2023-2028 (%)
- 8.5 Others - Market size and forecast 2023-2028
- Chart on Others - Market size and forecast 2023-2028 ($ million)
- Data Table on Others - Market size and forecast 2023-2028 ($ million)
- Chart on Others - Year-over-year growth 2023-2028 (%)
- Data Table on Others - Year-over-year growth 2023-2028 (%)
- 8.6 Market opportunity by End-user
- Market opportunity by End-user ($ million)
- Data Table on Market opportunity by End-user ($ million)
9 Customer Landscape
- 9.1 Customer landscape overview
- Analysis of price sensitivity, lifecycle, customer purchase basket, adoption rates, and purchase criteria
10 Geographic Landscape
- 10.1 Geographic segmentation
- Chart on Market share By Geographical Landscape 2023-2028 (%)
- Data Table on Market share By Geographical Landscape 2023-2028 (%)
- 10.2 Geographic comparison
- Chart on Geographic comparison
- Data Table on Geographic comparison
- 10.3 APAC - Market size and forecast 2023-2028
- Chart on APAC - Market size and forecast 2023-2028 ($ million)
- Data Table on APAC - Market size and forecast 2023-2028 ($ million)
- Chart on APAC - Year-over-year growth 2023-2028 (%)
- Data Table on APAC - Year-over-year growth 2023-2028 (%)
- 10.4 Europe - Market size and forecast 2023-2028
- Chart on Europe - Market size and forecast 2023-2028 ($ million)
- Data Table on Europe - Market size and forecast 2023-2028 ($ million)
- Chart on Europe - Year-over-year growth 2023-2028 (%)
- Data Table on Europe - Year-over-year growth 2023-2028 (%)
- 10.5 North America - Market size and forecast 2023-2028
- Chart on North America - Market size and forecast 2023-2028 ($ million)
- Data Table on North America - Market size and forecast 2023-2028 ($ million)
- Chart on North America - Year-over-year growth 2023-2028 (%)
- Data Table on North America - Year-over-year growth 2023-2028 (%)
- 10.6 South America - Market size and forecast 2023-2028
- Chart on South America - Market size and forecast 2023-2028 ($ million)
- Data Table on South America - Market size and forecast 2023-2028 ($ million)
- Chart on South America - Year-over-year growth 2023-2028 (%)
- Data Table on South America - Year-over-year growth 2023-2028 (%)
- 10.7 Middle East and Africa - Market size and forecast 2023-2028
- Chart on Middle East and Africa - Market size and forecast 2023-2028 ($ million)
- Data Table on Middle East and Africa - Market size and forecast 2023-2028 ($ million)
- Chart on Middle East and Africa - Year-over-year growth 2023-2028 (%)
- Data Table on Middle East and Africa - Year-over-year growth 2023-2028 (%)
- 10.8 China - Market size and forecast 2023-2028
- Chart on China - Market size and forecast 2023-2028 ($ million)
- Data Table on China - Market size and forecast 2023-2028 ($ million)
- Chart on China - Year-over-year growth 2023-2028 (%)
- Data Table on China - Year-over-year growth 2023-2028 (%)
- 10.9 US - Market size and forecast 2023-2028
- Chart on US - Market size and forecast 2023-2028 ($ million)
- Data Table on US - Market size and forecast 2023-2028 ($ million)
- Chart on US - Year-over-year growth 2023-2028 (%)
- Data Table on US - Year-over-year growth 2023-2028 (%)
- 10.10 Russia - Market size and forecast 2023-2028
- Chart on Russia - Market size and forecast 2023-2028 ($ million)
- Data Table on Russia - Market size and forecast 2023-2028 ($ million)
- Chart on Russia - Year-over-year growth 2023-2028 (%)
- Data Table on Russia - Year-over-year growth 2023-2028 (%)
- 10.11 India - Market size and forecast 2023-2028
- Chart on India - Market size and forecast 2023-2028 ($ million)
- Data Table on India - Market size and forecast 2023-2028 ($ million)
- Chart on India - Year-over-year growth 2023-2028 (%)
- Data Table on India - Year-over-year growth 2023-2028 (%)
- 10.12 France - Market size and forecast 2023-2028
- Chart on France - Market size and forecast 2023-2028 ($ million)
- Data Table on France - Market size and forecast 2023-2028 ($ million)
- Chart on France - Year-over-year growth 2023-2028 (%)
- Data Table on France - Year-over-year growth 2023-2028 (%)
- 10.13 Market opportunity By Geographical Landscape
- Market opportunity By Geographical Landscape ($ million)
- Data Tables on Market opportunity By Geographical Landscape ($ million)
11 Drivers, Challenges, and Opportunity/Restraints
- 11.1 Market drivers
- 11.2 Market challenges
- 11.3 Impact of drivers and challenges
- Impact of drivers and challenges in 2023 and 2028
- 11.4 Market opportunities/restraints
12 Competitive Landscape
- 12.1 Overview
- 12.2 Competitive Landscape
- Overview on criticality of inputs and factors of differentiation
- 12.3 Landscape disruption
- Overview on factors of disruption
- 12.4 Industry risks
- Impact of key risks on business
13 Competitive Analysis
- 13.1 Companies profiled
- Companies covered
- 13.2 Company ranking index
- Company ranking index
- 13.3 Market positioning of companies
- Matrix on companies position and classification
- 13.4 Acron Group
- Acron Group - Overview
- Acron Group - Business segments
- Acron Group - Key offerings
- Acron Group - Segment focus
- SWOT
- 13.5 Austin Powder
- Austin Powder - Overview
- Austin Powder - Product / Service
- Austin Powder - Key offerings
- SWOT
- 13.6 CF Industries Holdings Inc.
- CF Industries Holdings Inc. - Overview
- CF Industries Holdings Inc. - Business segments
- CF Industries Holdings Inc. - Key offerings
- CF Industries Holdings Inc. - Segment focus
- SWOT
- 13.7 Dyno Nobel
- Dyno Nobel - Overview
- Dyno Nobel - Product / Service
- Dyno Nobel - Key offerings
- SWOT
- 13.8 ENAEX S.A.
- ENAEX S.A. - Overview
- ENAEX S.A. - Product / Service
- ENAEX S.A. - Key offerings
- SWOT
- 13.9 EuroChem Group AG
- EuroChem Group AG - Overview
- EuroChem Group AG - Product / Service
- EuroChem Group AG - Key offerings
- SWOT
- 13.10 Group DF Ltd.
- Group DF Ltd. - Overview
- Group DF Ltd. - Product / Service
- Group DF Ltd. - Key offerings
- SWOT
- 13.11 Incitec Pivot Ltd.
- Incitec Pivot Ltd. - Overview
- Incitec Pivot Ltd. - Product / Service
- Incitec Pivot Ltd. - Key offerings
- SWOT
- 13.12 LSB Industries Inc
- LSB Industries Inc - Overview
- LSB Industries Inc - Product / Service
- LSB Industries Inc - Key offerings
- SWOT
- 13.13 MAXAMCORP HOLDING SL
- MAXAMCORP HOLDING SL - Overview
- MAXAMCORP HOLDING SL - Product / Service
- MAXAMCORP HOLDING SL - Key offerings
- SWOT
- 13.14 Neochim PLC
- Neochim PLC - Overview
- Neochim PLC - Product / Service
- Neochim PLC - Key offerings
- SWOT
- 13.15 Nutrien Ltd.
- Nutrien Ltd. - Overview
- Nutrien Ltd. - Business segments
- Nutrien Ltd. - Key offerings
- Nutrien Ltd. - Segment focus
- SWOT
- 13.16 Orica Ltd.
- Orica Ltd. - Overview
- Orica Ltd. - Business segments
- Orica Ltd. - Key offerings
- Orica Ltd. - Segment focus
- SWOT
- 13.17 Uralchem JSC
- Uralchem JSC - Overview
- Uralchem JSC - Product / Service
- Uralchem JSC - Key offerings
- SWOT
- 13.18 Yara International ASA
- Yara International ASA - Overview
- Yara International ASA - Business segments
- Yara International ASA - Key offerings
- Yara International ASA - Segment focus
- SWOT
14 Appendix
- 14.1 Scope of the report
- 14.2 Inclusions and exclusions checklist
- Inclusions checklist
- Exclusions checklist
- 14.3 Currency conversion rates for US$
- Currency conversion rates for US$
- 14.4 Research methodology
- Research methodology
- 14.5 Data procurement
- Information sources
- 14.6 Data validation
- Data validation
- 14.7 Validation techniques employed for market sizing
- Validation techniques employed for market sizing
- 14.8 Data synthesis
- Data synthesis
- 14.9 360 degree market analysis
- 360 degree market analysis
- 14.10 List of abbreviations
- List of abbreviations
