|
|
市場調査レポート
商品コード
1723095
歯科矯正の世界市場 2025~2029年Global Orthodontic Market 2025-2029 |
||||||

|
|||||||
カスタマイズ可能
|
|||||||


| 歯科矯正の世界市場 2025~2029年 |
|
出版日: 2025年05月03日
発行: TechNavio
ページ情報: 英文 213 Pages
納期: 即納可能
|

全表示
- 概要
- 図表
- 目次
歯科矯正市場は2024-2029年に213億7,390万米ドル、予測期間中のCAGRは26.3%で成長すると予測されます。
当レポートでは、歯科矯正市場の全体的な分析、市場規模・予測、動向、成長促進要因、課題、約25のベンダーを網羅したベンダー分析などを掲載しています。
現在の市場シナリオ、最新動向と促進要因、市場環境全体に関する最新分析を提供しています。市場は、口腔疾患の高い有病率、歯科矯正治療に対する意識の高まり、歯科学校と歯科医の数の増加によって牽引されています。
| 市場範囲 | |
|---|---|
| 基準年 | 2025 |
| 終了年 | 2029 |
| 予測期間 | 2025-2029 |
| 成長モメンタム | 加速 |
| 前年比2025年 | 20.5% |
| CAGR | 26.3% |
| 増分額 | 213億7,390万米ドル |
本調査は、業界の主要参加者からのインプットを含め、一次情報と二次情報を客観的に組み合わせて実施しました。レポートには、主要企業の分析に加え、包括的な市場規模データ、地域分析によるセグメント、ベンダー情勢が含まれています。レポートには過去データと予測データがあります。
本調査では、歯科矯正治療における技術の進歩が、今後数年間の歯科矯正市場の成長を促進する主要な理由の1つであると特定しています。また、歯科矯正製品の販売を後押しする不正咬合の症例の増加や、歯科矯正の新製品発売は、市場の大きな需要につながるでしょう。
目次
第1章 エグゼクティブサマリー
- 市場概要
第2章 Technavio分析
- 価格・ライフサイクル・顧客購入バスケット・採用率・購入基準の分析
- インプットの重要性と差別化の要因
- 混乱の要因
- 促進要因と課題の影響
第3章 市場情勢
- 市場エコシステム
- 市場の特徴
- バリューチェーン分析
第4章 市場規模
- 市場の定義
- 市場セグメント分析
- 市場規模 2024
- 市場の見通し 2024-2029
第5章 市場規模実績
- 歯科矯正の世界市場 2019-2023
- 製品タイプ別セグメント分析 2019-2023
- エンドユーザー別セグメント分析 2019-2023
- タイプ別セグメント分析 2019-2023
- 地域別セグメント分析 2019-2023
- 国別セグメント分析 2019-2023
第6章 定性分析
- AIの影響:歯科矯正の世界市場
第7章 ファイブフォース分析
- ファイブフォースの要約
- 買い手の交渉力
- 供給企業の交渉力
- 新規参入業者の脅威
- 代替品の脅威
- 競争の脅威
- 市況
第8章 市場セグメンテーション:製品タイプ別
- 市場セグメント
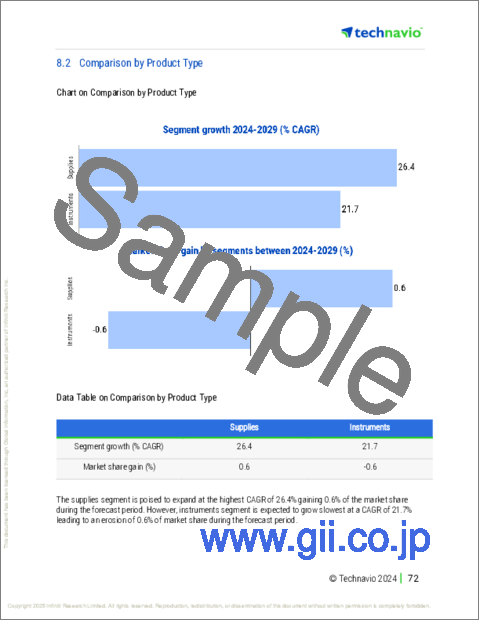
- 比較:製品タイプ別
- 用品:市場規模と予測 2024-2029
- 器具:市場規模と予測 2024-2029
- 市場機会:製品タイプ別
第9章 市場セグメンテーション:エンドユーザー別
- 市場セグメント
- 比較:エンドユーザー別
- 歯科医院:市場規模と予測 2024-2029
- 病院:市場規模と予測 2024-2029
- その他:市場規模と予測 2024-2029
- 市場機会:エンドユーザー別
第10章 市場セグメンテーション:タイプ別
- 市場セグメント
- 比較:タイプ別
- 従来の矯正器具:市場規模と予測 2024-2029
- 透明アライナー:市場規模と予測 2024-2029
- セルフライゲーティングブラケット:市場規模と予測 2024-2029
- セラミックブラケット:市場規模と予測 2024-2029
- 舌側ブラケット:市場規模と予測 2024-2029
- 市場機会:タイプ別
第11章 顧客情勢
- 顧客情勢の概要
第12章 地域別情勢
- 地域別セグメンテーション
- 地域別比較
- 北米:市場規模と予測 2024-2029
- 欧州:市場規模と予測 2024-2029
- アジア:市場規模と予測 2024-2029
- 世界のその他の地域:市場規模と予測 2024-2029
- 米国:市場規模と予測 2024-2029
- 中国:市場規模と予測 2024-2029
- ドイツ:市場規模と予測 2024-2029
- カナダ:市場規模と予測 2024-2029
- フランス:市場規模と予測 2024-2029
- ブラジル:市場規模と予測 2024-2029
- 日本:市場規模と予測 2024-2029
- 英国:市場規模と予測 2024-2029
- 韓国:市場規模と予測 2024-2029
- インド:市場規模と予測 2024-2029
- 市場機会:地域情勢別
第13章 促進要因・課題・機会・抑制要因
- 市場促進要因
- 市場の課題
- 促進要因と課題の影響
- 市場の機会・抑制要因
第14章 競合情勢
- 概要
- 競合情勢
- 混乱の状況
- 業界のリスク
第15章 競合分析
- 企業プロファイル
- 企業ランキング指数
- 企業の市場ポジショニング
- Align Technology Inc.
- American Orthodontics
- Carestream Dental LLC
- DENTAURUM GmbH and Co. KG
- Dentsply Sirona Inc.
- Envista Holdings Corp.
- G and H Orthodontics
- Geniova Technologies SL
- Great Lakes Dental Technologies Ltd.
- Henry Schein Inc.
- Rocky Mountain Orthodontics
- SmileDirectClub Inc.
- TP Orthodontics Inc.
- Ultradent Products Inc.
第16章 付録
Exhibits:
- Exhibits1: Executive Summary - Chart on Market Overview
- Exhibits2: Executive Summary - Data Table on Market Overview
- Exhibits3: Executive Summary - Chart on Global Market Characteristics
- Exhibits4: Executive Summary - Chart on Market By Geographical Landscape
- Exhibits5: Executive Summary - Chart on Market Segmentation by Product Type
- Exhibits6: Executive Summary - Chart on Market Segmentation by End-user
- Exhibits7: Executive Summary - Chart on Market Segmentation by Type
- Exhibits8: Executive Summary - Chart on Incremental Growth
- Exhibits9: Executive Summary - Data Table on Incremental Growth
- Exhibits10: Executive Summary - Chart on Company Market Positioning
- Exhibits11: Analysis of price sensitivity, lifecycle, customer purchase basket, adoption rates, and purchase criteria
- Exhibits12: Overview on criticality of inputs and factors of differentiation
- Exhibits13: Overview on factors of disruption
- Exhibits14: Impact of drivers and challenges in 2024 and 2029
- Exhibits15: Parent Market
- Exhibits16: Data Table on - Parent Market
- Exhibits17: Market characteristics analysis
- Exhibits18: Value chain analysis
- Exhibits19: Offerings of companies included in the market definition
- Exhibits20: Market segments
- Exhibits21: Chart on Global - Market size and forecast 2024-2029 ($ million)
- Exhibits22: Data Table on Global - Market size and forecast 2024-2029 ($ million)
- Exhibits23: Chart on Global Market: Year-over-year growth 2024-2029 (%)
- Exhibits24: Data Table on Global Market: Year-over-year growth 2024-2029 (%)
- Exhibits25: Historic Market Size - Data Table on Global Orthodontic Market 2019 - 2023 ($ million)
- Exhibits26: Historic Market Size - Product Type Segment 2019 - 2023 ($ million)
- Exhibits27: Historic Market Size - End-user Segment 2019 - 2023 ($ million)
- Exhibits28: Historic Market Size - Type Segment 2019 - 2023 ($ million)
- Exhibits29: Historic Market Size - Geography Segment 2019 - 2023 ($ million)
- Exhibits30: Historic Market Size - Country Segment 2019 - 2023 ($ million)
- Exhibits31: Five forces analysis - Comparison between 2024 and 2029
- Exhibits32: Bargaining power of buyers - Impact of key factors 2024 and 2029
- Exhibits33: Bargaining power of suppliers - Impact of key factors in 2024 and 2029
- Exhibits34: Threat of new entrants - Impact of key factors in 2024 and 2029
- Exhibits35: Threat of substitutes - Impact of key factors in 2024 and 2029
- Exhibits36: Threat of rivalry - Impact of key factors in 2024 and 2029
- Exhibits37: Chart on Market condition - Five forces 2024 and 2029
- Exhibits38: Chart on Product Type - Market share 2024-2029 (%)
- Exhibits39: Data Table on Product Type - Market share 2024-2029 (%)
- Exhibits40: Chart on Comparison by Product Type
- Exhibits41: Data Table on Comparison by Product Type
- Exhibits42: Chart on Supplies - Market size and forecast 2024-2029 ($ million)
- Exhibits43: Data Table on Supplies - Market size and forecast 2024-2029 ($ million)
- Exhibits44: Chart on Supplies - Year-over-year growth 2024-2029 (%)
- Exhibits45: Data Table on Supplies - Year-over-year growth 2024-2029 (%)
- Exhibits46: Chart on Instruments - Market size and forecast 2024-2029 ($ million)
- Exhibits47: Data Table on Instruments - Market size and forecast 2024-2029 ($ million)
- Exhibits48: Chart on Instruments - Year-over-year growth 2024-2029 (%)
- Exhibits49: Data Table on Instruments - Year-over-year growth 2024-2029 (%)
- Exhibits50: Market opportunity by Product Type ($ million)
- Exhibits51: Data Table on Market opportunity by Product Type ($ million)
- Exhibits52: Chart on End-user - Market share 2024-2029 (%)
- Exhibits53: Data Table on End-user - Market share 2024-2029 (%)
- Exhibits54: Chart on Comparison by End-user
- Exhibits55: Data Table on Comparison by End-user
- Exhibits56: Chart on Dental clinics - Market size and forecast 2024-2029 ($ million)
- Exhibits57: Data Table on Dental clinics - Market size and forecast 2024-2029 ($ million)
- Exhibits58: Chart on Dental clinics - Year-over-year growth 2024-2029 (%)
- Exhibits59: Data Table on Dental clinics - Year-over-year growth 2024-2029 (%)
- Exhibits60: Chart on Hospitals - Market size and forecast 2024-2029 ($ million)
- Exhibits61: Data Table on Hospitals - Market size and forecast 2024-2029 ($ million)
- Exhibits62: Chart on Hospitals - Year-over-year growth 2024-2029 (%)
- Exhibits63: Data Table on Hospitals - Year-over-year growth 2024-2029 (%)
- Exhibits64: Chart on Others - Market size and forecast 2024-2029 ($ million)
- Exhibits65: Data Table on Others - Market size and forecast 2024-2029 ($ million)
- Exhibits66: Chart on Others - Year-over-year growth 2024-2029 (%)
- Exhibits67: Data Table on Others - Year-over-year growth 2024-2029 (%)
- Exhibits68: Market opportunity by End-user ($ million)
- Exhibits69: Data Table on Market opportunity by End-user ($ million)
- Exhibits70: Chart on Type - Market share 2024-2029 (%)
- Exhibits71: Data Table on Type - Market share 2024-2029 (%)
- Exhibits72: Chart on Comparison by Type
- Exhibits73: Data Table on Comparison by Type
- Exhibits74: Chart on Traditional braces - Market size and forecast 2024-2029 ($ million)
- Exhibits75: Data Table on Traditional braces - Market size and forecast 2024-2029 ($ million)
- Exhibits76: Chart on Traditional braces - Year-over-year growth 2024-2029 (%)
- Exhibits77: Data Table on Traditional braces - Year-over-year growth 2024-2029 (%)
- Exhibits78: Chart on Clear aligners - Market size and forecast 2024-2029 ($ million)
- Exhibits79: Data Table on Clear aligners - Market size and forecast 2024-2029 ($ million)
- Exhibits80: Chart on Clear aligners - Year-over-year growth 2024-2029 (%)
- Exhibits81: Data Table on Clear aligners - Year-over-year growth 2024-2029 (%)
- Exhibits82: Chart on Self-ligating brackets - Market size and forecast 2024-2029 ($ million)
- Exhibits83: Data Table on Self-ligating brackets - Market size and forecast 2024-2029 ($ million)
- Exhibits84: Chart on Self-ligating brackets - Year-over-year growth 2024-2029 (%)
- Exhibits85: Data Table on Self-ligating brackets - Year-over-year growth 2024-2029 (%)
- Exhibits86: Chart on Ceramic brackets - Market size and forecast 2024-2029 ($ million)
- Exhibits87: Data Table on Ceramic brackets - Market size and forecast 2024-2029 ($ million)
- Exhibits88: Chart on Ceramic brackets - Year-over-year growth 2024-2029 (%)
- Exhibits89: Data Table on Ceramic brackets - Year-over-year growth 2024-2029 (%)
- Exhibits90: Chart on Lingual brackets - Market size and forecast 2024-2029 ($ million)
- Exhibits91: Data Table on Lingual brackets - Market size and forecast 2024-2029 ($ million)
- Exhibits92: Chart on Lingual brackets - Year-over-year growth 2024-2029 (%)
- Exhibits93: Data Table on Lingual brackets - Year-over-year growth 2024-2029 (%)
- Exhibits94: Market opportunity by Type ($ million)
- Exhibits95: Data Table on Market opportunity by Type ($ million)
- Exhibits96: Analysis of price sensitivity, lifecycle, customer purchase basket, adoption rates, and purchase criteria
- Exhibits97: Chart on Market share By Geographical Landscape 2024-2029 (%)
- Exhibits98: Data Table on Market share By Geographical Landscape 2024-2029 (%)
- Exhibits99: Chart on Geographic comparison
- Exhibits100: Data Table on Geographic comparison
- Exhibits101: Chart on North America - Market size and forecast 2024-2029 ($ million)
- Exhibits102: Data Table on North America - Market size and forecast 2024-2029 ($ million)
- Exhibits103: Chart on North America - Year-over-year growth 2024-2029 (%)
- Exhibits104: Data Table on North America - Year-over-year growth 2024-2029 (%)
- Exhibits105: Chart on Europe - Market size and forecast 2024-2029 ($ million)
- Exhibits106: Data Table on Europe - Market size and forecast 2024-2029 ($ million)
- Exhibits107: Chart on Europe - Year-over-year growth 2024-2029 (%)
- Exhibits108: Data Table on Europe - Year-over-year growth 2024-2029 (%)
- Exhibits109: Chart on Asia - Market size and forecast 2024-2029 ($ million)
- Exhibits110: Data Table on Asia - Market size and forecast 2024-2029 ($ million)
- Exhibits111: Chart on Asia - Year-over-year growth 2024-2029 (%)
- Exhibits112: Data Table on Asia - Year-over-year growth 2024-2029 (%)
- Exhibits113: Chart on Rest of World (ROW) - Market size and forecast 2024-2029 ($ million)
- Exhibits114: Data Table on Rest of World (ROW) - Market size and forecast 2024-2029 ($ million)
- Exhibits115: Chart on Rest of World (ROW) - Year-over-year growth 2024-2029 (%)
- Exhibits116: Data Table on Rest of World (ROW) - Year-over-year growth 2024-2029 (%)
- Exhibits117: Chart on US - Market size and forecast 2024-2029 ($ million)
- Exhibits118: Data Table on US - Market size and forecast 2024-2029 ($ million)
- Exhibits119: Chart on US - Year-over-year growth 2024-2029 (%)
- Exhibits120: Data Table on US - Year-over-year growth 2024-2029 (%)
- Exhibits121: Chart on China - Market size and forecast 2024-2029 ($ million)
- Exhibits122: Data Table on China - Market size and forecast 2024-2029 ($ million)
- Exhibits123: Chart on China - Year-over-year growth 2024-2029 (%)
- Exhibits124: Data Table on China - Year-over-year growth 2024-2029 (%)
- Exhibits125: Chart on Germany - Market size and forecast 2024-2029 ($ million)
- Exhibits126: Data Table on Germany - Market size and forecast 2024-2029 ($ million)
- Exhibits127: Chart on Germany - Year-over-year growth 2024-2029 (%)
- Exhibits128: Data Table on Germany - Year-over-year growth 2024-2029 (%)
- Exhibits129: Chart on Canada - Market size and forecast 2024-2029 ($ million)
- Exhibits130: Data Table on Canada - Market size and forecast 2024-2029 ($ million)
- Exhibits131: Chart on Canada - Year-over-year growth 2024-2029 (%)
- Exhibits132: Data Table on Canada - Year-over-year growth 2024-2029 (%)
- Exhibits133: Chart on France - Market size and forecast 2024-2029 ($ million)
- Exhibits134: Data Table on France - Market size and forecast 2024-2029 ($ million)
- Exhibits135: Chart on France - Year-over-year growth 2024-2029 (%)
- Exhibits136: Data Table on France - Year-over-year growth 2024-2029 (%)
- Exhibits137: Chart on Brazil - Market size and forecast 2024-2029 ($ million)
- Exhibits138: Data Table on Brazil - Market size and forecast 2024-2029 ($ million)
- Exhibits139: Chart on Brazil - Year-over-year growth 2024-2029 (%)
- Exhibits140: Data Table on Brazil - Year-over-year growth 2024-2029 (%)
- Exhibits141: Chart on Japan - Market size and forecast 2024-2029 ($ million)
- Exhibits142: Data Table on Japan - Market size and forecast 2024-2029 ($ million)
- Exhibits143: Chart on Japan - Year-over-year growth 2024-2029 (%)
- Exhibits144: Data Table on Japan - Year-over-year growth 2024-2029 (%)
- Exhibits145: Chart on UK - Market size and forecast 2024-2029 ($ million)
- Exhibits146: Data Table on UK - Market size and forecast 2024-2029 ($ million)
- Exhibits147: Chart on UK - Year-over-year growth 2024-2029 (%)
- Exhibits148: Data Table on UK - Year-over-year growth 2024-2029 (%)
- Exhibits149: Chart on South Korea - Market size and forecast 2024-2029 ($ million)
- Exhibits150: Data Table on South Korea - Market size and forecast 2024-2029 ($ million)
- Exhibits151: Chart on South Korea - Year-over-year growth 2024-2029 (%)
- Exhibits152: Data Table on South Korea - Year-over-year growth 2024-2029 (%)
- Exhibits153: Chart on India - Market size and forecast 2024-2029 ($ million)
- Exhibits154: Data Table on India - Market size and forecast 2024-2029 ($ million)
- Exhibits155: Chart on India - Year-over-year growth 2024-2029 (%)
- Exhibits156: Data Table on India - Year-over-year growth 2024-2029 (%)
- Exhibits157: Market opportunity By Geographical Landscape ($ million)
- Exhibits158: Data Tables on Market opportunity By Geographical Landscape ($ million)
- Exhibits159: Impact of drivers and challenges in 2024 and 2029
- Exhibits160: Overview on criticality of inputs and factors of differentiation
- Exhibits161: Overview on factors of disruption
- Exhibits162: Impact of key risks on business
- Exhibits163: Companies covered
- Exhibits164: Company ranking index
- Exhibits165: Matrix on companies position and classification
- Exhibits166: 3M Co. - Overview
- Exhibits167: 3M Co. - Business segments
- Exhibits168: 3M Co. - Key news
- Exhibits169: 3M Co. - Key offerings
- Exhibits170: 3M Co. - Segment focus
- Exhibits171: SWOT
- Exhibits172: Align Technology Inc. - Overview
- Exhibits173: Align Technology Inc. - Business segments
- Exhibits174: Align Technology Inc. - Key news
- Exhibits175: Align Technology Inc. - Key offerings
- Exhibits176: Align Technology Inc. - Segment focus
- Exhibits177: SWOT
- Exhibits178: American Orthodontics - Overview
- Exhibits179: American Orthodontics - Product / Service
- Exhibits180: American Orthodontics - Key offerings
- Exhibits181: SWOT
- Exhibits182: Carestream Dental LLC - Overview
- Exhibits183: Carestream Dental LLC - Product / Service
- Exhibits184: Carestream Dental LLC - Key offerings
- Exhibits185: SWOT
- Exhibits186: DENTAURUM GmbH and Co. KG - Overview
- Exhibits187: DENTAURUM GmbH and Co. KG - Product / Service
- Exhibits188: DENTAURUM GmbH and Co. KG - Key offerings
- Exhibits189: SWOT
- Exhibits190: Dentsply Sirona Inc. - Overview
- Exhibits191: Dentsply Sirona Inc. - Business segments
- Exhibits192: Dentsply Sirona Inc. - Key news
- Exhibits193: Dentsply Sirona Inc. - Key offerings
- Exhibits194: Dentsply Sirona Inc. - Segment focus
- Exhibits195: SWOT
- Exhibits196: Envista Holdings Corp. - Overview
- Exhibits197: Envista Holdings Corp. - Business segments
- Exhibits198: Envista Holdings Corp. - Key news
- Exhibits199: Envista Holdings Corp. - Key offerings
- Exhibits200: Envista Holdings Corp. - Segment focus
- Exhibits201: SWOT
- Exhibits202: G and H Orthodontics - Overview
- Exhibits203: G and H Orthodontics - Product / Service
- Exhibits204: G and H Orthodontics - Key offerings
- Exhibits205: SWOT
- Exhibits206: Geniova Technologies SL - Overview
- Exhibits207: Geniova Technologies SL - Product / Service
- Exhibits208: Geniova Technologies SL - Key offerings
- Exhibits209: SWOT
- Exhibits210: Great Lakes Dental Technologies Ltd. - Overview
- Exhibits211: Great Lakes Dental Technologies Ltd. - Product / Service
- Exhibits212: Great Lakes Dental Technologies Ltd. - Key offerings
- Exhibits213: SWOT
- Exhibits214: Henry Schein Inc. - Overview
- Exhibits215: Henry Schein Inc. - Business segments
- Exhibits216: Henry Schein Inc. - Key offerings
- Exhibits217: Henry Schein Inc. - Segment focus
- Exhibits218: SWOT
- Exhibits219: Rocky Mountain Orthodontics - Overview
- Exhibits220: Rocky Mountain Orthodontics - Product / Service
- Exhibits221: Rocky Mountain Orthodontics - Key offerings
- Exhibits222: SWOT
- Exhibits223: SmileDirectClub Inc. - Overview
- Exhibits224: SmileDirectClub Inc. - Product / Service
- Exhibits225: SmileDirectClub Inc. - Key offerings
- Exhibits226: SWOT
- Exhibits227: TP Orthodontics Inc. - Overview
- Exhibits228: TP Orthodontics Inc. - Product / Service
- Exhibits229: TP Orthodontics Inc. - Key offerings
- Exhibits230: SWOT
- Exhibits231: Ultradent Products Inc. - Overview
- Exhibits232: Ultradent Products Inc. - Product / Service
- Exhibits233: Ultradent Products Inc. - Key offerings
- Exhibits234: SWOT
- Exhibits235: Inclusions checklist
- Exhibits236: Exclusions checklist
- Exhibits237: Currency conversion rates for US$
- Exhibits238: Research methodology
- Exhibits239: Information sources
- Exhibits240: Data validation
- Exhibits241: Validation techniques employed for market sizing
- Exhibits242: Data synthesis
- Exhibits243: 360 degree market analysis
- Exhibits244: List of abbreviations
The orthodontic market is forecasted to grow by USD 21373.9 mn during 2024-2029, accelerating at a CAGR of 26.3% during the forecast period. The report on the orthodontic market provides a holistic analysis, market size and forecast, trends, growth drivers, and challenges, as well as vendor analysis covering around 25 vendors.
The report offers an up-to-date analysis regarding the current market scenario, the latest trends and drivers, and the overall market environment. The market is driven by high prevalence of oral disorders, rising awareness of orthodontic treatment, and growing number of dental schools and dentists.
| Market Scope | |
|---|---|
| Base Year | 2025 |
| End Year | 2029 |
| Series Year | 2025-2029 |
| Growth Momentum | Accelerate |
| YOY 2025 | 20.5% |
| CAGR | 26.3% |
| Incremental Value | $21373.9 mn |
The study was conducted using an objective combination of primary and secondary information including inputs from key participants in the industry. The report contains a comprehensive market size data, segment with regional analysis and vendor landscape in addition to an analysis of the key companies. Reports have historic and forecast data.
Technavio's orthodontic market is segmented as below:
By Product Type
- Supplies
- Instruments
By End-user
- Dental clinics
- Hospitals
- Others
By Type
- Traditional braces
- Clear aligners
- Self-ligating brackets
- Ceramic brackets
- Lingual brackets
By Geographical Landscape
- North America
- Europe
- Asia
- Rest of World (ROW)
This study identifies the technological advances in orthodontic treatment as one of the prime reasons driving the orthodontic market growth during the next few years. Also, rising cases of malocclusion to boost sales of orthodontic products and new orthodontic product launches will lead to sizable demand in the market.
The report on the orthodontic market covers the following areas:
- Orthodontic Market sizing
- Orthodontic Market forecast
- Orthodontic Market industry analysis
The robust vendor analysis is designed to help clients improve their market position, and in line with this, this report provides a detailed analysis of several leading orthodontic market vendors that include 3M Co., Aditek Orthodontics, Align Technology Inc., American Orthodontics, Carestream Dental LLC, DENTAURUM GmbH and Co. KG, Dentsply Sirona Inc., Envista Holdings Corp., G and H Orthodontics, Geniova Technologies SL, Great Lakes Dental Technologies Ltd., Henry Schein Inc., JJ Orthodontics Pvt. Ltd., Matt Orthodontics LLC, Rocky Mountain Orthodontics, Shanghai Smartee Dental Technology Co. Ltd., Sino Ortho Ltd., SmileDirectClub Inc., TP Orthodontics Inc., and Ultradent Products Inc.. Also, the orthodontic market analysis report includes information on upcoming trends and challenges that will influence market growth. This is to help companies strategize and leverage all forthcoming growth opportunities.
The publisher presents a detailed picture of the market by the way of study, synthesis, and summation of data from multiple sources by an analysis of key parameters such as profit, pricing, competition, and promotions. It presents various market facets by identifying the key industry influencers. The data presented is comprehensive, reliable, and a result of extensive primary and secondary research. The market research reports provide a complete competitive landscape and an in-depth vendor selection methodology and analysis using qualitative and quantitative research to forecast accurate market growth.
Table of Contents
1 Executive Summary
- 1.1 Market overview
- Executive Summary - Chart on Market Overview
- Executive Summary - Data Table on Market Overview
- Executive Summary - Chart on Global Market Characteristics
- Executive Summary - Chart on Market By Geographical Landscape
- Executive Summary - Chart on Market Segmentation by Product Type
- Executive Summary - Chart on Market Segmentation by End-user
- Executive Summary - Chart on Market Segmentation by Type
- Executive Summary - Chart on Incremental Growth
- Executive Summary - Data Table on Incremental Growth
- Executive Summary - Chart on Company Market Positioning
2 Technavio Analysis
- 2.1 Analysis of price sensitivity, lifecycle, customer purchase basket, adoption rates, and purchase criteria
- Analysis of price sensitivity, lifecycle, customer purchase basket, adoption rates, and purchase criteria
- 2.2 Criticality of inputs and Factors of differentiation
- Overview on criticality of inputs and factors of differentiation
- 2.3 Factors of disruption
- Overview on factors of disruption
- 2.4 Impact of drivers and challenges
- Impact of drivers and challenges in 2024 and 2029
3 Market Landscape
- 3.1 Market ecosystem
- Parent Market
- Data Table on - Parent Market
- 3.2 Market characteristics
- Market characteristics analysis
- 3.3 Value chain analysis
- Value chain analysis
4 Market Sizing
- 4.1 Market definition
- Offerings of companies included in the market definition
- 4.2 Market segment analysis
- Market segments
- 4.3 Market size 2024
- 4.4 Market outlook: Forecast for 2024-2029
- Chart on Global - Market size and forecast 2024-2029 ($ million)
- Data Table on Global - Market size and forecast 2024-2029 ($ million)
- Chart on Global Market: Year-over-year growth 2024-2029 (%)
- Data Table on Global Market: Year-over-year growth 2024-2029 (%)
5 Historic Market Size
- 5.1 Global Orthodontic Market 2019 - 2023
- Historic Market Size - Data Table on Global Orthodontic Market 2019 - 2023 ($ million)
- 5.2 Product Type segment analysis 2019 - 2023
- Historic Market Size - Product Type Segment 2019 - 2023 ($ million)
- 5.3 End-user segment analysis 2019 - 2023
- Historic Market Size - End-user Segment 2019 - 2023 ($ million)
- 5.4 Type segment analysis 2019 - 2023
- Historic Market Size - Type Segment 2019 - 2023 ($ million)
- 5.5 Geography segment analysis 2019 - 2023
- Historic Market Size - Geography Segment 2019 - 2023 ($ million)
- 5.6 Country segment analysis 2019 - 2023
- Historic Market Size - Country Segment 2019 - 2023 ($ million)
6 Qualitative Analysis
- 6.1 Impact of AI in global orthodontic market
7 Five Forces Analysis
- 7.1 Five forces summary
- Five forces analysis - Comparison between 2024 and 2029
- 7.2 Bargaining power of buyers
- Bargaining power of buyers - Impact of key factors 2024 and 2029
- 7.3 Bargaining power of suppliers
- Bargaining power of suppliers - Impact of key factors in 2024 and 2029
- 7.4 Threat of new entrants
- Threat of new entrants - Impact of key factors in 2024 and 2029
- 7.5 Threat of substitutes
- Threat of substitutes - Impact of key factors in 2024 and 2029
- 7.6 Threat of rivalry
- Threat of rivalry - Impact of key factors in 2024 and 2029
- 7.7 Market condition
- Chart on Market condition - Five forces 2024 and 2029
8 Market Segmentation by Product Type
- 8.1 Market segments
- Chart on Product Type - Market share 2024-2029 (%)
- Data Table on Product Type - Market share 2024-2029 (%)
- 8.2 Comparison by Product Type
- Chart on Comparison by Product Type
- Data Table on Comparison by Product Type
- 8.3 Supplies - Market size and forecast 2024-2029
- Chart on Supplies - Market size and forecast 2024-2029 ($ million)
- Data Table on Supplies - Market size and forecast 2024-2029 ($ million)
- Chart on Supplies - Year-over-year growth 2024-2029 (%)
- Data Table on Supplies - Year-over-year growth 2024-2029 (%)
- 8.4 Instruments - Market size and forecast 2024-2029
- Chart on Instruments - Market size and forecast 2024-2029 ($ million)
- Data Table on Instruments - Market size and forecast 2024-2029 ($ million)
- Chart on Instruments - Year-over-year growth 2024-2029 (%)
- Data Table on Instruments - Year-over-year growth 2024-2029 (%)
- 8.5 Market opportunity by Product Type
- Market opportunity by Product Type ($ million)
- Data Table on Market opportunity by Product Type ($ million)
9 Market Segmentation by End-user
- 9.1 Market segments
- Chart on End-user - Market share 2024-2029 (%)
- Data Table on End-user - Market share 2024-2029 (%)
- 9.2 Comparison by End-user
- Chart on Comparison by End-user
- Data Table on Comparison by End-user
- 9.3 Dental clinics - Market size and forecast 2024-2029
- Chart on Dental clinics - Market size and forecast 2024-2029 ($ million)
- Data Table on Dental clinics - Market size and forecast 2024-2029 ($ million)
- Chart on Dental clinics - Year-over-year growth 2024-2029 (%)
- Data Table on Dental clinics - Year-over-year growth 2024-2029 (%)
- 9.4 Hospitals - Market size and forecast 2024-2029
- Chart on Hospitals - Market size and forecast 2024-2029 ($ million)
- Data Table on Hospitals - Market size and forecast 2024-2029 ($ million)
- Chart on Hospitals - Year-over-year growth 2024-2029 (%)
- Data Table on Hospitals - Year-over-year growth 2024-2029 (%)
- 9.5 Others - Market size and forecast 2024-2029
- Chart on Others - Market size and forecast 2024-2029 ($ million)
- Data Table on Others - Market size and forecast 2024-2029 ($ million)
- Chart on Others - Year-over-year growth 2024-2029 (%)
- Data Table on Others - Year-over-year growth 2024-2029 (%)
- 9.6 Market opportunity by End-user
- Market opportunity by End-user ($ million)
- Data Table on Market opportunity by End-user ($ million)
10 Market Segmentation by Type
- 10.1 Market segments
- Chart on Type - Market share 2024-2029 (%)
- Data Table on Type - Market share 2024-2029 (%)
- 10.2 Comparison by Type
- Chart on Comparison by Type
- Data Table on Comparison by Type
- 10.3 Traditional braces - Market size and forecast 2024-2029
- Chart on Traditional braces - Market size and forecast 2024-2029 ($ million)
- Data Table on Traditional braces - Market size and forecast 2024-2029 ($ million)
- Chart on Traditional braces - Year-over-year growth 2024-2029 (%)
- Data Table on Traditional braces - Year-over-year growth 2024-2029 (%)
- 10.4 Clear aligners - Market size and forecast 2024-2029
- Chart on Clear aligners - Market size and forecast 2024-2029 ($ million)
- Data Table on Clear aligners - Market size and forecast 2024-2029 ($ million)
- Chart on Clear aligners - Year-over-year growth 2024-2029 (%)
- Data Table on Clear aligners - Year-over-year growth 2024-2029 (%)
- 10.5 Self-ligating brackets - Market size and forecast 2024-2029
- Chart on Self-ligating brackets - Market size and forecast 2024-2029 ($ million)
- Data Table on Self-ligating brackets - Market size and forecast 2024-2029 ($ million)
- Chart on Self-ligating brackets - Year-over-year growth 2024-2029 (%)
- Data Table on Self-ligating brackets - Year-over-year growth 2024-2029 (%)
- 10.6 Ceramic brackets - Market size and forecast 2024-2029
- Chart on Ceramic brackets - Market size and forecast 2024-2029 ($ million)
- Data Table on Ceramic brackets - Market size and forecast 2024-2029 ($ million)
- Chart on Ceramic brackets - Year-over-year growth 2024-2029 (%)
- Data Table on Ceramic brackets - Year-over-year growth 2024-2029 (%)
- 10.7 Lingual brackets - Market size and forecast 2024-2029
- Chart on Lingual brackets - Market size and forecast 2024-2029 ($ million)
- Data Table on Lingual brackets - Market size and forecast 2024-2029 ($ million)
- Chart on Lingual brackets - Year-over-year growth 2024-2029 (%)
- Data Table on Lingual brackets - Year-over-year growth 2024-2029 (%)
- 10.8 Market opportunity by Type
- Market opportunity by Type ($ million)
- Data Table on Market opportunity by Type ($ million)
11 Customer Landscape
- 11.1 Customer landscape overview
- Analysis of price sensitivity, lifecycle, customer purchase basket, adoption rates, and purchase criteria
12 Geographic Landscape
- 12.1 Geographic segmentation
- Chart on Market share By Geographical Landscape 2024-2029 (%)
- Data Table on Market share By Geographical Landscape 2024-2029 (%)
- 12.2 Geographic comparison
- Chart on Geographic comparison
- Data Table on Geographic comparison
- 12.3 North America - Market size and forecast 2024-2029
- Chart on North America - Market size and forecast 2024-2029 ($ million)
- Data Table on North America - Market size and forecast 2024-2029 ($ million)
- Chart on North America - Year-over-year growth 2024-2029 (%)
- Data Table on North America - Year-over-year growth 2024-2029 (%)
- 12.4 Europe - Market size and forecast 2024-2029
- Chart on Europe - Market size and forecast 2024-2029 ($ million)
- Data Table on Europe - Market size and forecast 2024-2029 ($ million)
- Chart on Europe - Year-over-year growth 2024-2029 (%)
- Data Table on Europe - Year-over-year growth 2024-2029 (%)
- 12.5 Asia - Market size and forecast 2024-2029
- Chart on Asia - Market size and forecast 2024-2029 ($ million)
- Data Table on Asia - Market size and forecast 2024-2029 ($ million)
- Chart on Asia - Year-over-year growth 2024-2029 (%)
- Data Table on Asia - Year-over-year growth 2024-2029 (%)
- 12.6 Rest of World (ROW) - Market size and forecast 2024-2029
- Chart on Rest of World (ROW) - Market size and forecast 2024-2029 ($ million)
- Data Table on Rest of World (ROW) - Market size and forecast 2024-2029 ($ million)
- Chart on Rest of World (ROW) - Year-over-year growth 2024-2029 (%)
- Data Table on Rest of World (ROW) - Year-over-year growth 2024-2029 (%)
- 12.7 US - Market size and forecast 2024-2029
- Chart on US - Market size and forecast 2024-2029 ($ million)
- Data Table on US - Market size and forecast 2024-2029 ($ million)
- Chart on US - Year-over-year growth 2024-2029 (%)
- Data Table on US - Year-over-year growth 2024-2029 (%)
- 12.8 China - Market size and forecast 2024-2029
- Chart on China - Market size and forecast 2024-2029 ($ million)
- Data Table on China - Market size and forecast 2024-2029 ($ million)
- Chart on China - Year-over-year growth 2024-2029 (%)
- Data Table on China - Year-over-year growth 2024-2029 (%)
- 12.9 Germany - Market size and forecast 2024-2029
- Chart on Germany - Market size and forecast 2024-2029 ($ million)
- Data Table on Germany - Market size and forecast 2024-2029 ($ million)
- Chart on Germany - Year-over-year growth 2024-2029 (%)
- Data Table on Germany - Year-over-year growth 2024-2029 (%)
- 12.10 Canada - Market size and forecast 2024-2029
- Chart on Canada - Market size and forecast 2024-2029 ($ million)
- Data Table on Canada - Market size and forecast 2024-2029 ($ million)
- Chart on Canada - Year-over-year growth 2024-2029 (%)
- Data Table on Canada - Year-over-year growth 2024-2029 (%)
- 12.11 France - Market size and forecast 2024-2029
- Chart on France - Market size and forecast 2024-2029 ($ million)
- Data Table on France - Market size and forecast 2024-2029 ($ million)
- Chart on France - Year-over-year growth 2024-2029 (%)
- Data Table on France - Year-over-year growth 2024-2029 (%)
- 12.12 Brazil - Market size and forecast 2024-2029
- Chart on Brazil - Market size and forecast 2024-2029 ($ million)
- Data Table on Brazil - Market size and forecast 2024-2029 ($ million)
- Chart on Brazil - Year-over-year growth 2024-2029 (%)
- Data Table on Brazil - Year-over-year growth 2024-2029 (%)
- 12.13 Japan - Market size and forecast 2024-2029
- Chart on Japan - Market size and forecast 2024-2029 ($ million)
- Data Table on Japan - Market size and forecast 2024-2029 ($ million)
- Chart on Japan - Year-over-year growth 2024-2029 (%)
- Data Table on Japan - Year-over-year growth 2024-2029 (%)
- 12.14 UK - Market size and forecast 2024-2029
- Chart on UK - Market size and forecast 2024-2029 ($ million)
- Data Table on UK - Market size and forecast 2024-2029 ($ million)
- Chart on UK - Year-over-year growth 2024-2029 (%)
- Data Table on UK - Year-over-year growth 2024-2029 (%)
- 12.15 South Korea - Market size and forecast 2024-2029
- Chart on South Korea - Market size and forecast 2024-2029 ($ million)
- Data Table on South Korea - Market size and forecast 2024-2029 ($ million)
- Chart on South Korea - Year-over-year growth 2024-2029 (%)
- Data Table on South Korea - Year-over-year growth 2024-2029 (%)
- 12.16 India - Market size and forecast 2024-2029
- Chart on India - Market size and forecast 2024-2029 ($ million)
- Data Table on India - Market size and forecast 2024-2029 ($ million)
- Chart on India - Year-over-year growth 2024-2029 (%)
- Data Table on India - Year-over-year growth 2024-2029 (%)
- 12.17 Market opportunity By Geographical Landscape
- Market opportunity By Geographical Landscape ($ million)
- Data Tables on Market opportunity By Geographical Landscape ($ million)
13 Drivers, Challenges, and Opportunity/Restraints
- 13.1 Market drivers
- 13.2 Market challenges
- 13.3 Impact of drivers and challenges
- Impact of drivers and challenges in 2024 and 2029
- 13.4 Market opportunities/restraints
14 Competitive Landscape
- 14.1 Overview
- 14.2 Competitive Landscape
- Overview on criticality of inputs and factors of differentiation
- 14.3 Landscape disruption
- Overview on factors of disruption
- 14.4 Industry risks
- Impact of key risks on business
15 Competitive Analysis
- 15.1 Companies profiled
- Companies covered
- 15.2 Company ranking index
- Company ranking index
- 15.3 Market positioning of companies
- Matrix on companies position and classification
- 3M Co.
- 3M Co. - Overview
- 3M Co. - Business segments
- 3M Co. - Key news
- 3M Co. - Key offerings
- 3M Co. - Segment focus
- SWOT
- 15.5 Align Technology Inc.
- Align Technology Inc. - Overview
- Align Technology Inc. - Business segments
- Align Technology Inc. - Key news
- Align Technology Inc. - Key offerings
- Align Technology Inc. - Segment focus
- SWOT
- 15.6 American Orthodontics
- American Orthodontics - Overview
- American Orthodontics - Product / Service
- American Orthodontics - Key offerings
- SWOT
- 15.7 Carestream Dental LLC
- Carestream Dental LLC - Overview
- Carestream Dental LLC - Product / Service
- Carestream Dental LLC - Key offerings
- SWOT
- 15.8 DENTAURUM GmbH and Co. KG
- DENTAURUM GmbH and Co. KG - Overview
- DENTAURUM GmbH and Co. KG - Product / Service
- DENTAURUM GmbH and Co. KG - Key offerings
- SWOT
- 15.9 Dentsply Sirona Inc.
- Dentsply Sirona Inc. - Overview
- Dentsply Sirona Inc. - Business segments
- Dentsply Sirona Inc. - Key news
- Dentsply Sirona Inc. - Key offerings
- Dentsply Sirona Inc. - Segment focus
- SWOT
- 15.10 Envista Holdings Corp.
- Envista Holdings Corp. - Overview
- Envista Holdings Corp. - Business segments
- Envista Holdings Corp. - Key news
- Envista Holdings Corp. - Key offerings
- Envista Holdings Corp. - Segment focus
- SWOT
- 15.11 G and H Orthodontics
- G and H Orthodontics - Overview
- G and H Orthodontics - Product / Service
- G and H Orthodontics - Key offerings
- SWOT
- 15.12 Geniova Technologies SL
- Geniova Technologies SL - Overview
- Geniova Technologies SL - Product / Service
- Geniova Technologies SL - Key offerings
- SWOT
- 15.13 Great Lakes Dental Technologies Ltd.
- Great Lakes Dental Technologies Ltd. - Overview
- Great Lakes Dental Technologies Ltd. - Product / Service
- Great Lakes Dental Technologies Ltd. - Key offerings
- SWOT
- 15.14 Henry Schein Inc.
- Henry Schein Inc. - Overview
- Henry Schein Inc. - Business segments
- Henry Schein Inc. - Key offerings
- Henry Schein Inc. - Segment focus
- SWOT
- 15.15 Rocky Mountain Orthodontics
- Rocky Mountain Orthodontics - Overview
- Rocky Mountain Orthodontics - Product / Service
- Rocky Mountain Orthodontics - Key offerings
- SWOT
- 15.16 SmileDirectClub Inc.
- SmileDirectClub Inc. - Overview
- SmileDirectClub Inc. - Product / Service
- SmileDirectClub Inc. - Key offerings
- SWOT
- 15.17 TP Orthodontics Inc.
- TP Orthodontics Inc. - Overview
- TP Orthodontics Inc. - Product / Service
- TP Orthodontics Inc. - Key offerings
- SWOT
- 15.18 Ultradent Products Inc.
- Ultradent Products Inc. - Overview
- Ultradent Products Inc. - Product / Service
- Ultradent Products Inc. - Key offerings
- SWOT
16 Appendix
- 16.1 Scope of the report
- 16.2 Inclusions and exclusions checklist
- Inclusions checklist
- Exclusions checklist
- 16.3 Currency conversion rates for US$
- Currency conversion rates for US$
- 16.4 Research methodology
- Research methodology
- 16.5 Data procurement
- Information sources
- 16.6 Data validation
- Data validation
- 16.7 Validation techniques employed for market sizing
- Validation techniques employed for market sizing
- 16.8 Data synthesis
- Data synthesis
- 16.9 360 degree market analysis
- 360 degree market analysis
- 16.10 List of abbreviations
- List of abbreviations
