|
|
市場調査レポート
商品コード
1559270
マイクロ流体技術の世界市場、2024~2028年Global Microfluidics Technology Market 2024-2028 |
||||||

|
|||||||
カスタマイズ可能
|
|||||||


| マイクロ流体技術の世界市場、2024~2028年 |
|
出版日: 2024年08月14日
発行: TechNavio
ページ情報: 英文 174 Pages
納期: 即納可能
|

全表示
- 概要
- 図表
- 目次
マイクロ流体技術市場、2024~2028年
マイクロ流体技術市場は2023~2028年に314億7,490万米ドル、予測期間中のCAGRは20.28%で成長すると予測されます。当レポートでは、マイクロ流体技術市場の全体的な分析、市場規模・予測、動向、成長促進要因、課題、約25のベンダーを網羅したベンダー分析などを掲載しています。
現在の市場シナリオ、最新動向と促進要因、市場環境全体に関する最新分析を提供しています。市場は、分子生物学における用途の増加、DNAシーケンシングの進歩によるマイクロ流体技術の使用の増加、がん罹患率の増加による診断とドラッグデリバリーの新しい方法の需要によって牽引されています。
| 市場範囲 | |
|---|---|
| 基準年 | 2024年 |
| 終了年 | 2028年 |
| 予測期間 | 2024~2028年 |
| 成長モメンタム | 加速 |
| 前年比[2024年] | 17.17% |
| CAGR | 20.28% |
| 増分額 | 314億7,490万米ドル |
本調査では、今後数年間のマイクロ流体技術市場成長を牽引する主要要因の一つとして、化粧品におけるマイクロ流体技術使用の拡大を挙げています。また、LC技術の台頭やドラッグデリバリー技術におけるマイクロ流体応用の拡大も、同市場の大きな需要につながると考えられます。
目次
第1章 エグゼクティブサマリー
- 市場概要
第2章 市場情勢
- 市場エコシステム
- 市場の特徴
- バリューチェーン分析
第3章 市場規模の評価
- 市場の定義
- 市場セグメント分析
- 市場規模 2023年
- 市場の展望 2023~2028年
第4章 市場規模実績
- マイクロ流体技術の世界市場 2018~2022年
- 材料別セグメント分析 2018~2022年
- エンドユーザー別セグメント分析 2018~2022年
- 地域別セグメント分析 2018~2022年
- 国別セグメント分析 2018~2022年
第5章 ファイブフォース分析
- ファイブフォースの要約
- 買い手の交渉力
- 供給企業の交渉力
- 新規参入業者の脅威
- 代替品の脅威
- 競争の脅威
- 市況
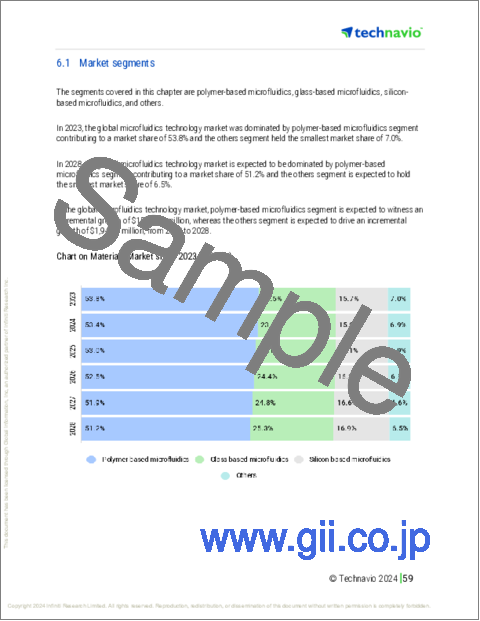
第6章 市場セグメンテーション:材料別
- 市場セグメンテーション
- 比較:材料別
- ポリマーベースのマイクロ流体:市場規模と予測 2023~2028年
- ガラスベースのマイクロ流体:市場規模と予測 2023~2028年
- シリコンベースのマイクロ流体:市場規模と予測 2023~2028年
- その他:市場規模と予測 2023~2028年
- 市場機会:材料別
第7章 市場セグメンテーション:エンドユーザー別
- 市場セグメンテーション
- 比較:エンドユーザー別
- 病院:市場規模と予測 2023~2028年
- 診断センター:市場規模と予測 2023~2028年
- 学術機関:市場規模と予測 2023~2028年
- 市場機会:エンドユーザー別
第8章 顧客情勢
- 顧客情勢概要
第9章 地域別情勢
- 地域別セグメンテーション
- 比較:地域別
- 北米:市場規模と予測 2023~2028年
- 欧州:市場規模と予測 2023~2028年
- アジア:市場規模と予測 2023~2028年
- その他:市場規模と予測 2023~2028年
- 米国:市場規模と予測 2023~2028年
- 中国:市場規模と予測 2023~2028年
- 英国:市場規模と予測 2023~2028年
- ドイツ:市場規模と予測 2023~2028年
- カナダ:市場規模と予測 2023~2028年
- 市場機会:地域情勢別
第10章 促進要因・課題・機会・抑制要因
- 市場促進要因
- 市場課題
- 促進要因と課題の影響
- 市場の機会・抑制要因
第11章 競合情勢
- 概要
- 競合情勢
- 混乱の状況
- 業界のリスク
第12章 競合分析
- 企業プロファイル
- 企業の市場ポジショニング
- Agilent Technologies Inc.
- Becton Dickinson and Co.
- Bio Rad Laboratories Inc.
- F. Hoffmann La Roche Ltd.
- Fluigent SA
- IDEX Corp.
- Illumina Inc.
- Perkin Elmer Inc.
- SMC Corp.
- Thermo Fisher Scientific Inc.
第13章 付録
Exhibits:
- Exhibits1: Executive Summary - Chart on Market Overview
- Exhibits2: Executive Summary - Data Table on Market Overview
- Exhibits3: Executive Summary - Chart on Global Market Characteristics
- Exhibits4: Executive Summary - Chart on Market By Geographical Landscape
- Exhibits5: Executive Summary - Chart on Market Segmentation by Material
- Exhibits6: Executive Summary - Chart on Market Segmentation by End-user
- Exhibits7: Executive Summary - Chart on Incremental Growth
- Exhibits8: Executive Summary - Data Table on Incremental Growth
- Exhibits9: Executive Summary - Chart on Company Market Positioning
- Exhibits10: Parent Market
- Exhibits11: Data Table on - Parent Market
- Exhibits12: Market characteristics analysis
- Exhibits13: Value Chain Analysis
- Exhibits14: Offerings of companies included in the market definition
- Exhibits15: Market segments
- Exhibits16: Chart on Global - Market size and forecast 2023-2028 ($ million)
- Exhibits17: Data Table on Global - Market size and forecast 2023-2028 ($ million)
- Exhibits18: Chart on Global Market: Year-over-year growth 2023-2028 (%)
- Exhibits19: Data Table on Global Market: Year-over-year growth 2023-2028 (%)
- Exhibits20: Historic Market Size - Data Table on Global Microfluidics Technology Market 2018 - 2022 ($ million)
- Exhibits21: Historic Market Size - Material Segment 2018 - 2022 ($ million)
- Exhibits22: Historic Market Size - End-user Segment 2018 - 2022 ($ million)
- Exhibits23: Historic Market Size - Geography Segment 2018 - 2022 ($ million)
- Exhibits24: Historic Market Size - Country Segment 2018 - 2022 ($ million)
- Exhibits25: Five forces analysis - Comparison between 2023 and 2028
- Exhibits26: Bargaining power of buyers - Impact of key factors 2023 and 2028
- Exhibits27: Bargaining power of suppliers - Impact of key factors in 2023 and 2028
- Exhibits28: Threat of new entrants - Impact of key factors in 2023 and 2028
- Exhibits29: Threat of substitutes - Impact of key factors in 2023 and 2028
- Exhibits30: Threat of rivalry - Impact of key factors in 2023 and 2028
- Exhibits31: Chart on Market condition - Five forces 2023 and 2028
- Exhibits32: Chart on Material - Market share 2023-2028 (%)
- Exhibits33: Data Table on Material - Market share 2023-2028 (%)
- Exhibits34: Chart on Comparison by Material
- Exhibits35: Data Table on Comparison by Material
- Exhibits36: Chart on Polymer-based microfluidics - Market size and forecast 2023-2028 ($ million)
- Exhibits37: Data Table on Polymer-based microfluidics - Market size and forecast 2023-2028 ($ million)
- Exhibits38: Chart on Polymer-based microfluidics - Year-over-year growth 2023-2028 (%)
- Exhibits39: Data Table on Polymer-based microfluidics - Year-over-year growth 2023-2028 (%)
- Exhibits40: Chart on Glass-based microfluidics - Market size and forecast 2023-2028 ($ million)
- Exhibits41: Data Table on Glass-based microfluidics - Market size and forecast 2023-2028 ($ million)
- Exhibits42: Chart on Glass-based microfluidics - Year-over-year growth 2023-2028 (%)
- Exhibits43: Data Table on Glass-based microfluidics - Year-over-year growth 2023-2028 (%)
- Exhibits44: Chart on Silicon-based microfluidics - Market size and forecast 2023-2028 ($ million)
- Exhibits45: Data Table on Silicon-based microfluidics - Market size and forecast 2023-2028 ($ million)
- Exhibits46: Chart on Silicon-based microfluidics - Year-over-year growth 2023-2028 (%)
- Exhibits47: Data Table on Silicon-based microfluidics - Year-over-year growth 2023-2028 (%)
- Exhibits48: Chart on Others - Market size and forecast 2023-2028 ($ million)
- Exhibits49: Data Table on Others - Market size and forecast 2023-2028 ($ million)
- Exhibits50: Chart on Others - Year-over-year growth 2023-2028 (%)
- Exhibits51: Data Table on Others - Year-over-year growth 2023-2028 (%)
- Exhibits52: Market opportunity by Material ($ million)
- Exhibits53: Data Table on Market opportunity by Material ($ million)
- Exhibits54: Chart on End-user - Market share 2023-2028 (%)
- Exhibits55: Data Table on End-user - Market share 2023-2028 (%)
- Exhibits56: Chart on Comparison by End-user
- Exhibits57: Data Table on Comparison by End-user
- Exhibits58: Chart on Hospitals - Market size and forecast 2023-2028 ($ million)
- Exhibits59: Data Table on Hospitals - Market size and forecast 2023-2028 ($ million)
- Exhibits60: Chart on Hospitals - Year-over-year growth 2023-2028 (%)
- Exhibits61: Data Table on Hospitals - Year-over-year growth 2023-2028 (%)
- Exhibits62: Chart on Diagnostic centers - Market size and forecast 2023-2028 ($ million)
- Exhibits63: Data Table on Diagnostic centers - Market size and forecast 2023-2028 ($ million)
- Exhibits64: Chart on Diagnostic centers - Year-over-year growth 2023-2028 (%)
- Exhibits65: Data Table on Diagnostic centers - Year-over-year growth 2023-2028 (%)
- Exhibits66: Chart on Academic institutes - Market size and forecast 2023-2028 ($ million)
- Exhibits67: Data Table on Academic institutes - Market size and forecast 2023-2028 ($ million)
- Exhibits68: Chart on Academic institutes - Year-over-year growth 2023-2028 (%)
- Exhibits69: Data Table on Academic institutes - Year-over-year growth 2023-2028 (%)
- Exhibits70: Market opportunity by End-user ($ million)
- Exhibits71: Data Table on Market opportunity by End-user ($ million)
- Exhibits72: Analysis of price sensitivity, lifecycle, customer purchase basket, adoption rates, and purchase criteria
- Exhibits73: Chart on Market share By Geographical Landscape 2023-2028 (%)
- Exhibits74: Data Table on Market share By Geographical Landscape 2023-2028 (%)
- Exhibits75: Chart on Geographic comparison
- Exhibits76: Data Table on Geographic comparison
- Exhibits77: Chart on North America - Market size and forecast 2023-2028 ($ million)
- Exhibits78: Data Table on North America - Market size and forecast 2023-2028 ($ million)
- Exhibits79: Chart on North America - Year-over-year growth 2023-2028 (%)
- Exhibits80: Data Table on North America - Year-over-year growth 2023-2028 (%)
- Exhibits81: Chart on Europe - Market size and forecast 2023-2028 ($ million)
- Exhibits82: Data Table on Europe - Market size and forecast 2023-2028 ($ million)
- Exhibits83: Chart on Europe - Year-over-year growth 2023-2028 (%)
- Exhibits84: Data Table on Europe - Year-over-year growth 2023-2028 (%)
- Exhibits85: Chart on Asia - Market size and forecast 2023-2028 ($ million)
- Exhibits86: Data Table on Asia - Market size and forecast 2023-2028 ($ million)
- Exhibits87: Chart on Asia - Year-over-year growth 2023-2028 (%)
- Exhibits88: Data Table on Asia - Year-over-year growth 2023-2028 (%)
- Exhibits89: Chart on Rest of World (ROW) - Market size and forecast 2023-2028 ($ million)
- Exhibits90: Data Table on Rest of World (ROW) - Market size and forecast 2023-2028 ($ million)
- Exhibits91: Chart on Rest of World (ROW) - Year-over-year growth 2023-2028 (%)
- Exhibits92: Data Table on Rest of World (ROW) - Year-over-year growth 2023-2028 (%)
- Exhibits93: Chart on US - Market size and forecast 2023-2028 ($ million)
- Exhibits94: Data Table on US - Market size and forecast 2023-2028 ($ million)
- Exhibits95: Chart on US - Year-over-year growth 2023-2028 (%)
- Exhibits96: Data Table on US - Year-over-year growth 2023-2028 (%)
- Exhibits97: Chart on China - Market size and forecast 2023-2028 ($ million)
- Exhibits98: Data Table on China - Market size and forecast 2023-2028 ($ million)
- Exhibits99: Chart on China - Year-over-year growth 2023-2028 (%)
- Exhibits100: Data Table on China - Year-over-year growth 2023-2028 (%)
- Exhibits101: Chart on UK - Market size and forecast 2023-2028 ($ million)
- Exhibits102: Data Table on UK - Market size and forecast 2023-2028 ($ million)
- Exhibits103: Chart on UK - Year-over-year growth 2023-2028 (%)
- Exhibits104: Data Table on UK - Year-over-year growth 2023-2028 (%)
- Exhibits105: Chart on Germany - Market size and forecast 2023-2028 ($ million)
- Exhibits106: Data Table on Germany - Market size and forecast 2023-2028 ($ million)
- Exhibits107: Chart on Germany - Year-over-year growth 2023-2028 (%)
- Exhibits108: Data Table on Germany - Year-over-year growth 2023-2028 (%)
- Exhibits109: Chart on Canada - Market size and forecast 2023-2028 ($ million)
- Exhibits110: Data Table on Canada - Market size and forecast 2023-2028 ($ million)
- Exhibits111: Chart on Canada - Year-over-year growth 2023-2028 (%)
- Exhibits112: Data Table on Canada - Year-over-year growth 2023-2028 (%)
- Exhibits113: Market opportunity By Geographical Landscape ($ million)
- Exhibits114: Data Tables on Market opportunity By Geographical Landscape ($ million)
- Exhibits115: Impact of drivers and challenges in 2023 and 2028
- Exhibits116: Overview on criticality of inputs and factors of differentiation
- Exhibits117: Overview on factors of disruption
- Exhibits118: Impact of key risks on business
- Exhibits119: Companies covered
- Exhibits120: Matrix on companies position and classification
- Exhibits121: Agilent Technologies Inc. - Overview
- Exhibits122: Agilent Technologies Inc. - Business segments
- Exhibits123: Agilent Technologies Inc. - Key news
- Exhibits124: Agilent Technologies Inc. - Key offerings
- Exhibits125: Agilent Technologies Inc. - Segment focus
- Exhibits126: Becton Dickinson and Co. - Overview
- Exhibits127: Becton Dickinson and Co. - Business segments
- Exhibits128: Becton Dickinson and Co. - Key news
- Exhibits129: Becton Dickinson and Co. - Key offerings
- Exhibits130: Becton Dickinson and Co. - Segment focus
- Exhibits131: Bio Rad Laboratories Inc. - Overview
- Exhibits132: Bio Rad Laboratories Inc. - Business segments
- Exhibits133: Bio Rad Laboratories Inc. - Key news
- Exhibits134: Bio Rad Laboratories Inc. - Key offerings
- Exhibits135: Bio Rad Laboratories Inc. - Segment focus
- Exhibits136: F. Hoffmann La Roche Ltd. - Overview
- Exhibits137: F. Hoffmann La Roche Ltd. - Business segments
- Exhibits138: F. Hoffmann La Roche Ltd. - Key news
- Exhibits139: F. Hoffmann La Roche Ltd. - Key offerings
- Exhibits140: F. Hoffmann La Roche Ltd. - Segment focus
- Exhibits141: Fluigent SA - Overview
- Exhibits142: Fluigent SA - Product / Service
- Exhibits143: Fluigent SA - Key offerings
- Exhibits144: IDEX Corp. - Overview
- Exhibits145: IDEX Corp. - Business segments
- Exhibits146: IDEX Corp. - Key news
- Exhibits147: IDEX Corp. - Key offerings
- Exhibits148: IDEX Corp. - Segment focus
- Exhibits149: Illumina Inc. - Overview
- Exhibits150: Illumina Inc. - Business segments
- Exhibits151: Illumina Inc. - Key news
- Exhibits152: Illumina Inc. - Key offerings
- Exhibits153: Illumina Inc. - Segment focus
- Exhibits154: Perkin Elmer Inc. - Overview
- Exhibits155: Perkin Elmer Inc. - Business segments
- Exhibits156: Perkin Elmer Inc. - Key news
- Exhibits157: Perkin Elmer Inc. - Key offerings
- Exhibits158: Perkin Elmer Inc. - Segment focus
- Exhibits159: SMC Corp. - Overview
- Exhibits160: SMC Corp. - Product / Service
- Exhibits161: SMC Corp. - Key offerings
- Exhibits162: Thermo Fisher Scientific Inc. - Overview
- Exhibits163: Thermo Fisher Scientific Inc. - Business segments
- Exhibits164: Thermo Fisher Scientific Inc. - Key news
- Exhibits165: Thermo Fisher Scientific Inc. - Key offerings
- Exhibits166: Thermo Fisher Scientific Inc. - Segment focus
- Exhibits167: Inclusions checklist
- Exhibits168: Exclusions checklist
- Exhibits169: Currency conversion rates for US$
- Exhibits170: Research methodology
- Exhibits171: Information sources
- Exhibits172: Data validation
- Exhibits173: Validation techniques employed for market sizing
- Exhibits174: Data synthesis
- Exhibits175: 360 degree market analysis
- Exhibits176: List of abbreviations
Microfluidics Technology Market 2024-2028
The microfluidics technology market is forecasted to grow by USD 31474.9 mn during 2023-2028, accelerating at a CAGR of 20.28% during the forecast period. The report on the microfluidics technology market provides a holistic analysis, market size and forecast, trends, growth drivers, and challenges, as well as vendor analysis covering around 25 vendors.
The report offers an up-to-date analysis regarding the current market scenario, the latest trends and drivers, and the overall market environment. The market is driven by increasing applications in molecular biology, advances in DNA sequencing increases use of microfluidic techniques, and rise in cancer incidences demands novel methods of diagnosis and drug delivery.
| Market Scope | |
|---|---|
| Base Year | 2024 |
| End Year | 2028 |
| Series Year | 2024-2028 |
| Growth Momentum | Accelerate |
| YOY 2024 | 17.17% |
| CAGR | 20.28% |
| Incremental Value | $31474.9 mn |
Technavio's microfluidics technology market is segmented as below:
By Material
- Polymer-based microfluidics
- Glass-based microfluidics
- Silicon-based microfluidics
- Others
By End-user
- Hospitals
- Diagnostic centers
- Academic institutes
By Geographical Landscape
- North America
- Europe
- Asia
- Rest of World (ROW)
This study identifies the growing use of microfluidics technology in cosmetics as one of the prime reasons driving the microfluidics technology market growth during the next few years. Also, emerging loc technology and increasing applications of microfluidics in drug delivery technologies will lead to sizable demand in the market.
The report on the microfluidics technology market covers the following areas:
- Microfluidics technology market sizing
- Microfluidics technology market forecast
- Microfluidics technology market industry analysis
The vendor analysis is designed to help clients improve their market position, and in line with this, this report provides a detailed analysis of several leading microfluidics technology market vendors that include Agilent Technologies Inc., Becton Dickinson and Co., Bio RAD Laboratories Inc., Biocartis NV, BioFluidix GmbH, Blacktrace Holdings Ltd., Cellix Ltd., Danaher Corp., Elveflow, Epigem Ltd., F. Hoffmann La Roche Ltd., Fluigent SA, iBiochips, IDEX Corp., Illumina Inc., Perkin Elmer Inc., QIAGEN NV, SMC Corp., Standard BioTools Inc., and Thermo Fisher Scientific Inc.. Also, the microfluidics technology market analysis report includes information on upcoming trends and challenges that will influence market growth. This is to help companies strategize and leverage all forthcoming growth opportunities.
The study was conducted using an objective combination of primary and secondary information including inputs from key participants in the industry. The report contains a comprehensive market and vendor landscape in addition to an analysis of the key vendors.
The company presents a detailed picture of the market by the way of study, synthesis, and summation of data from multiple sources by an analysis of key parameters such as profit, pricing, competition, and promotions. It presents various market facets by identifying the key industry influencers. The data presented is comprehensive, reliable, and a result of extensive research - both primary and secondary. The market research reports provide a complete competitive landscape and an in-depth vendor selection methodology and analysis using qualitative and quantitative research to forecast the accurate market growth.
Table of Contents
1 Executive Summary
- 1.1 Market overview
- Executive Summary - Chart on Market Overview
- Executive Summary - Data Table on Market Overview
- Executive Summary - Chart on Global Market Characteristics
- Executive Summary - Chart on Market By Geographical Landscape
- Executive Summary - Chart on Market Segmentation by Material
- Executive Summary - Chart on Market Segmentation by End-user
- Executive Summary - Chart on Incremental Growth
- Executive Summary - Data Table on Incremental Growth
- Executive Summary - Chart on Company Market Positioning
2 Market Landscape
- 2.1 Market ecosystem
- Parent Market
- Data Table on - Parent Market
- 2.2 Market characteristics
- Market characteristics analysis
- 2.3 Value chain analysis
- Value Chain Analysis
3 Market Sizing
- 3.1 Market definition
- Offerings of companies included in the market definition
- 3.2 Market segment analysis
- Market segments
- 3.3 Market size 2023
- 3.4 Market outlook: Forecast for 2023-2028
- Chart on Global - Market size and forecast 2023-2028 ($ million)
- Data Table on Global - Market size and forecast 2023-2028 ($ million)
- Chart on Global Market: Year-over-year growth 2023-2028 (%)
- Data Table on Global Market: Year-over-year growth 2023-2028 (%)
4 Historic Market Size
- 4.1 Global Microfluidics Technology Market 2018 - 2022
- Historic Market Size - Data Table on Global Microfluidics Technology Market 2018 - 2022 ($ million)
- 4.2 Material segment analysis 2018 - 2022
- Historic Market Size - Material Segment 2018 - 2022 ($ million)
- 4.3 End-user segment analysis 2018 - 2022
- Historic Market Size - End-user Segment 2018 - 2022 ($ million)
- 4.4 Geography segment analysis 2018 - 2022
- Historic Market Size - Geography Segment 2018 - 2022 ($ million)
- 4.5 Country segment analysis 2018 - 2022
- Historic Market Size - Country Segment 2018 - 2022 ($ million)
5 Five Forces Analysis
- 5.1 Five forces summary
- Five forces analysis - Comparison between 2023 and 2028
- 5.2 Bargaining power of buyers
- Bargaining power of buyers - Impact of key factors 2023 and 2028
- 5.3 Bargaining power of suppliers
- Bargaining power of suppliers - Impact of key factors in 2023 and 2028
- 5.4 Threat of new entrants
- Threat of new entrants - Impact of key factors in 2023 and 2028
- 5.5 Threat of substitutes
- Threat of substitutes - Impact of key factors in 2023 and 2028
- 5.6 Threat of rivalry
- Threat of rivalry - Impact of key factors in 2023 and 2028
- 5.7 Market condition
- Chart on Market condition - Five forces 2023 and 2028
6 Market Segmentation by Material
- 6.1 Market segments
- Chart on Material - Market share 2023-2028 (%)
- Data Table on Material - Market share 2023-2028 (%)
- 6.2 Comparison by Material
- Chart on Comparison by Material
- Data Table on Comparison by Material
- 6.3 Polymer-based microfluidics - Market size and forecast 2023-2028
- Chart on Polymer-based microfluidics - Market size and forecast 2023-2028 ($ million)
- Data Table on Polymer-based microfluidics - Market size and forecast 2023-2028 ($ million)
- Chart on Polymer-based microfluidics - Year-over-year growth 2023-2028 (%)
- Data Table on Polymer-based microfluidics - Year-over-year growth 2023-2028 (%)
- 6.4 Glass-based microfluidics - Market size and forecast 2023-2028
- Chart on Glass-based microfluidics - Market size and forecast 2023-2028 ($ million)
- Data Table on Glass-based microfluidics - Market size and forecast 2023-2028 ($ million)
- Chart on Glass-based microfluidics - Year-over-year growth 2023-2028 (%)
- Data Table on Glass-based microfluidics - Year-over-year growth 2023-2028 (%)
- 6.5 Silicon-based microfluidics - Market size and forecast 2023-2028
- Chart on Silicon-based microfluidics - Market size and forecast 2023-2028 ($ million)
- Data Table on Silicon-based microfluidics - Market size and forecast 2023-2028 ($ million)
- Chart on Silicon-based microfluidics - Year-over-year growth 2023-2028 (%)
- Data Table on Silicon-based microfluidics - Year-over-year growth 2023-2028 (%)
- 6.6 Others - Market size and forecast 2023-2028
- Chart on Others - Market size and forecast 2023-2028 ($ million)
- Data Table on Others - Market size and forecast 2023-2028 ($ million)
- Chart on Others - Year-over-year growth 2023-2028 (%)
- Data Table on Others - Year-over-year growth 2023-2028 (%)
- 6.7 Market opportunity by Material
- Market opportunity by Material ($ million)
- Data Table on Market opportunity by Material ($ million)
7 Market Segmentation by End-user
- 7.1 Market segments
- Chart on End-user - Market share 2023-2028 (%)
- Data Table on End-user - Market share 2023-2028 (%)
- 7.2 Comparison by End-user
- Chart on Comparison by End-user
- Data Table on Comparison by End-user
- 7.3 Hospitals - Market size and forecast 2023-2028
- Chart on Hospitals - Market size and forecast 2023-2028 ($ million)
- Data Table on Hospitals - Market size and forecast 2023-2028 ($ million)
- Chart on Hospitals - Year-over-year growth 2023-2028 (%)
- Data Table on Hospitals - Year-over-year growth 2023-2028 (%)
- 7.4 Diagnostic centers - Market size and forecast 2023-2028
- Chart on Diagnostic centers - Market size and forecast 2023-2028 ($ million)
- Data Table on Diagnostic centers - Market size and forecast 2023-2028 ($ million)
- Chart on Diagnostic centers - Year-over-year growth 2023-2028 (%)
- Data Table on Diagnostic centers - Year-over-year growth 2023-2028 (%)
- 7.5 Academic institutes - Market size and forecast 2023-2028
- Chart on Academic institutes - Market size and forecast 2023-2028 ($ million)
- Data Table on Academic institutes - Market size and forecast 2023-2028 ($ million)
- Chart on Academic institutes - Year-over-year growth 2023-2028 (%)
- Data Table on Academic institutes - Year-over-year growth 2023-2028 (%)
- 7.6 Market opportunity by End-user
- Market opportunity by End-user ($ million)
- Data Table on Market opportunity by End-user ($ million)
8 Customer Landscape
- 8.1 Customer landscape overview
- Analysis of price sensitivity, lifecycle, customer purchase basket, adoption rates, and purchase criteria
9 Geographic Landscape
- 9.1 Geographic segmentation
- Chart on Market share By Geographical Landscape 2023-2028 (%)
- Data Table on Market share By Geographical Landscape 2023-2028 (%)
- 9.2 Geographic comparison
- Chart on Geographic comparison
- Data Table on Geographic comparison
- 9.3 North America - Market size and forecast 2023-2028
- Chart on North America - Market size and forecast 2023-2028 ($ million)
- Data Table on North America - Market size and forecast 2023-2028 ($ million)
- Chart on North America - Year-over-year growth 2023-2028 (%)
- Data Table on North America - Year-over-year growth 2023-2028 (%)
- 9.4 Europe - Market size and forecast 2023-2028
- Chart on Europe - Market size and forecast 2023-2028 ($ million)
- Data Table on Europe - Market size and forecast 2023-2028 ($ million)
- Chart on Europe - Year-over-year growth 2023-2028 (%)
- Data Table on Europe - Year-over-year growth 2023-2028 (%)
- 9.5 Asia - Market size and forecast 2023-2028
- Chart on Asia - Market size and forecast 2023-2028 ($ million)
- Data Table on Asia - Market size and forecast 2023-2028 ($ million)
- Chart on Asia - Year-over-year growth 2023-2028 (%)
- Data Table on Asia - Year-over-year growth 2023-2028 (%)
- 9.6 Rest of World (ROW) - Market size and forecast 2023-2028
- Chart on Rest of World (ROW) - Market size and forecast 2023-2028 ($ million)
- Data Table on Rest of World (ROW) - Market size and forecast 2023-2028 ($ million)
- Chart on Rest of World (ROW) - Year-over-year growth 2023-2028 (%)
- Data Table on Rest of World (ROW) - Year-over-year growth 2023-2028 (%)
- 9.7 US - Market size and forecast 2023-2028
- Chart on US - Market size and forecast 2023-2028 ($ million)
- Data Table on US - Market size and forecast 2023-2028 ($ million)
- Chart on US - Year-over-year growth 2023-2028 (%)
- Data Table on US - Year-over-year growth 2023-2028 (%)
- 9.8 China - Market size and forecast 2023-2028
- Chart on China - Market size and forecast 2023-2028 ($ million)
- Data Table on China - Market size and forecast 2023-2028 ($ million)
- Chart on China - Year-over-year growth 2023-2028 (%)
- Data Table on China - Year-over-year growth 2023-2028 (%)
- 9.9 UK - Market size and forecast 2023-2028
- Chart on UK - Market size and forecast 2023-2028 ($ million)
- Data Table on UK - Market size and forecast 2023-2028 ($ million)
- Chart on UK - Year-over-year growth 2023-2028 (%)
- Data Table on UK - Year-over-year growth 2023-2028 (%)
- 9.10 Germany - Market size and forecast 2023-2028
- Chart on Germany - Market size and forecast 2023-2028 ($ million)
- Data Table on Germany - Market size and forecast 2023-2028 ($ million)
- Chart on Germany - Year-over-year growth 2023-2028 (%)
- Data Table on Germany - Year-over-year growth 2023-2028 (%)
- 9.11 Canada - Market size and forecast 2023-2028
- Chart on Canada - Market size and forecast 2023-2028 ($ million)
- Data Table on Canada - Market size and forecast 2023-2028 ($ million)
- Chart on Canada - Year-over-year growth 2023-2028 (%)
- Data Table on Canada - Year-over-year growth 2023-2028 (%)
- 9.12 Market opportunity By Geographical Landscape
- Market opportunity By Geographical Landscape ($ million)
- Data Tables on Market opportunity By Geographical Landscape ($ million)
10 Drivers, Challenges, and Opportunity/Restraints
- 10.1 Market drivers
- 10.2 Market challenges
- 10.3 Impact of drivers and challenges
- Impact of drivers and challenges in 2023 and 2028
- 10.4 Market opportunities/restraints
11 Competitive Landscape
- 11.1 Overview
- 11.2 Competitive Landscape
- Overview on criticality of inputs and factors of differentiation
- 11.3 Landscape disruption
- Overview on factors of disruption
- 11.4 Industry risks
- Impact of key risks on business
12 Competitive Analysis
- 12.1 Companies profiled
- Companies covered
- 12.2 Market positioning of companies
- Matrix on companies position and classification
- 12.3 Agilent Technologies Inc.
- Agilent Technologies Inc. - Overview
- Agilent Technologies Inc. - Business segments
- Agilent Technologies Inc. - Key news
- Agilent Technologies Inc. - Key offerings
- Agilent Technologies Inc. - Segment focus
- 12.4 Becton Dickinson and Co.
- Becton Dickinson and Co. - Overview
- Becton Dickinson and Co. - Business segments
- Becton Dickinson and Co. - Key news
- Becton Dickinson and Co. - Key offerings
- Becton Dickinson and Co. - Segment focus
- 12.5 Bio Rad Laboratories Inc.
- Bio Rad Laboratories Inc. - Overview
- Bio Rad Laboratories Inc. - Business segments
- Bio Rad Laboratories Inc. - Key news
- Bio Rad Laboratories Inc. - Key offerings
- Bio Rad Laboratories Inc. - Segment focus
- 12.6 F. Hoffmann La Roche Ltd.
- F. Hoffmann La Roche Ltd. - Overview
- F. Hoffmann La Roche Ltd. - Business segments
- F. Hoffmann La Roche Ltd. - Key news
- F. Hoffmann La Roche Ltd. - Key offerings
- F. Hoffmann La Roche Ltd. - Segment focus
- 12.7 Fluigent SA
- Fluigent SA - Overview
- Fluigent SA - Product / Service
- Fluigent SA - Key offerings
- 12.8 IDEX Corp.
- IDEX Corp. - Overview
- IDEX Corp. - Business segments
- IDEX Corp. - Key news
- IDEX Corp. - Key offerings
- IDEX Corp. - Segment focus
- 12.9 Illumina Inc.
- Illumina Inc. - Overview
- Illumina Inc. - Business segments
- Illumina Inc. - Key news
- Illumina Inc. - Key offerings
- Illumina Inc. - Segment focus
- 12.10 Perkin Elmer Inc.
- Perkin Elmer Inc. - Overview
- Perkin Elmer Inc. - Business segments
- Perkin Elmer Inc. - Key news
- Perkin Elmer Inc. - Key offerings
- Perkin Elmer Inc. - Segment focus
- 12.11 SMC Corp.
- SMC Corp. - Overview
- SMC Corp. - Product / Service
- SMC Corp. - Key offerings
- 12.12 Thermo Fisher Scientific Inc.
- Thermo Fisher Scientific Inc. - Overview
- Thermo Fisher Scientific Inc. - Business segments
- Thermo Fisher Scientific Inc. - Key news
- Thermo Fisher Scientific Inc. - Key offerings
- Thermo Fisher Scientific Inc. - Segment focus
13 Appendix
- 13.1 Scope of the report
- 13.2 Inclusions and exclusions checklist
- Inclusions checklist
- Exclusions checklist
- 13.3 Currency conversion rates for US$
- Currency conversion rates for US$
- 13.4 Research methodology
- Research methodology
- 13.5 Data procurement
- Information sources
- 13.6 Data validation
- Data validation
- 13.7 Validation techniques employed for market sizing
- Validation techniques employed for market sizing
- 13.8 Data synthesis
- Data synthesis
- 13.9 360 degree market analysis
- 360 degree market analysis
- 13.10 List of abbreviations
- List of abbreviations
