|
|
市場調査レポート
商品コード
1911262
世界の臨床化学分析装置市場2026-2030年Global Clinical Chemistry Analyzers Market 2026-2030 |
||||||
|
|||||||
カスタマイズ可能
|
|||||||

| 世界の臨床化学分析装置市場2026-2030年 |
|
出版日: 2026年01月14日
発行: TechNavio
ページ情報: 英文 308 Pages
納期: 即納可能
|

概要
世界の臨床化学分析装置市場は、2025年から2030年の間に35億630万米ドルの成長が見込まれ、予測期間中のCAGRは4.3%と予測されています。
本報告書では、世界の臨床化学分析装置市場に関する包括的な分析、市場規模と予測、動向、成長要因、課題に加え、約25社のベンダー分析を提供しております。
本レポートは、現在の市場状況、最新の動向と促進要因、市場環境全般に関する最新の分析を提供します。市場は、慢性疾患の世界の有病率の増加と高齢人口の拡大、自動化・統合・情報科学における継続的な技術進歩、予防医療へのパラダイムシフト、検査の分散化によって牽引されています。
本調査は、業界の主要関係者からの情報を含む、一次情報と二次情報の客観的な組み合わせを用いて実施されました。本レポートには、主要企業の分析に加え、包括的な市場規模データ、地域別分析を伴うセグメント、ベンダー情勢が含まれています。レポートには過去データと予測データが掲載されています。
| 市場範囲 | |
|---|---|
| 基準年 | 2026年 |
| 対象期間 | 2030年 |
| 予測期間 | 2026-2030 |
| 成長モメンタム | 加速 |
| 前年比2026年 | 4.1% |
| CAGR | 4.3% |
| 増分額 | 35億630万米ドル |
本調査では、今後数年間における世界の臨床化学分析装置市場の成長を牽引する主な要因の一つとして、持続可能性と環境に優しい実験室ソリューションへの関心の高まりを挙げております。また、高付加価値の特殊検査や難解な検査を含む検査メニューの拡充、ならびに試薬レンタルおよび管理サービスビジネスモデルの優位性が、市場における相当な需要を生み出すと予測されます。
目次
第1章 エグゼクティブサマリー
- 市場概要
第2章 Technavio分析
- 価格・ライフサイクル・顧客購入バスケット・採用率・購入基準の分析
- インプットの重要性と差別化の要因
- 混乱の要因
- 促進要因と課題の影響
第3章 市場情勢
- 市場エコシステム
- 市場の特徴
- バリューチェーン分析
第4章 市場規模
- 市場の定義
- 市場セグメント分析
- 市場規模 2025
- 市場の見通し 2025-2030
第5章 市場規模実績
- 世界の臨床化学分析装置市場 2020-2024
- エンドユーザーセグメント分析 2020-2024
- タイプセグメント分析 2020-2024
- 製品タイプセグメント分析 2020-2024
- 地域別セグメント分析 2020-2024
- 国別セグメント分析 2020-2024
第6章 定性分析
- AIの影響:世界の臨床化学分析装置市場
第7章 ファイブフォース分析
- ファイブフォースの要約
- 買い手の交渉力
- 供給企業の交渉力
- 新規参入業者の脅威
- 代替品の脅威
- 競争の脅威
- 市況
第8章 市場セグメンテーション:エンドユーザー別
- 市場セグメント
- 比較:エンドユーザー別
- 病院:市場規模と予測 2025-2030
- 診断検査室:市場規模と予測 2025-2030
- 学術研究機関:市場規模と予測 2025-2030
- その他:市場規模と予測 2025-2030
- 市場機会:エンドユーザー別
第9章 市場セグメンテーション:タイプ別
- 市場セグメント
- 比較:タイプ別
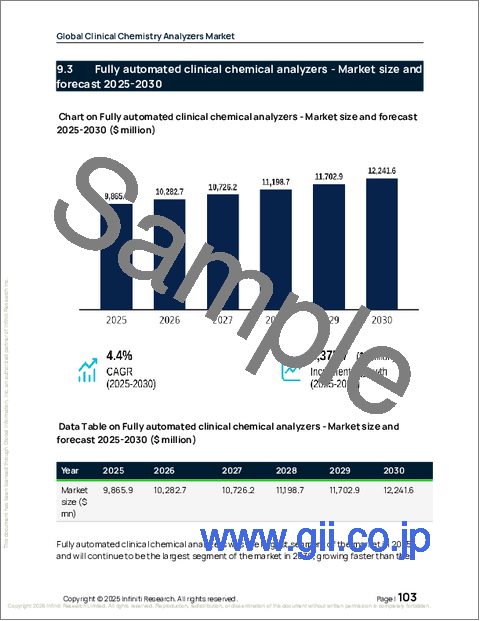
- 全自動臨床化学分析装置:市場規模と予測 2025-2030
- 半自動臨床化学分析装置:市場規模と予測 2025-2030
- 市場機会:タイプ別
第10章 市場セグメンテーション:製品タイプ別
- 市場セグメント
- 比較:製品タイプ別
- 試薬:市場規模と予測 2025-2030
- 分析装置:市場規模と予測 2025-2030
- その他:市場規模と予測 2025-2030
- 市場機会:製品タイプ別
第11章 顧客情勢
- 顧客情勢の概要
第12章 地域別情勢
- 地域別セグメンテーション
- 地域別比較
- 北米:市場規模と予測 2025-2030
- 欧州:市場規模と予測 2025-2030
- アジア:市場規模と予測 2025-2030
- 世界のその他の地域:市場規模と予測 2025-2030
- 市場機会:地域別
第13章 促進要因、課題、および機会
- 市場促進要因
- 市場の課題
- 促進要因と課題の影響
- 市場機会
第14章 競合情勢
- 概要
- 競合情勢
- 混乱の状況
- 業界のリスク
第15章 競合分析
- 企業プロファイル
- 企業ランキング指数
- 企業の市場ポジショニング
- Abbott Laboratories
- Bio Rad Laboratories Inc.
- Cardinal Health Inc.
- Danaher Corp.
- DiaSorin SpA
- Dirui Industrial Co. Ltd
- F. Hoffmann La Roche Ltd.
- Hitachi Ltd.
- HORIBA Ltd.
- Randox Laboratories Ltd.
- Shenzhen Mindray BioMedical
- Siemens AG
- Sysmex Corp.
- Thermo Fisher Scientific Inc.
- Werfenlife SA
