|
|
市場調査レポート
商品コード
1756583
コラーゲンサプリメントの世界市場 2025年~2029年Global Collagen Supplement Market 2025-2029 |
||||||

|
|||||||
カスタマイズ可能
|
|||||||


| コラーゲンサプリメントの世界市場 2025年~2029年 |
|
出版日: 2025年06月14日
発行: TechNavio
ページ情報: 英文 221 Pages
納期: 即納可能
|

全表示
- 概要
- 図表
- 目次
コラーゲンサプリメント市場は2024年~2029年に10億2,410万米ドル、予測期間中のCAGRは7.1%で成長すると予測されます。
当レポートでは、コラーゲンサプリメント市場の全体的な分析、市場規模・予測、動向、成長促進要因、課題、約25のベンダーを網羅したベンダー分析などを掲載しています。
現在の市場シナリオ、最新動向と促進要因、市場環境全体に関する最新分析を提供しています。市場は、関節状態の改善や骨の健康維持を目的としたコラーゲンサプリメントの採用の増加、消化器系疾患の有病率の増加、コラーゲンサプリメントの健康効果などが牽引しています。
| 市場範囲 | |
|---|---|
| 基準年 | 2025 |
| 終了年 | 2029 |
| 予測期間 | 2025-2029 |
| 成長モメンタム | 加速 |
| 前年比 | 6.5% |
| CAGR | 7.1% |
| 増分額 | 10億2,410万米ドル |
本調査は、業界の主要参加者からのインプットを含め、一次情報と二次情報を客観的に組み合わせて実施しました。レポートには、主要企業の分析に加え、包括的な市場規模データ、地域分析によるセグメント、ベンダー情勢が含まれています。レポートには過去データと予測データがあります。
本調査では、今後数年間のコラーゲンサプリメント市場の成長を促進する主な要因の一つとして、市場企業の戦略的イニシアチブを挙げています。また、骨粗鬆症の有病率の増加、化粧品やパーソナルケア産業におけるコラーゲンの用途の増加は、市場の大きな需要につながります。
目次
第1章 エグゼクティブサマリー
- 市場概要
第2章 Technavio分析
- 価格・ライフサイクル・顧客購入バスケット・採用率・購入基準の分析
- インプットの重要性と差別化の要因
- 混乱の要因
- 促進要因と課題の影響
第3章 市場情勢
- 市場エコシステム
- 市場の特徴
- バリューチェーン分析
第4章 市場規模
- 市場の定義
- 市場セグメント分析
- 市場規模 2024
- 市場の見通し 2024年~2029年
第5章 市場規模実績
- コラーゲンサプリメントの世界市場 2019年~2023年
- 流通チャネル別セグメント分析 2019年~2023年
- ソース別セグメント分析 2019年~2023年
- 製品タイプ別セグメント分析 2019年~2023年
- 地域別セグメント分析 2019年~2023年
- 国別セグメント分析 2019年~2023年
第6章 定性分析
- AIの影響:コラーゲンサプリメントの世界市場
第7章 ファイブフォース分析
- ファイブフォースの要約
- 買い手の交渉力
- 供給企業の交渉力
- 新規参入業者の脅威
- 代替品の脅威
- 競争の脅威
- 市況
第8章 市場セグメンテーション:流通チャネル別
- 市場セグメント
- 比較:流通チャネル別
- オンライン:市場規模と予測 2024年~2029年
- オフライン:市場規模と予測 2024年~2029年
- 市場機会:流通チャネル別
第9章 市場セグメンテーション:供給源別
- 市場セグメント
- 比較:供給源別
- 牛:市場規模と予測 2024年~2029年
- 豚:市場規模と予測 2024年~2029年
- 海産物と鶏肉:市場規模と予測 2024年~2029年
- 市場機会:供給源別
第10章 市場セグメンテーション:製品タイプ別
- 市場セグメント
- 比較:製品タイプ別
- カプセル:市場規模と予測 2024年~2029年
- 粉末:市場規模と予測 2024年~2029年
- 錠剤:市場規模と予測 2024年~2029年
- 液体:市場規模と予測 2024年~2029年
- その他:市場規模と予測 2024年~2029年
- 市場機会:製品タイプ別
第11章 顧客情勢
- 顧客情勢の概要
第12章 地域別情勢
- 地域別セグメンテーション
- 地域別比較
- 北米:市場規模と予測 2024年~2029年
- 欧州:市場規模と予測 2024年~2029年
- アジア:市場規模と予測 2024年~2029年
- 世界のその他の地域:市場規模と予測 2024年~2029年
- 米国:市場規模と予測 2024年~2029年
- ドイツ:市場規模と予測 2024年~2029年
- カナダ:市場規模と予測 2024年~2029年
- インド:市場規模と予測 2024年~2029年
- 英国:市場規模と予測 2024年~2029年
- 中国:市場規模と予測 2024年~2029年
- フランス:市場規模と予測 2024年~2029年
- ブラジル:市場規模と予測 2024年~2029年
- 日本:市場規模と予測 2024年~2029年
- イタリア:市場規模と予測 2024年~2029年
- 市場機会:地域情勢別
第13章 促進要因・課題・機会・抑制要因
- 市場促進要因
- 市場の課題
- 促進要因と課題の影響
- 市場の機会・抑制要因
第14章 競合情勢
- 概要
- 競合情勢
- 混乱の状況
- 業界のリスク
第15章 競合分析
- 企業プロファイル
- 企業ランキング指数
- 企業の市場ポジショニング
- Absolute collagen
- Codeage LLC
- DSM-Firmenich AG
- Glanbia plc
- Hunter and Gather Foods Ltd.
- Nestle SA
- PROTEIN SA
- Proto col
- Rejuvenated Ltd.
- Revive Collagen
- Shiseido Co. Ltd.
- The Carlyle Group Inc.
- The Clorox Co.
- Titan Biotech Ltd.
- ZENii Ltd.
第16章 付録
Exhibits:
- Exhibits1: Executive Summary - Chart on Market Overview
- Exhibits2: Executive Summary - Data Table on Market Overview
- Exhibits3: Executive Summary - Chart on Global Market Characteristics
- Exhibits4: Executive Summary - Chart on Market By Geographical Landscape
- Exhibits5: Executive Summary - Chart on Market Segmentation by Distribution Channel
- Exhibits6: Executive Summary - Chart on Market Segmentation by Source
- Exhibits7: Executive Summary - Chart on Market Segmentation by Product Type
- Exhibits8: Executive Summary - Chart on Incremental Growth
- Exhibits9: Executive Summary - Data Table on Incremental Growth
- Exhibits10: Executive Summary - Chart on Company Market Positioning
- Exhibits11: Analysis of price sensitivity, lifecycle, customer purchase basket, adoption rates, and purchase criteria
- Exhibits12: Overview on criticality of inputs and factors of differentiation
- Exhibits13: Overview on factors of disruption
- Exhibits14: Impact of drivers and challenges in 2024 and 2029
- Exhibits15: Parent Market
- Exhibits16: Data Table on - Parent Market
- Exhibits17: Market characteristics analysis
- Exhibits18: Value chain analysis
- Exhibits19: Offerings of companies included in the market definition
- Exhibits20: Market segments
- Exhibits21: Chart on Global - Market size and forecast 2024-2029 ($ million)
- Exhibits22: Data Table on Global - Market size and forecast 2024-2029 ($ million)
- Exhibits23: Chart on Global Market: Year-over-year growth 2024-2029 (%)
- Exhibits24: Data Table on Global Market: Year-over-year growth 2024-2029 (%)
- Exhibits25: Historic Market Size - Data Table on Global Collagen Supplement Market 2019 - 2023 ($ million)
- Exhibits26: Historic Market Size - Distribution Channel Segment 2019 - 2023 ($ million)
- Exhibits27: Historic Market Size - Source Segment 2019 - 2023 ($ million)
- Exhibits28: Historic Market Size - Product Type Segment 2019 - 2023 ($ million)
- Exhibits29: Historic Market Size - Geography Segment 2019 - 2023 ($ million)
- Exhibits30: Historic Market Size - Country Segment 2019 - 2023 ($ million)
- Exhibits31: Five forces analysis - Comparison between 2024 and 2029
- Exhibits32: Bargaining power of buyers - Impact of key factors 2024 and 2029
- Exhibits33: Bargaining power of suppliers - Impact of key factors in 2024 and 2029
- Exhibits34: Threat of new entrants - Impact of key factors in 2024 and 2029
- Exhibits35: Threat of substitutes - Impact of key factors in 2024 and 2029
- Exhibits36: Threat of rivalry - Impact of key factors in 2024 and 2029
- Exhibits37: Chart on Market condition - Five forces 2024 and 2029
- Exhibits38: Chart on Distribution Channel - Market share 2024-2029 (%)
- Exhibits39: Data Table on Distribution Channel - Market share 2024-2029 (%)
- Exhibits40: Chart on Comparison by Distribution Channel
- Exhibits41: Data Table on Comparison by Distribution Channel
- Exhibits42: Chart on Online - Market size and forecast 2024-2029 ($ million)
- Exhibits43: Data Table on Online - Market size and forecast 2024-2029 ($ million)
- Exhibits44: Chart on Online - Year-over-year growth 2024-2029 (%)
- Exhibits45: Data Table on Online - Year-over-year growth 2024-2029 (%)
- Exhibits46: Chart on Offline - Market size and forecast 2024-2029 ($ million)
- Exhibits47: Data Table on Offline - Market size and forecast 2024-2029 ($ million)
- Exhibits48: Chart on Offline - Year-over-year growth 2024-2029 (%)
- Exhibits49: Data Table on Offline - Year-over-year growth 2024-2029 (%)
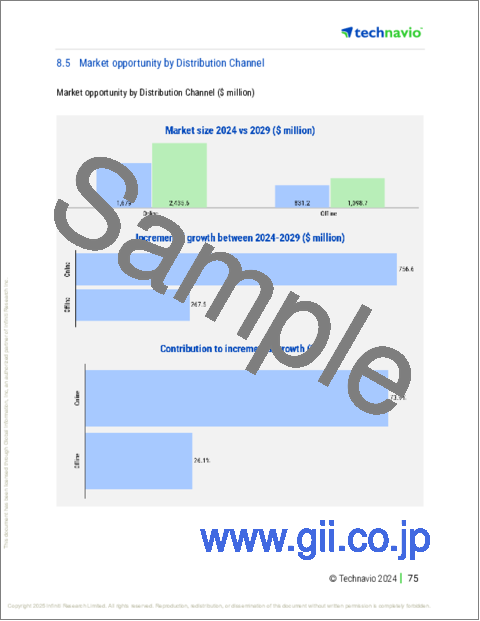
- Exhibits50: Market opportunity by Distribution Channel ($ million)
- Exhibits51: Data Table on Market opportunity by Distribution Channel ($ million)
- Exhibits52: Chart on Source - Market share 2024-2029 (%)
- Exhibits53: Data Table on Source - Market share 2024-2029 (%)
- Exhibits54: Chart on Comparison by Source
- Exhibits55: Data Table on Comparison by Source
- Exhibits56: Chart on Bovine - Market size and forecast 2024-2029 ($ million)
- Exhibits57: Data Table on Bovine - Market size and forecast 2024-2029 ($ million)
- Exhibits58: Chart on Bovine - Year-over-year growth 2024-2029 (%)
- Exhibits59: Data Table on Bovine - Year-over-year growth 2024-2029 (%)
- Exhibits60: Chart on Porcine - Market size and forecast 2024-2029 ($ million)
- Exhibits61: Data Table on Porcine - Market size and forecast 2024-2029 ($ million)
- Exhibits62: Chart on Porcine - Year-over-year growth 2024-2029 (%)
- Exhibits63: Data Table on Porcine - Year-over-year growth 2024-2029 (%)
- Exhibits64: Chart on Marine and poultry - Market size and forecast 2024-2029 ($ million)
- Exhibits65: Data Table on Marine and poultry - Market size and forecast 2024-2029 ($ million)
- Exhibits66: Chart on Marine and poultry - Year-over-year growth 2024-2029 (%)
- Exhibits67: Data Table on Marine and poultry - Year-over-year growth 2024-2029 (%)
- Exhibits68: Market opportunity by Source ($ million)
- Exhibits69: Data Table on Market opportunity by Source ($ million)
- Exhibits70: Chart on Product Type - Market share 2024-2029 (%)
- Exhibits71: Data Table on Product Type - Market share 2024-2029 (%)
- Exhibits72: Chart on Comparison by Product Type
- Exhibits73: Data Table on Comparison by Product Type
- Exhibits74: Chart on Capsules - Market size and forecast 2024-2029 ($ million)
- Exhibits75: Data Table on Capsules - Market size and forecast 2024-2029 ($ million)
- Exhibits76: Chart on Capsules - Year-over-year growth 2024-2029 (%)
- Exhibits77: Data Table on Capsules - Year-over-year growth 2024-2029 (%)
- Exhibits78: Chart on Powder - Market size and forecast 2024-2029 ($ million)
- Exhibits79: Data Table on Powder - Market size and forecast 2024-2029 ($ million)
- Exhibits80: Chart on Powder - Year-over-year growth 2024-2029 (%)
- Exhibits81: Data Table on Powder - Year-over-year growth 2024-2029 (%)
- Exhibits82: Chart on Tablets - Market size and forecast 2024-2029 ($ million)
- Exhibits83: Data Table on Tablets - Market size and forecast 2024-2029 ($ million)
- Exhibits84: Chart on Tablets - Year-over-year growth 2024-2029 (%)
- Exhibits85: Data Table on Tablets - Year-over-year growth 2024-2029 (%)
- Exhibits86: Chart on Liquid - Market size and forecast 2024-2029 ($ million)
- Exhibits87: Data Table on Liquid - Market size and forecast 2024-2029 ($ million)
- Exhibits88: Chart on Liquid - Year-over-year growth 2024-2029 (%)
- Exhibits89: Data Table on Liquid - Year-over-year growth 2024-2029 (%)
- Exhibits90: Chart on Others - Market size and forecast 2024-2029 ($ million)
- Exhibits91: Data Table on Others - Market size and forecast 2024-2029 ($ million)
- Exhibits92: Chart on Others - Year-over-year growth 2024-2029 (%)
- Exhibits93: Data Table on Others - Year-over-year growth 2024-2029 (%)
- Exhibits94: Market opportunity by Product Type ($ million)
- Exhibits95: Data Table on Market opportunity by Product Type ($ million)
- Exhibits96: Analysis of price sensitivity, lifecycle, customer purchase basket, adoption rates, and purchase criteria
- Exhibits97: Chart on Market share By Geographical Landscape 2024-2029 (%)
- Exhibits98: Data Table on Market share By Geographical Landscape 2024-2029 (%)
- Exhibits99: Chart on Geographic comparison
- Exhibits100: Data Table on Geographic comparison
- Exhibits101: Chart on North America - Market size and forecast 2024-2029 ($ million)
- Exhibits102: Data Table on North America - Market size and forecast 2024-2029 ($ million)
- Exhibits103: Chart on North America - Year-over-year growth 2024-2029 (%)
- Exhibits104: Data Table on North America - Year-over-year growth 2024-2029 (%)
- Exhibits105: Chart on Europe - Market size and forecast 2024-2029 ($ million)
- Exhibits106: Data Table on Europe - Market size and forecast 2024-2029 ($ million)
- Exhibits107: Chart on Europe - Year-over-year growth 2024-2029 (%)
- Exhibits108: Data Table on Europe - Year-over-year growth 2024-2029 (%)
- Exhibits109: Chart on Asia - Market size and forecast 2024-2029 ($ million)
- Exhibits110: Data Table on Asia - Market size and forecast 2024-2029 ($ million)
- Exhibits111: Chart on Asia - Year-over-year growth 2024-2029 (%)
- Exhibits112: Data Table on Asia - Year-over-year growth 2024-2029 (%)
- Exhibits113: Chart on Rest of World (ROW) - Market size and forecast 2024-2029 ($ million)
- Exhibits114: Data Table on Rest of World (ROW) - Market size and forecast 2024-2029 ($ million)
- Exhibits115: Chart on Rest of World (ROW) - Year-over-year growth 2024-2029 (%)
- Exhibits116: Data Table on Rest of World (ROW) - Year-over-year growth 2024-2029 (%)
- Exhibits117: Chart on US - Market size and forecast 2024-2029 ($ million)
- Exhibits118: Data Table on US - Market size and forecast 2024-2029 ($ million)
- Exhibits119: Chart on US - Year-over-year growth 2024-2029 (%)
- Exhibits120: Data Table on US - Year-over-year growth 2024-2029 (%)
- Exhibits121: Chart on Germany - Market size and forecast 2024-2029 ($ million)
- Exhibits122: Data Table on Germany - Market size and forecast 2024-2029 ($ million)
- Exhibits123: Chart on Germany - Year-over-year growth 2024-2029 (%)
- Exhibits124: Data Table on Germany - Year-over-year growth 2024-2029 (%)
- Exhibits125: Chart on Canada - Market size and forecast 2024-2029 ($ million)
- Exhibits126: Data Table on Canada - Market size and forecast 2024-2029 ($ million)
- Exhibits127: Chart on Canada - Year-over-year growth 2024-2029 (%)
- Exhibits128: Data Table on Canada - Year-over-year growth 2024-2029 (%)
- Exhibits129: Chart on India - Market size and forecast 2024-2029 ($ million)
- Exhibits130: Data Table on India - Market size and forecast 2024-2029 ($ million)
- Exhibits131: Chart on India - Year-over-year growth 2024-2029 (%)
- Exhibits132: Data Table on India - Year-over-year growth 2024-2029 (%)
- Exhibits133: Chart on UK - Market size and forecast 2024-2029 ($ million)
- Exhibits134: Data Table on UK - Market size and forecast 2024-2029 ($ million)
- Exhibits135: Chart on UK - Year-over-year growth 2024-2029 (%)
- Exhibits136: Data Table on UK - Year-over-year growth 2024-2029 (%)
- Exhibits137: Chart on China - Market size and forecast 2024-2029 ($ million)
- Exhibits138: Data Table on China - Market size and forecast 2024-2029 ($ million)
- Exhibits139: Chart on China - Year-over-year growth 2024-2029 (%)
- Exhibits140: Data Table on China - Year-over-year growth 2024-2029 (%)
- Exhibits141: Chart on France - Market size and forecast 2024-2029 ($ million)
- Exhibits142: Data Table on France - Market size and forecast 2024-2029 ($ million)
- Exhibits143: Chart on France - Year-over-year growth 2024-2029 (%)
- Exhibits144: Data Table on France - Year-over-year growth 2024-2029 (%)
- Exhibits145: Chart on Brazil - Market size and forecast 2024-2029 ($ million)
- Exhibits146: Data Table on Brazil - Market size and forecast 2024-2029 ($ million)
- Exhibits147: Chart on Brazil - Year-over-year growth 2024-2029 (%)
- Exhibits148: Data Table on Brazil - Year-over-year growth 2024-2029 (%)
- Exhibits149: Chart on Japan - Market size and forecast 2024-2029 ($ million)
- Exhibits150: Data Table on Japan - Market size and forecast 2024-2029 ($ million)
- Exhibits151: Chart on Japan - Year-over-year growth 2024-2029 (%)
- Exhibits152: Data Table on Japan - Year-over-year growth 2024-2029 (%)
- Exhibits153: Chart on Italy - Market size and forecast 2024-2029 ($ million)
- Exhibits154: Data Table on Italy - Market size and forecast 2024-2029 ($ million)
- Exhibits155: Chart on Italy - Year-over-year growth 2024-2029 (%)
- Exhibits156: Data Table on Italy - Year-over-year growth 2024-2029 (%)
- Exhibits157: Market opportunity By Geographical Landscape ($ million)
- Exhibits158: Data Tables on Market opportunity By Geographical Landscape ($ million)
- Exhibits159: Impact of drivers and challenges in 2024 and 2029
- Exhibits160: Overview on criticality of inputs and factors of differentiation
- Exhibits161: Overview on factors of disruption
- Exhibits162: Impact of key risks on business
- Exhibits163: Companies covered
- Exhibits164: Company ranking index
- Exhibits165: Matrix on companies position and classification
- Exhibits166: Absolute collagen - Overview
- Exhibits167: Absolute collagen - Product / Service
- Exhibits168: Absolute collagen - Key offerings
- Exhibits169: SWOT
- Exhibits170: Codeage LLC - Overview
- Exhibits171: Codeage LLC - Product / Service
- Exhibits172: Codeage LLC - Key offerings
- Exhibits173: SWOT
- Exhibits174: DSM-Firmenich AG - Overview
- Exhibits175: DSM-Firmenich AG - Business segments
- Exhibits176: DSM-Firmenich AG - Key news
- Exhibits177: DSM-Firmenich AG - Key offerings
- Exhibits178: DSM-Firmenich AG - Segment focus
- Exhibits179: SWOT
- Exhibits180: Glanbia plc - Overview
- Exhibits181: Glanbia plc - Business segments
- Exhibits182: Glanbia plc - Key news
- Exhibits183: Glanbia plc - Key offerings
- Exhibits184: Glanbia plc - Segment focus
- Exhibits185: SWOT
- Exhibits186: Hunter and Gather Foods Ltd. - Overview
- Exhibits187: Hunter and Gather Foods Ltd. - Product / Service
- Exhibits188: Hunter and Gather Foods Ltd. - Key offerings
- Exhibits189: SWOT
- Exhibits190: Nestle SA - Overview
- Exhibits191: Nestle SA - Business segments
- Exhibits192: Nestle SA - Key news
- Exhibits193: Nestle SA - Key offerings
- Exhibits194: Nestle SA - Segment focus
- Exhibits195: SWOT
- Exhibits196: PROTEIN SA - Overview
- Exhibits197: PROTEIN SA - Product / Service
- Exhibits198: PROTEIN SA - Key offerings
- Exhibits199: SWOT
- Exhibits200: Proto col - Overview
- Exhibits201: Proto col - Product / Service
- Exhibits202: Proto col - Key offerings
- Exhibits203: SWOT
- Exhibits204: Rejuvenated Ltd. - Overview
- Exhibits205: Rejuvenated Ltd. - Product / Service
- Exhibits206: Rejuvenated Ltd. - Key offerings
- Exhibits207: SWOT
- Exhibits208: Revive Collagen - Overview
- Exhibits209: Revive Collagen - Product / Service
- Exhibits210: Revive Collagen - Key offerings
- Exhibits211: SWOT
- Exhibits212: Shiseido Co. Ltd. - Overview
- Exhibits213: Shiseido Co. Ltd. - Product / Service
- Exhibits214: Shiseido Co. Ltd. - Key news
- Exhibits215: Shiseido Co. Ltd. - Key offerings
- Exhibits216: SWOT
- Exhibits217: The Carlyle Group Inc. - Overview
- Exhibits218: The Carlyle Group Inc. - Business segments
- Exhibits219: The Carlyle Group Inc. - Key news
- Exhibits220: The Carlyle Group Inc. - Key offerings
- Exhibits221: The Carlyle Group Inc. - Segment focus
- Exhibits222: SWOT
- Exhibits223: The Clorox Co. - Overview
- Exhibits224: The Clorox Co. - Business segments
- Exhibits225: The Clorox Co. - Key news
- Exhibits226: The Clorox Co. - Key offerings
- Exhibits227: The Clorox Co. - Segment focus
- Exhibits228: SWOT
- Exhibits229: Titan Biotech Ltd. - Overview
- Exhibits230: Titan Biotech Ltd. - Product / Service
- Exhibits231: Titan Biotech Ltd. - Key offerings
- Exhibits232: SWOT
- Exhibits233: ZENii Ltd. - Overview
- Exhibits234: ZENii Ltd. - Product / Service
- Exhibits235: ZENii Ltd. - Key offerings
- Exhibits236: SWOT
- Exhibits237: Inclusions checklist
- Exhibits238: Exclusions checklist
- Exhibits239: Currency conversion rates for US$
- Exhibits240: Research methodology
- Exhibits241: Information sources
- Exhibits242: Data validation
- Exhibits243: Validation techniques employed for market sizing
- Exhibits244: Data synthesis
- Exhibits245: 360 degree market analysis
- Exhibits246: List of abbreviations
The collagen supplement market is forecasted to grow by USD 1,024.1 mn during 2024-2029, accelerating at a CAGR of 7.1% during the forecast period. The report on the collagen supplement market provides a holistic analysis, market size and forecast, trends, growth drivers, and challenges, as well as vendor analysis covering around 25 vendors.
The report offers an up-to-date analysis regarding the current market scenario, the latest trends and drivers, and the overall market environment. The market is driven by increasing adoption of collagen supplements to improve joint conditions and support bone health, increasing prevalence of digestive problems, and health benefits of collagen supplements.
| Market Scope | |
|---|---|
| Base Year | 2025 |
| End Year | 2029 |
| Series Year | 2025-2029 |
| Growth Momentum | Accelerate |
| YOY 2025 | 6.5% |
| CAGR | 7.1% |
| Incremental Value | $1,024.1 mn |
The study was conducted using an objective combination of primary and secondary information including inputs from key participants in the industry. The report contains a comprehensive market size data, segment with regional analysis and vendor landscape in addition to an analysis of the key companies. Reports have historic and forecast data.
Technavio's collagen supplement market is segmented as below:
By Distribution Channel
- Online
- Offline
By Source
- Bovine
- Porcine
- Marine and poultry
By Product Type
- Powder
- Liquid
- Capsules
- Tablets
- Others
By Geographical Landscape
- North America
- Europe
- Asia
- Rest of World (ROW)
This study identifies the strategic initiatives of market companies as one of the prime reasons driving the collagen supplement market growth during the next few years. Also, increasing prevalence of osteoporosis and rising applications of collagen in cosmetic and personal care industry will lead to sizable demand in the market.
The report on the collagen supplement market covers the following areas:
- Collagen Supplement Market sizing
- Collagen Supplement Market forecast
- Collagen Supplement Market industry analysis
The robust vendor analysis is designed to help clients improve their market position, and in line with this, this report provides a detailed analysis of several leading collagen supplement market vendors that include Absolute collagen, Ancient Nutrition, Codeage LLC, ConnOils LLC, Darling Ingredients Inc., DSM-Firmenich AG, Glanbia plc, Hunter and Gather Foods Ltd., Life Extension Foundation Buyers Club Inc., Nestle SA, Nitta Gelatin Inc., PROTEIN SA, Proto col, Rejuvenated Ltd., Revive Collagen, Shiseido Co. Ltd., The Carlyle Group Inc., The Clorox Co., Titan Biotech Ltd., and ZENii Ltd.. Also, the collagen supplement market analysis report includes information on upcoming trends and challenges that will influence market growth. This is to help companies strategize and leverage all forthcoming growth opportunities.
The publisher presents a detailed picture of the market by the way of study, synthesis, and summation of data from multiple sources by an analysis of key parameters such as profit, pricing, competition, and promotions. It presents various market facets by identifying the key industry influencers. The data presented is comprehensive, reliable, and a result of extensive primary and secondary research. The market research reports provide a complete competitive landscape and an in-depth vendor selection methodology and analysis using qualitative and quantitative research to forecast accurate market growth.
Table of Contents
1 Executive Summary
- 1.1 Market overview
- Executive Summary - Chart on Market Overview
- Executive Summary - Data Table on Market Overview
- Executive Summary - Chart on Global Market Characteristics
- Executive Summary - Chart on Market By Geographical Landscape
- Executive Summary - Chart on Market Segmentation by Distribution Channel
- Executive Summary - Chart on Market Segmentation by Source
- Executive Summary - Chart on Market Segmentation by Product Type
- Executive Summary - Chart on Incremental Growth
- Executive Summary - Data Table on Incremental Growth
- Executive Summary - Chart on Company Market Positioning
2 Technavio Analysis
- 2.1 Analysis of price sensitivity, lifecycle, customer purchase basket, adoption rates, and purchase criteria
- Analysis of price sensitivity, lifecycle, customer purchase basket, adoption rates, and purchase criteria
- 2.2 Criticality of inputs and Factors of differentiation
- Overview on criticality of inputs and factors of differentiation
- 2.3 Factors of disruption
- Overview on factors of disruption
- 2.4 Impact of drivers and challenges
- Impact of drivers and challenges in 2024 and 2029
3 Market Landscape
- 3.1 Market ecosystem
- Parent Market
- Data Table on - Parent Market
- 3.2 Market characteristics
- Market characteristics analysis
- 3.3 Value chain analysis
- Value chain analysis
4 Market Sizing
- 4.1 Market definition
- Offerings of companies included in the market definition
- 4.2 Market segment analysis
- Market segments
- 4.3 Market size 2024
- 4.4 Market outlook: Forecast for 2024-2029
- Chart on Global - Market size and forecast 2024-2029 ($ million)
- Data Table on Global - Market size and forecast 2024-2029 ($ million)
- Chart on Global Market: Year-over-year growth 2024-2029 (%)
- Data Table on Global Market: Year-over-year growth 2024-2029 (%)
5 Historic Market Size
- 5.1 Global Collagen Supplement Market 2019 - 2023
- Historic Market Size - Data Table on Global Collagen Supplement Market 2019 - 2023 ($ million)
- 5.2 Distribution Channel segment analysis 2019 - 2023
- Historic Market Size - Distribution Channel Segment 2019 - 2023 ($ million)
- 5.3 Source segment analysis 2019 - 2023
- Historic Market Size - Source Segment 2019 - 2023 ($ million)
- 5.4 Product Type segment analysis 2019 - 2023
- Historic Market Size - Product Type Segment 2019 - 2023 ($ million)
- 5.5 Geography segment analysis 2019 - 2023
- Historic Market Size - Geography Segment 2019 - 2023 ($ million)
- 5.6 Country segment analysis 2019 - 2023
- Historic Market Size - Country Segment 2019 - 2023 ($ million)
6 Qualitative Analysis
- 6.1 The AI impact on global collagen supplement market
7 Five Forces Analysis
- 7.1 Five forces summary
- Five forces analysis - Comparison between 2024 and 2029
- 7.2 Bargaining power of buyers
- Bargaining power of buyers - Impact of key factors 2024 and 2029
- 7.3 Bargaining power of suppliers
- Bargaining power of suppliers - Impact of key factors in 2024 and 2029
- 7.4 Threat of new entrants
- Threat of new entrants - Impact of key factors in 2024 and 2029
- 7.5 Threat of substitutes
- Threat of substitutes - Impact of key factors in 2024 and 2029
- 7.6 Threat of rivalry
- Threat of rivalry - Impact of key factors in 2024 and 2029
- 7.7 Market condition
- Chart on Market condition - Five forces 2024 and 2029
8 Market Segmentation by Distribution Channel
- 8.1 Market segments
- Chart on Distribution Channel - Market share 2024-2029 (%)
- Data Table on Distribution Channel - Market share 2024-2029 (%)
- 8.2 Comparison by Distribution Channel
- Chart on Comparison by Distribution Channel
- Data Table on Comparison by Distribution Channel
- 8.3 Online - Market size and forecast 2024-2029
- Chart on Online - Market size and forecast 2024-2029 ($ million)
- Data Table on Online - Market size and forecast 2024-2029 ($ million)
- Chart on Online - Year-over-year growth 2024-2029 (%)
- Data Table on Online - Year-over-year growth 2024-2029 (%)
- 8.4 Offline - Market size and forecast 2024-2029
- Chart on Offline - Market size and forecast 2024-2029 ($ million)
- Data Table on Offline - Market size and forecast 2024-2029 ($ million)
- Chart on Offline - Year-over-year growth 2024-2029 (%)
- Data Table on Offline - Year-over-year growth 2024-2029 (%)
- 8.5 Market opportunity by Distribution Channel
- Market opportunity by Distribution Channel ($ million)
- Data Table on Market opportunity by Distribution Channel ($ million)
9 Market Segmentation by Source
- 9.1 Market segments
- Chart on Source - Market share 2024-2029 (%)
- Data Table on Source - Market share 2024-2029 (%)
- 9.2 Comparison by Source
- Chart on Comparison by Source
- Data Table on Comparison by Source
- 9.3 Bovine - Market size and forecast 2024-2029
- Chart on Bovine - Market size and forecast 2024-2029 ($ million)
- Data Table on Bovine - Market size and forecast 2024-2029 ($ million)
- Chart on Bovine - Year-over-year growth 2024-2029 (%)
- Data Table on Bovine - Year-over-year growth 2024-2029 (%)
- 9.4 Porcine - Market size and forecast 2024-2029
- Chart on Porcine - Market size and forecast 2024-2029 ($ million)
- Data Table on Porcine - Market size and forecast 2024-2029 ($ million)
- Chart on Porcine - Year-over-year growth 2024-2029 (%)
- Data Table on Porcine - Year-over-year growth 2024-2029 (%)
- 9.5 Marine and poultry - Market size and forecast 2024-2029
- Chart on Marine and poultry - Market size and forecast 2024-2029 ($ million)
- Data Table on Marine and poultry - Market size and forecast 2024-2029 ($ million)
- Chart on Marine and poultry - Year-over-year growth 2024-2029 (%)
- Data Table on Marine and poultry - Year-over-year growth 2024-2029 (%)
- 9.6 Market opportunity by Source
- Market opportunity by Source ($ million)
- Data Table on Market opportunity by Source ($ million)
10 Market Segmentation by Product Type
- 10.1 Market segments
- Chart on Product Type - Market share 2024-2029 (%)
- Data Table on Product Type - Market share 2024-2029 (%)
- 10.2 Comparison by Product Type
- Chart on Comparison by Product Type
- Data Table on Comparison by Product Type
- 10.3 Capsules - Market size and forecast 2024-2029
- Chart on Capsules - Market size and forecast 2024-2029 ($ million)
- Data Table on Capsules - Market size and forecast 2024-2029 ($ million)
- Chart on Capsules - Year-over-year growth 2024-2029 (%)
- Data Table on Capsules - Year-over-year growth 2024-2029 (%)
- 10.4 Powder - Market size and forecast 2024-2029
- Chart on Powder - Market size and forecast 2024-2029 ($ million)
- Data Table on Powder - Market size and forecast 2024-2029 ($ million)
- Chart on Powder - Year-over-year growth 2024-2029 (%)
- Data Table on Powder - Year-over-year growth 2024-2029 (%)
- 10.5 Tablets - Market size and forecast 2024-2029
- Chart on Tablets - Market size and forecast 2024-2029 ($ million)
- Data Table on Tablets - Market size and forecast 2024-2029 ($ million)
- Chart on Tablets - Year-over-year growth 2024-2029 (%)
- Data Table on Tablets - Year-over-year growth 2024-2029 (%)
- 10.6 Liquid - Market size and forecast 2024-2029
- Chart on Liquid - Market size and forecast 2024-2029 ($ million)
- Data Table on Liquid - Market size and forecast 2024-2029 ($ million)
- Chart on Liquid - Year-over-year growth 2024-2029 (%)
- Data Table on Liquid - Year-over-year growth 2024-2029 (%)
- 10.7 Others - Market size and forecast 2024-2029
- Chart on Others - Market size and forecast 2024-2029 ($ million)
- Data Table on Others - Market size and forecast 2024-2029 ($ million)
- Chart on Others - Year-over-year growth 2024-2029 (%)
- Data Table on Others - Year-over-year growth 2024-2029 (%)
- 10.8 Market opportunity by Product Type
- Market opportunity by Product Type ($ million)
- Data Table on Market opportunity by Product Type ($ million)
11 Customer Landscape
- 11.1 Customer landscape overview
- Analysis of price sensitivity, lifecycle, customer purchase basket, adoption rates, and purchase criteria
12 Geographic Landscape
- 12.1 Geographic segmentation
- Chart on Market share By Geographical Landscape 2024-2029 (%)
- Data Table on Market share By Geographical Landscape 2024-2029 (%)
- 12.2 Geographic comparison
- Chart on Geographic comparison
- Data Table on Geographic comparison
- 12.3 North America - Market size and forecast 2024-2029
- Chart on North America - Market size and forecast 2024-2029 ($ million)
- Data Table on North America - Market size and forecast 2024-2029 ($ million)
- Chart on North America - Year-over-year growth 2024-2029 (%)
- Data Table on North America - Year-over-year growth 2024-2029 (%)
- 12.4 Europe - Market size and forecast 2024-2029
- Chart on Europe - Market size and forecast 2024-2029 ($ million)
- Data Table on Europe - Market size and forecast 2024-2029 ($ million)
- Chart on Europe - Year-over-year growth 2024-2029 (%)
- Data Table on Europe - Year-over-year growth 2024-2029 (%)
- 12.5 Asia - Market size and forecast 2024-2029
- Chart on Asia - Market size and forecast 2024-2029 ($ million)
- Data Table on Asia - Market size and forecast 2024-2029 ($ million)
- Chart on Asia - Year-over-year growth 2024-2029 (%)
- Data Table on Asia - Year-over-year growth 2024-2029 (%)
- 12.6 Rest of World (ROW) - Market size and forecast 2024-2029
- Chart on Rest of World (ROW) - Market size and forecast 2024-2029 ($ million)
- Data Table on Rest of World (ROW) - Market size and forecast 2024-2029 ($ million)
- Chart on Rest of World (ROW) - Year-over-year growth 2024-2029 (%)
- Data Table on Rest of World (ROW) - Year-over-year growth 2024-2029 (%)
- 12.7 US - Market size and forecast 2024-2029
- Chart on US - Market size and forecast 2024-2029 ($ million)
- Data Table on US - Market size and forecast 2024-2029 ($ million)
- Chart on US - Year-over-year growth 2024-2029 (%)
- Data Table on US - Year-over-year growth 2024-2029 (%)
- 12.8 Germany - Market size and forecast 2024-2029
- Chart on Germany - Market size and forecast 2024-2029 ($ million)
- Data Table on Germany - Market size and forecast 2024-2029 ($ million)
- Chart on Germany - Year-over-year growth 2024-2029 (%)
- Data Table on Germany - Year-over-year growth 2024-2029 (%)
- 12.9 Canada - Market size and forecast 2024-2029
- Chart on Canada - Market size and forecast 2024-2029 ($ million)
- Data Table on Canada - Market size and forecast 2024-2029 ($ million)
- Chart on Canada - Year-over-year growth 2024-2029 (%)
- Data Table on Canada - Year-over-year growth 2024-2029 (%)
- 12.10 India - Market size and forecast 2024-2029
- Chart on India - Market size and forecast 2024-2029 ($ million)
- Data Table on India - Market size and forecast 2024-2029 ($ million)
- Chart on India - Year-over-year growth 2024-2029 (%)
- Data Table on India - Year-over-year growth 2024-2029 (%)
- 12.11 UK - Market size and forecast 2024-2029
- Chart on UK - Market size and forecast 2024-2029 ($ million)
- Data Table on UK - Market size and forecast 2024-2029 ($ million)
- Chart on UK - Year-over-year growth 2024-2029 (%)
- Data Table on UK - Year-over-year growth 2024-2029 (%)
- 12.12 China - Market size and forecast 2024-2029
- Chart on China - Market size and forecast 2024-2029 ($ million)
- Data Table on China - Market size and forecast 2024-2029 ($ million)
- Chart on China - Year-over-year growth 2024-2029 (%)
- Data Table on China - Year-over-year growth 2024-2029 (%)
- 12.13 France - Market size and forecast 2024-2029
- Chart on France - Market size and forecast 2024-2029 ($ million)
- Data Table on France - Market size and forecast 2024-2029 ($ million)
- Chart on France - Year-over-year growth 2024-2029 (%)
- Data Table on France - Year-over-year growth 2024-2029 (%)
- 12.14 Brazil - Market size and forecast 2024-2029
- Chart on Brazil - Market size and forecast 2024-2029 ($ million)
- Data Table on Brazil - Market size and forecast 2024-2029 ($ million)
- Chart on Brazil - Year-over-year growth 2024-2029 (%)
- Data Table on Brazil - Year-over-year growth 2024-2029 (%)
- 12.15 Japan - Market size and forecast 2024-2029
- Chart on Japan - Market size and forecast 2024-2029 ($ million)
- Data Table on Japan - Market size and forecast 2024-2029 ($ million)
- Chart on Japan - Year-over-year growth 2024-2029 (%)
- Data Table on Japan - Year-over-year growth 2024-2029 (%)
- 12.16 Italy - Market size and forecast 2024-2029
- Chart on Italy - Market size and forecast 2024-2029 ($ million)
- Data Table on Italy - Market size and forecast 2024-2029 ($ million)
- Chart on Italy - Year-over-year growth 2024-2029 (%)
- Data Table on Italy - Year-over-year growth 2024-2029 (%)
- 12.17 Market opportunity By Geographical Landscape
- Market opportunity By Geographical Landscape ($ million)
- Data Tables on Market opportunity By Geographical Landscape ($ million)
13 Drivers, Challenges, and Opportunity/Restraints
- 13.1 Market drivers
- 13.2 Market challenges
- 13.3 Impact of drivers and challenges
- Impact of drivers and challenges in 2024 and 2029
- 13.4 Market opportunities/restraints
14 Competitive Landscape
- 14.1 Overview
- 14.2 Competitive Landscape
- Overview on criticality of inputs and factors of differentiation
- 14.3 Landscape disruption
- Overview on factors of disruption
- 14.4 Industry risks
- Impact of key risks on business
15 Competitive Analysis
- 15.1 Companies profiled
- Companies covered
- 15.2 Company ranking index
- Company ranking index
- 15.3 Market positioning of companies
- Matrix on companies position and classification
- 15.4 Absolute collagen
- Absolute collagen - Overview
- Absolute collagen - Product / Service
- Absolute collagen - Key offerings
- SWOT
- 15.5 Codeage LLC
- Codeage LLC - Overview
- Codeage LLC - Product / Service
- Codeage LLC - Key offerings
- SWOT
- 15.6 DSM-Firmenich AG
- DSM-Firmenich AG - Overview
- DSM-Firmenich AG - Business segments
- DSM-Firmenich AG - Key news
- DSM-Firmenich AG - Key offerings
- DSM-Firmenich AG - Segment focus
- SWOT
- 15.7 Glanbia plc
- Glanbia plc - Overview
- Glanbia plc - Business segments
- Glanbia plc - Key news
- Glanbia plc - Key offerings
- Glanbia plc - Segment focus
- SWOT
- 15.8 Hunter and Gather Foods Ltd.
- Hunter and Gather Foods Ltd. - Overview
- Hunter and Gather Foods Ltd. - Product / Service
- Hunter and Gather Foods Ltd. - Key offerings
- SWOT
- 15.9 Nestle SA
- Nestle SA - Overview
- Nestle SA - Business segments
- Nestle SA - Key news
- Nestle SA - Key offerings
- Nestle SA - Segment focus
- SWOT
- 15.10 PROTEIN SA
- PROTEIN SA - Overview
- PROTEIN SA - Product / Service
- PROTEIN SA - Key offerings
- SWOT
- 15.11 Proto col
- Proto col - Overview
- Proto col - Product / Service
- Proto col - Key offerings
- SWOT
- 15.12 Rejuvenated Ltd.
- Rejuvenated Ltd. - Overview
- Rejuvenated Ltd. - Product / Service
- Rejuvenated Ltd. - Key offerings
- SWOT
- 15.13 Revive Collagen
- Revive Collagen - Overview
- Revive Collagen - Product / Service
- Revive Collagen - Key offerings
- SWOT
- 15.14 Shiseido Co. Ltd.
- Shiseido Co. Ltd. - Overview
- Shiseido Co. Ltd. - Product / Service
- Shiseido Co. Ltd. - Key news
- Shiseido Co. Ltd. - Key offerings
- SWOT
- 15.15 The Carlyle Group Inc.
- The Carlyle Group Inc. - Overview
- The Carlyle Group Inc. - Business segments
- The Carlyle Group Inc. - Key news
- The Carlyle Group Inc. - Key offerings
- The Carlyle Group Inc. - Segment focus
- SWOT
- 15.16 The Clorox Co.
- The Clorox Co. - Overview
- The Clorox Co. - Business segments
- The Clorox Co. - Key news
- The Clorox Co. - Key offerings
- The Clorox Co. - Segment focus
- SWOT
- 15.17 Titan Biotech Ltd.
- Titan Biotech Ltd. - Overview
- Titan Biotech Ltd. - Product / Service
- Titan Biotech Ltd. - Key offerings
- SWOT
- 15.18 ZENii Ltd.
- ZENii Ltd. - Overview
- ZENii Ltd. - Product / Service
- ZENii Ltd. - Key offerings
- SWOT
16 Appendix
- 16.1 Scope of the report
- 16.2 Inclusions and exclusions checklist
- Inclusions checklist
- Exclusions checklist
- 16.3 Currency conversion rates for US$
- Currency conversion rates for US$
- 16.4 Research methodology
- Research methodology
- 16.5 Data procurement
- Information sources
- 16.6 Data validation
- Data validation
- 16.7 Validation techniques employed for market sizing
- Validation techniques employed for market sizing
- 16.8 Data synthesis
- Data synthesis
- 16.9 360 degree market analysis
- 360 degree market analysis
- 16.10 List of abbreviations
- List of abbreviations

