|
|
市場調査レポート
商品コード
1557742
金属処理薬品の世界市場、2024~2028年Global Metal Treatment Chemical Market 2024-2028 |
||||||

|
|||||||
カスタマイズ可能
|
|||||||


| 金属処理薬品の世界市場、2024~2028年 |
|
出版日: 2024年08月03日
発行: TechNavio
ページ情報: 英文 213 Pages
納期: 即納可能
|

全表示
- 概要
- 図表
- 目次
金属処理薬品市場は2023~2028年に99億9,480万米ドル、予測期間中のCAGRは5.49%で成長すると予測されます。
当レポートでは、金属処理薬品市場の全体的な分析、市場規模・予測、動向、成長促進要因、課題、約25のベンダーを網羅したベンダー分析などを掲載しています。
現在の市場シナリオ、最新動向と促進要因、市場環境全体に関する最新分析を提供しています。市場は、信頼性の高い機械とその効果的なメンテナンスに対するニーズの高まり、世界の海洋産業の成長、高性能金属処理薬品に対するニーズを促進する機械の技術的アップグレードによって牽引されています。
| 市場範囲 | |
|---|---|
| 基準年 | 2024年 |
| 終了年 | 2028年 |
| 予測期間 | 2024~2028年 |
| 成長モメンタム | 加速 |
| 前年比[2024年] | 5.21% |
| CAGR | 5.49% |
| 増分額 | 99億9,480万米ドル |
本調査では、バイオベースの金属処理薬品の出現が、今後数年間の金属処理薬品市場成長を牽引する主要因の1つであるとしています。また、水性金属処理薬品の需要増加や軽量コーティングへのシフトは、市場の大きな需要につながります。
目次
第1章 エグゼクティブサマリー
- 市場概要
第2章 Technavio分析
- 価格・ライフサイクル・顧客購入バスケット・採用率・購入基準の分析
- インプットの重要性と差別化の要因
- 混乱の要因
- 促進要因と課題の影響
第3章 市場情勢
- 市場エコシステム
- 市場の特徴
- バリューチェーン分析
第4章 市場規模の評価
- 市場の定義
- 市場セグメント分析
- 市場規模 2023年
- 市場の展望 2023~2028年
第5章 市場規模実績
- 金属処理薬品の世界市場 2018~2022年
- タイプ別セグメント分析 2018~2022年
- 用途別セグメント分析 2018~2022年
- 地域別セグメント分析 2018~2022年
- 国別セグメント分析 2018~2022年
第6章 付加価値/数量データ
- 金属処理薬品、国別市場 2023~2028年
第7章 ファイブフォース分析
- ファイブフォースの要約
- 買い手の交渉力
- 供給企業の交渉力
- 新規参入業者の脅威
- 代替品の脅威
- 競争の脅威
- 市況
第8章 市場セグメンテーション:タイプ別
- 市場セグメンテーション
- 比較:タイプ別
- クリーナー:市場規模と予測 2023~2028年
- 潤滑剤と冷却剤:市場規模と予測 2023~2028年
- 化成コーティング:市場規模と予測 2023~2028年
- 錆・スケール除去剤:市場規模と予測 2023~2028年
- その他:市場規模と予測 2023~2028年
- 市場機会:タイプ別
第9章 市場セグメンテーション:用途別
- 市場セグメンテーション
- 比較:用途別
- 自動車:市場規模と予測 2023~2028年
- 製造業:市場規模と予測 2023~2028年
- 建設:市場規模と予測 2023~2028年
- 航空宇宙:市場規模と予測 2023~2028年
- 金属加工その他:市場規模と予測 2023~2028年
- 市場機会:用途別
第10章 顧客情勢
- 顧客情勢概要
第11章 地域別情勢
- 地域別セグメンテーション
- 比較:地域別
- アジア太平洋:市場規模と予測 2023~2028年
- 北米:市場規模と予測 2023~2028年
- 欧州:市場規模と予測 2023~2028年
- 南米:市場規模と予測 2023~2028年
- 中東・アフリカ:市場規模と予測 2023~2028年
- 米国:市場規模と予測 2023~2028年
- 中国:市場規模と予測 2023~2028年
- インド:市場規模と予測 2023~2028年
- 英国:市場規模と予測 2023~2028年
- メキシコ:市場規模と予測 2023~2028年
- ドイツ:市場規模と予測 2023~2028年
- 市場機会:地域別
第12章 促進要因・課題・機会・抑制要因
- 市場促進要因
- 市場課題
- 促進要因と課題の影響
- 市場の機会・抑制要因
第13章 競合情勢
- 概要
- 競合情勢
- 混乱の状況
- 業界のリスク
第14章 競合分析
- 企業プロファイル
- 企業ランキング指数
- 企業の市場ポジショニング
- AD International B.V.
- Algol Chemicals
- AL-SAIF CHEMICAL MANUFACTURING
- BASF SE
- Chemetall GmbH
- Dimetrics Chemicals Pvt Ltd
- Diya Chemicals
- Dow Inc.
- Eastman Chemical Co.
- Evonik Industries AG
- Nihon Parkerizing Co., Ltd.
- Sanko Shokai Co., Ltd.
- Shandong IRO Chelating Chemical Co. Ltd.
- Vanchem Performance Chemicals
- Wuhan Jadechem International Trade Co.,Ltd.
第15章 付録
Exhibits:
- Exhibits1: Executive Summary - Chart on Market Overview
- Exhibits2: Executive Summary - Data Table on Market Overview
- Exhibits3: Executive Summary - Chart on Global Market Characteristics
- Exhibits4: Executive Summary - Chart on Market by Geography
- Exhibits5: Executive Summary - Chart on Market Segmentation by Type
- Exhibits6: Executive Summary - Chart on Market Segmentation by Application
- Exhibits7: Executive Summary - Chart on Incremental Growth
- Exhibits8: Executive Summary - Data Table on Incremental Growth
- Exhibits9: Executive Summary - Chart on Company Market Positioning
- Exhibits10: Analysis of price sensitivity, lifecycle, customer purchase basket, adoption rates, and purchase criteria
- Exhibits11: Overview on criticality of inputs and factors of differentiation
- Exhibits12: Overview on factors of disruption
- Exhibits13: Impact of drivers and challenges in 2023 and 2028
- Exhibits14: Parent Market
- Exhibits15: Data Table on - Parent Market
- Exhibits16: Market characteristics analysis
- Exhibits17: Value Chain Analysis
- Exhibits18: Offerings of companies included in the market definition
- Exhibits19: Market segments
- Exhibits20: Chart on Global - Market size and forecast 2023-2028 ($ million)
- Exhibits21: Data Table on Global - Market size and forecast 2023-2028 ($ million)
- Exhibits22: Chart on Global Market: Year-over-year growth 2023-2028 (%)
- Exhibits23: Data Table on Global Market: Year-over-year growth 2023-2028 (%)
- Exhibits24: Historic Market Size - Data Table on Global Metal Treatment Chemical Market 2018 - 2022 ($ million)
- Exhibits25: Historic Market Size - Type Segment 2018 - 2022 ($ million)
- Exhibits26: Historic Market Size - Application Segment 2018 - 2022 ($ million)
- Exhibits27: Historic Market Size - Geography Segment 2018 - 2022 ($ million)
- Exhibits28: Historic Market Size - Country Segment 2018 - 2022 ($ million)
- Exhibits29: Market Size (value) - Data Table on metal treatment chemical market by Country 2023 - 2028 ($ million)
- Exhibits30: Five forces analysis - Comparison between 2023 and 2028
- Exhibits31: Bargaining power of buyers - Impact of key factors 2023 and 2028
- Exhibits32: Bargaining power of suppliers - Impact of key factors in 2023 and 2028
- Exhibits33: Threat of new entrants - Impact of key factors in 2023 and 2028
- Exhibits34: Threat of substitutes - Impact of key factors in 2023 and 2028
- Exhibits35: Threat of rivalry - Impact of key factors in 2023 and 2028
- Exhibits36: Chart on Market condition - Five forces 2023 and 2028
- Exhibits37: Chart on Type - Market share 2023-2028 (%)
- Exhibits38: Data Table on Type - Market share 2023-2028 (%)
- Exhibits39: Chart on Comparison by Type
- Exhibits40: Data Table on Comparison by Type
- Exhibits41: Chart on Cleaners - Market size and forecast 2023-2028 ($ million)
- Exhibits42: Data Table on Cleaners - Market size and forecast 2023-2028 ($ million)
- Exhibits43: Chart on Cleaners - Year-over-year growth 2023-2028 (%)
- Exhibits44: Data Table on Cleaners - Year-over-year growth 2023-2028 (%)
- Exhibits45: Chart on Lubricants and coolants - Market size and forecast 2023-2028 ($ million)
- Exhibits46: Data Table on Lubricants and coolants - Market size and forecast 2023-2028 ($ million)
- Exhibits47: Chart on Lubricants and coolants - Year-over-year growth 2023-2028 (%)
- Exhibits48: Data Table on Lubricants and coolants - Year-over-year growth 2023-2028 (%)
- Exhibits49: Chart on Conversion coatings - Market size and forecast 2023-2028 ($ million)
- Exhibits50: Data Table on Conversion coatings - Market size and forecast 2023-2028 ($ million)
- Exhibits51: Chart on Conversion coatings - Year-over-year growth 2023-2028 (%)
- Exhibits52: Data Table on Conversion coatings - Year-over-year growth 2023-2028 (%)
- Exhibits53: Chart on Rust and scale removers - Market size and forecast 2023-2028 ($ million)
- Exhibits54: Data Table on Rust and scale removers - Market size and forecast 2023-2028 ($ million)
- Exhibits55: Chart on Rust and scale removers - Year-over-year growth 2023-2028 (%)
- Exhibits56: Data Table on Rust and scale removers - Year-over-year growth 2023-2028 (%)
- Exhibits57: Chart on Others - Market size and forecast 2023-2028 ($ million)
- Exhibits58: Data Table on Others - Market size and forecast 2023-2028 ($ million)
- Exhibits59: Chart on Others - Year-over-year growth 2023-2028 (%)
- Exhibits60: Data Table on Others - Year-over-year growth 2023-2028 (%)
- Exhibits61: Market opportunity by Type ($ million)
- Exhibits62: Data Table on Market opportunity by Type ($ million)
- Exhibits63: Chart on Application - Market share 2023-2028 (%)
- Exhibits64: Data Table on Application - Market share 2023-2028 (%)
- Exhibits65: Chart on Comparison by Application
- Exhibits66: Data Table on Comparison by Application
- Exhibits67: Chart on Automotive - Market size and forecast 2023-2028 ($ million)
- Exhibits68: Data Table on Automotive - Market size and forecast 2023-2028 ($ million)
- Exhibits69: Chart on Automotive - Year-over-year growth 2023-2028 (%)
- Exhibits70: Data Table on Automotive - Year-over-year growth 2023-2028 (%)
- Exhibits71: Chart on Manufacturing - Market size and forecast 2023-2028 ($ million)
- Exhibits72: Data Table on Manufacturing - Market size and forecast 2023-2028 ($ million)
- Exhibits73: Chart on Manufacturing - Year-over-year growth 2023-2028 (%)
- Exhibits74: Data Table on Manufacturing - Year-over-year growth 2023-2028 (%)
- Exhibits75: Chart on Construction - Market size and forecast 2023-2028 ($ million)
- Exhibits76: Data Table on Construction - Market size and forecast 2023-2028 ($ million)
- Exhibits77: Chart on Construction - Year-over-year growth 2023-2028 (%)
- Exhibits78: Data Table on Construction - Year-over-year growth 2023-2028 (%)
- Exhibits79: Chart on Aerospace - Market size and forecast 2023-2028 ($ million)
- Exhibits80: Data Table on Aerospace - Market size and forecast 2023-2028 ($ million)
- Exhibits81: Chart on Aerospace - Year-over-year growth 2023-2028 (%)
- Exhibits82: Data Table on Aerospace - Year-over-year growth 2023-2028 (%)
- Exhibits83: Chart on Metalworking and Others - Market size and forecast 2023-2028 ($ million)
- Exhibits84: Data Table on Metalworking and Others - Market size and forecast 2023-2028 ($ million)
- Exhibits85: Chart on Metalworking and Others - Year-over-year growth 2023-2028 (%)
- Exhibits86: Data Table on Metalworking and Others - Year-over-year growth 2023-2028 (%)
- Exhibits87: Market opportunity by Application ($ million)
- Exhibits88: Data Table on Market opportunity by Application ($ million)
- Exhibits89: Analysis of price sensitivity, lifecycle, customer purchase basket, adoption rates, and purchase criteria
- Exhibits90: Chart on Market share by geography 2023-2028 (%)
- Exhibits91: Data Table on Market share by geography 2023-2028 (%)
- Exhibits92: Chart on Geographic comparison
- Exhibits93: Data Table on Geographic comparison
- Exhibits94: Chart on APAC - Market size and forecast 2023-2028 ($ million)
- Exhibits95: Data Table on APAC - Market size and forecast 2023-2028 ($ million)
- Exhibits96: Chart on APAC - Year-over-year growth 2023-2028 (%)
- Exhibits97: Data Table on APAC - Year-over-year growth 2023-2028 (%)
- Exhibits98: Chart on North America - Market size and forecast 2023-2028 ($ million)
- Exhibits99: Data Table on North America - Market size and forecast 2023-2028 ($ million)
- Exhibits100: Chart on North America - Year-over-year growth 2023-2028 (%)
- Exhibits101: Data Table on North America - Year-over-year growth 2023-2028 (%)
- Exhibits102: Chart on Europe - Market size and forecast 2023-2028 ($ million)
- Exhibits103: Data Table on Europe - Market size and forecast 2023-2028 ($ million)
- Exhibits104: Chart on Europe - Year-over-year growth 2023-2028 (%)
- Exhibits105: Data Table on Europe - Year-over-year growth 2023-2028 (%)
- Exhibits106: Chart on South America - Market size and forecast 2023-2028 ($ million)
- Exhibits107: Data Table on South America - Market size and forecast 2023-2028 ($ million)
- Exhibits108: Chart on South America - Year-over-year growth 2023-2028 (%)
- Exhibits109: Data Table on South America - Year-over-year growth 2023-2028 (%)
- Exhibits110: Chart on Middle East and Africa - Market size and forecast 2023-2028 ($ million)
- Exhibits111: Data Table on Middle East and Africa - Market size and forecast 2023-2028 ($ million)
- Exhibits112: Chart on Middle East and Africa - Year-over-year growth 2023-2028 (%)
- Exhibits113: Data Table on Middle East and Africa - Year-over-year growth 2023-2028 (%)
- Exhibits114: Chart on US - Market size and forecast 2023-2028 ($ million)
- Exhibits115: Data Table on US - Market size and forecast 2023-2028 ($ million)
- Exhibits116: Chart on US - Year-over-year growth 2023-2028 (%)
- Exhibits117: Data Table on US - Year-over-year growth 2023-2028 (%)
- Exhibits118: Chart on China - Market size and forecast 2023-2028 ($ million)
- Exhibits119: Data Table on China - Market size and forecast 2023-2028 ($ million)
- Exhibits120: Chart on China - Year-over-year growth 2023-2028 (%)
- Exhibits121: Data Table on China - Year-over-year growth 2023-2028 (%)
- Exhibits122: Chart on India - Market size and forecast 2023-2028 ($ million)
- Exhibits123: Data Table on India - Market size and forecast 2023-2028 ($ million)
- Exhibits124: Chart on India - Year-over-year growth 2023-2028 (%)
- Exhibits125: Data Table on India - Year-over-year growth 2023-2028 (%)
- Exhibits126: Chart on UK - Market size and forecast 2023-2028 ($ million)
- Exhibits127: Data Table on UK - Market size and forecast 2023-2028 ($ million)
- Exhibits128: Chart on UK - Year-over-year growth 2023-2028 (%)
- Exhibits129: Data Table on UK - Year-over-year growth 2023-2028 (%)
- Exhibits130: Chart on Mexico - Market size and forecast 2023-2028 ($ million)
- Exhibits131: Data Table on Mexico - Market size and forecast 2023-2028 ($ million)
- Exhibits132: Chart on Mexico - Year-over-year growth 2023-2028 (%)
- Exhibits133: Data Table on Mexico - Year-over-year growth 2023-2028 (%)
- Exhibits134: Chart on Germany - Market size and forecast 2023-2028 ($ million)
- Exhibits135: Data Table on Germany - Market size and forecast 2023-2028 ($ million)
- Exhibits136: Chart on Germany - Year-over-year growth 2023-2028 (%)
- Exhibits137: Data Table on Germany - Year-over-year growth 2023-2028 (%)
- Exhibits138: Market opportunity by geography ($ million)
- Exhibits139: Data Tables on Market opportunity by geography ($ million)
- Exhibits140: Impact of drivers and challenges in 2023 and 2028
- Exhibits141: Overview on criticality of inputs and factors of differentiation
- Exhibits142: Overview on factors of disruption
- Exhibits143: Impact of key risks on business
- Exhibits144: Companies covered
- Exhibits145: Company ranking index
- Exhibits146: Matrix on companies position and classification
- Exhibits147: AD International B.V. - Overview
- Exhibits148: AD International B.V. - Product / Service
- Exhibits149: AD International B.V. - Key offerings
- Exhibits150: SWOT
- Exhibits151: Algol Chemicals - Overview
- Exhibits152: Algol Chemicals - Product / Service
- Exhibits153: Algol Chemicals - Key offerings
- Exhibits154: SWOT
- Exhibits155: AL-SAIF CHEMICAL MANUFACTURING - Overview
- Exhibits156: AL-SAIF CHEMICAL MANUFACTURING - Product / Service
- Exhibits157: AL-SAIF CHEMICAL MANUFACTURING - Key offerings
- Exhibits158: SWOT
- Exhibits159: BASF SE - Overview
- Exhibits160: BASF SE - Business segments
- Exhibits161: BASF SE - Key news
- Exhibits162: BASF SE - Key offerings
- Exhibits163: BASF SE - Segment focus
- Exhibits164: SWOT
- Exhibits165: Chemetall GmbH - Overview
- Exhibits166: Chemetall GmbH - Product / Service
- Exhibits167: Chemetall GmbH - Key offerings
- Exhibits168: SWOT
- Exhibits169: Dimetrics Chemicals Pvt Ltd - Overview
- Exhibits170: Dimetrics Chemicals Pvt Ltd - Product / Service
- Exhibits171: Dimetrics Chemicals Pvt Ltd - Key offerings
- Exhibits172: SWOT
- Exhibits173: Diya Chemicals - Overview
- Exhibits174: Diya Chemicals - Product / Service
- Exhibits175: Diya Chemicals - Key offerings
- Exhibits176: SWOT
- Exhibits177: Dow Inc. - Overview
- Exhibits178: Dow Inc. - Business segments
- Exhibits179: Dow Inc. - Key news
- Exhibits180: Dow Inc. - Key offerings
- Exhibits181: Dow Inc. - Segment focus
- Exhibits182: SWOT
- Exhibits183: Eastman Chemical Co. - Overview
- Exhibits184: Eastman Chemical Co. - Business segments
- Exhibits185: Eastman Chemical Co. - Key news
- Exhibits186: Eastman Chemical Co. - Key offerings
- Exhibits187: Eastman Chemical Co. - Segment focus
- Exhibits188: SWOT
- Exhibits189: Evonik Industries AG - Overview
- Exhibits190: Evonik Industries AG - Business segments
- Exhibits191: Evonik Industries AG - Key news
- Exhibits192: Evonik Industries AG - Key offerings
- Exhibits193: Evonik Industries AG - Segment focus
- Exhibits194: SWOT
- Exhibits195: Nihon Parkerizing Co., Ltd. - Overview
- Exhibits196: Nihon Parkerizing Co., Ltd. - Business segments
- Exhibits197: Nihon Parkerizing Co., Ltd. - Key offerings
- Exhibits198: Nihon Parkerizing Co., Ltd. - Segment focus
- Exhibits199: SWOT
- Exhibits200: Sanko Shokai Co., Ltd. - Overview
- Exhibits201: Sanko Shokai Co., Ltd. - Product / Service
- Exhibits202: Sanko Shokai Co., Ltd. - Key offerings
- Exhibits203: SWOT
- Exhibits204: Shandong IRO Chelating Chemical Co. Ltd. - Overview
- Exhibits205: Shandong IRO Chelating Chemical Co. Ltd. - Product / Service
- Exhibits206: Shandong IRO Chelating Chemical Co. Ltd. - Key offerings
- Exhibits207: SWOT
- Exhibits208: Vanchem Performance Chemicals - Overview
- Exhibits209: Vanchem Performance Chemicals - Product / Service
- Exhibits210: Vanchem Performance Chemicals - Key offerings
- Exhibits211: SWOT
- Exhibits212: Wuhan Jadechem International Trade Co.,Ltd. - Overview
- Exhibits213: Wuhan Jadechem International Trade Co.,Ltd. - Product / Service
- Exhibits214: Wuhan Jadechem International Trade Co.,Ltd. - Key offerings
- Exhibits215: SWOT
- Exhibits216: Inclusions checklist
- Exhibits217: Exclusions checklist
- Exhibits218: Currency conversion rates for US$
- Exhibits219: Research methodology
- Exhibits220: Information sources
- Exhibits221: Data validation
- Exhibits222: Validation techniques employed for market sizing
- Exhibits223: Data synthesis
- Exhibits224: 360 degree market analysis
- Exhibits225: List of abbreviations
The metal treatment chemical market is forecasted to grow by USD 9994.8 mn during 2023-2028, accelerating at a CAGR of 5.49% during the forecast period. The report on the metal treatment chemical market provides a holistic analysis, market size and forecast, trends, growth drivers, and challenges, as well as vendor analysis covering around 25 vendors.
The report offers an up-to-date analysis regarding the current market scenario, the latest trends and drivers, and the overall market environment. The market is driven by increasing need for reliable machinery and its effective maintenance, growing global marine industry, and technological upgrades in machinery driving need for high-performance metal treatment chemicals.
Technavio's metal treatment chemical market is segmented as below:
| Market Scope | |
|---|---|
| Base Year | 2024 |
| End Year | 2028 |
| Series Year | 2024-2028 |
| Growth Momentum | Accelerate |
| YOY 2024 | 5.21% |
| CAGR | 5.49% |
| Incremental Value | $9994.8mn |
By Type
- Cleaners
- Lubricants and coolants
- Conversion coatings
- Rust and scale removers
- Others
By Application
- Automotive
- Manufacturing
- Construction
- Aerospace
- Metalworking and Others
By Geography
- APAC
- North America
- Europe
- South America
- Middle East and Africa
This study identifies the emergence of bio-based metal treatment chemicals as one of the prime reasons driving the metal treatment chemical market growth during the next few years. Also, increasing demand for water-based metal treatment chemicals and shift toward lightweight coatings will lead to sizable demand in the market.
The report on the metal treatment chemical market covers the following areas:
- Metal treatment chemical market sizing
- Metal treatment chemical market forecast
- Metal treatment chemical market industry analysis
The robust vendor analysis is designed to help clients improve their market position, and in line with this, this report provides a detailed analysis of several leading metal treatment chemical market vendors that include AD International B.V., Algol Chemicals, AL-SAIF CHEMICAL MANUFACTURING, Ashok Industry, BASF SE, Chemetall GmbH, Dimetrics Chemicals Pvt Ltd, Diya Chemicals, Dow Inc., Eastman Chemical Co., Evonik Industries AG, Mahavir Chemicals, Nihon Parkerizing Co., Ltd., Prime Chemicals, Salts and Chemicals Private Ltd., Sanko Shokai Co., Ltd., Shandong IRO Chelating Chemical Co. Ltd., Vanchem Performance Chemicals, and Wuhan Jadechem International Trade Co.,Ltd.. Also, the metal treatment chemical market analysis report includes information on upcoming trends and challenges that will influence market growth. This is to help companies strategize and leverage all forthcoming growth opportunities.
The study was conducted using an objective combination of primary and secondary information including inputs from key participants in the industry. The report contains a comprehensive market and vendor landscape in addition to an analysis of the key vendors.
The publisher presents a detailed picture of the market by the way of study, synthesis, and summation of data from multiple sources by an analysis of key parameters such as profit, pricing, competition, and promotions. It presents various market facets by identifying the key industry influencers. The data presented is comprehensive, reliable, and a result of extensive research - both primary and secondary. The market research reports provide a complete competitive landscape and an in-depth vendor selection methodology and analysis using qualitative and quantitative research to forecast the accurate market growth.
Table of Contents
1 Executive Summary
- 1.1 Market overview
- Executive Summary - Chart on Market Overview
- Executive Summary - Data Table on Market Overview
- Executive Summary - Chart on Global Market Characteristics
- Executive Summary - Chart on Market by Geography
- Executive Summary - Chart on Market Segmentation by Type
- Executive Summary - Chart on Market Segmentation by Application
- Executive Summary - Chart on Incremental Growth
- Executive Summary - Data Table on Incremental Growth
- Executive Summary - Chart on Company Market Positioning
2 Technavio Analysis
- 2.1 Analysis of price sensitivity, lifecycle, customer purchase basket, adoption rates, and purchase criteria
- Analysis of price sensitivity, lifecycle, customer purchase basket, adoption rates, and purchase criteria
- 2.2 Criticality of inputs and Factors of differentiation
- Overview on criticality of inputs and factors of differentiation
- 2.3 Factors of disruption
- Overview on factors of disruption
- 2.4 Impact of drivers and challenges
- Impact of drivers and challenges in 2023 and 2028
3 Market Landscape
- 3.1 Market ecosystem
- Parent Market
- Data Table on - Parent Market
- 3.2 Market characteristics
- Market characteristics analysis
- 3.3 Value chain analysis
- Value Chain Analysis
4 Market Sizing
- 4.1 Market definition
- Offerings of companies included in the market definition
- 4.2 Market segment analysis
- Market segments
- 4.3 Market size 2023
- 4.4 Market outlook: Forecast for 2023-2028
- Chart on Global - Market size and forecast 2023-2028 ($ million)
- Data Table on Global - Market size and forecast 2023-2028 ($ million)
- Chart on Global Market: Year-over-year growth 2023-2028 (%)
- Data Table on Global Market: Year-over-year growth 2023-2028 (%)
5 Historic Market Size
- 5.1 Global Metal Treatment Chemical Market 2018 - 2022
- Historic Market Size - Data Table on Global Metal Treatment Chemical Market 2018 - 2022 ($ million)
- 5.2 Type segment analysis 2018 - 2022
- Historic Market Size - Type Segment 2018 - 2022 ($ million)
- 5.3 Application segment analysis 2018 - 2022
- Historic Market Size - Application Segment 2018 - 2022 ($ million)
- 5.4 Geography segment analysis 2018 - 2022
- Historic Market Size - Geography Segment 2018 - 2022 ($ million)
- 5.5 Country segment analysis 2018 - 2022
- Historic Market Size - Country Segment 2018 - 2022 ($ million)
6 Additional Value/Volume Data
- 6.1 metal treatment chemical market by country 2023 - 2028 ($ million)
- Market Size (value) - Data Table on metal treatment chemical market by Country 2023 - 2028 ($ million)
7 Five Forces Analysis
- 7.1 Five forces summary
- Five forces analysis - Comparison between 2023 and 2028
- 7.2 Bargaining power of buyers
- Bargaining power of buyers - Impact of key factors 2023 and 2028
- 7.3 Bargaining power of suppliers
- Bargaining power of suppliers - Impact of key factors in 2023 and 2028
- 7.4 Threat of new entrants
- Threat of new entrants - Impact of key factors in 2023 and 2028
- 7.5 Threat of substitutes
- Threat of substitutes - Impact of key factors in 2023 and 2028
- 7.6 Threat of rivalry
- Threat of rivalry - Impact of key factors in 2023 and 2028
- 7.7 Market condition
- Chart on Market condition - Five forces 2023 and 2028
8 Market Segmentation by Type
- 8.1 Market segments
- Chart on Type - Market share 2023-2028 (%)
- Data Table on Type - Market share 2023-2028 (%)
- 8.2 Comparison by Type
- Chart on Comparison by Type
- Data Table on Comparison by Type
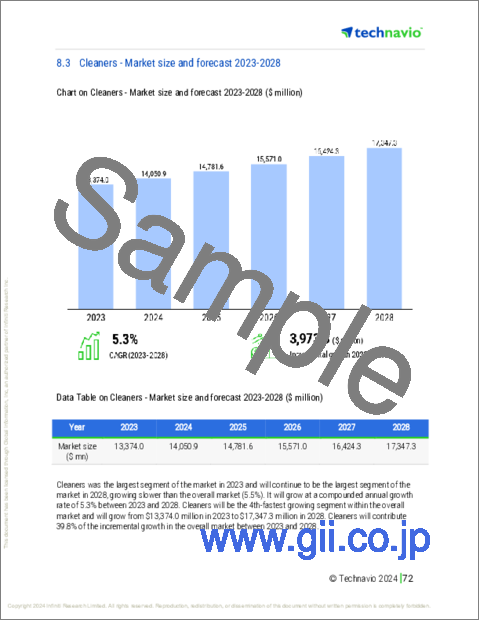
- 8.3 Cleaners - Market size and forecast 2023-2028
- Chart on Cleaners - Market size and forecast 2023-2028 ($ million)
- Data Table on Cleaners - Market size and forecast 2023-2028 ($ million)
- Chart on Cleaners - Year-over-year growth 2023-2028 (%)
- Data Table on Cleaners - Year-over-year growth 2023-2028 (%)
- 8.4 Lubricants and coolants - Market size and forecast 2023-2028
- Chart on Lubricants and coolants - Market size and forecast 2023-2028 ($ million)
- Data Table on Lubricants and coolants - Market size and forecast 2023-2028 ($ million)
- Chart on Lubricants and coolants - Year-over-year growth 2023-2028 (%)
- Data Table on Lubricants and coolants - Year-over-year growth 2023-2028 (%)
- 8.5 Conversion coatings - Market size and forecast 2023-2028
- Chart on Conversion coatings - Market size and forecast 2023-2028 ($ million)
- Data Table on Conversion coatings - Market size and forecast 2023-2028 ($ million)
- Chart on Conversion coatings - Year-over-year growth 2023-2028 (%)
- Data Table on Conversion coatings - Year-over-year growth 2023-2028 (%)
- 8.6 Rust and scale removers - Market size and forecast 2023-2028
- Chart on Rust and scale removers - Market size and forecast 2023-2028 ($ million)
- Data Table on Rust and scale removers - Market size and forecast 2023-2028 ($ million)
- Chart on Rust and scale removers - Year-over-year growth 2023-2028 (%)
- Data Table on Rust and scale removers - Year-over-year growth 2023-2028 (%)
- 8.7 Others - Market size and forecast 2023-2028
- Chart on Others - Market size and forecast 2023-2028 ($ million)
- Data Table on Others - Market size and forecast 2023-2028 ($ million)
- Chart on Others - Year-over-year growth 2023-2028 (%)
- Data Table on Others - Year-over-year growth 2023-2028 (%)
- 8.8 Market opportunity by Type
- Market opportunity by Type ($ million)
- Data Table on Market opportunity by Type ($ million)
9 Market Segmentation by Application
- 9.1 Market segments
- Chart on Application - Market share 2023-2028 (%)
- Data Table on Application - Market share 2023-2028 (%)
- 9.2 Comparison by Application
- Chart on Comparison by Application
- Data Table on Comparison by Application
- 9.3 Automotive - Market size and forecast 2023-2028
- Chart on Automotive - Market size and forecast 2023-2028 ($ million)
- Data Table on Automotive - Market size and forecast 2023-2028 ($ million)
- Chart on Automotive - Year-over-year growth 2023-2028 (%)
- Data Table on Automotive - Year-over-year growth 2023-2028 (%)
- 9.4 Manufacturing - Market size and forecast 2023-2028
- Chart on Manufacturing - Market size and forecast 2023-2028 ($ million)
- Data Table on Manufacturing - Market size and forecast 2023-2028 ($ million)
- Chart on Manufacturing - Year-over-year growth 2023-2028 (%)
- Data Table on Manufacturing - Year-over-year growth 2023-2028 (%)
- 9.5 Construction - Market size and forecast 2023-2028
- Chart on Construction - Market size and forecast 2023-2028 ($ million)
- Data Table on Construction - Market size and forecast 2023-2028 ($ million)
- Chart on Construction - Year-over-year growth 2023-2028 (%)
- Data Table on Construction - Year-over-year growth 2023-2028 (%)
- 9.6 Aerospace - Market size and forecast 2023-2028
- Chart on Aerospace - Market size and forecast 2023-2028 ($ million)
- Data Table on Aerospace - Market size and forecast 2023-2028 ($ million)
- Chart on Aerospace - Year-over-year growth 2023-2028 (%)
- Data Table on Aerospace - Year-over-year growth 2023-2028 (%)
- 9.7 Metalworking and Others - Market size and forecast 2023-2028
- Chart on Metalworking and Others - Market size and forecast 2023-2028 ($ million)
- Data Table on Metalworking and Others - Market size and forecast 2023-2028 ($ million)
- Chart on Metalworking and Others - Year-over-year growth 2023-2028 (%)
- Data Table on Metalworking and Others - Year-over-year growth 2023-2028 (%)
- 9.8 Market opportunity by Application
- Market opportunity by Application ($ million)
- Data Table on Market opportunity by Application ($ million)
10 Customer Landscape
- 10.1 Customer landscape overview
- Analysis of price sensitivity, lifecycle, customer purchase basket, adoption rates, and purchase criteria
11 Geographic Landscape
- 11.1 Geographic segmentation
- Chart on Market share by geography 2023-2028 (%)
- Data Table on Market share by geography 2023-2028 (%)
- 11.2 Geographic comparison
- Chart on Geographic comparison
- Data Table on Geographic comparison
- 11.3 APAC - Market size and forecast 2023-2028
- Chart on APAC - Market size and forecast 2023-2028 ($ million)
- Data Table on APAC - Market size and forecast 2023-2028 ($ million)
- Chart on APAC - Year-over-year growth 2023-2028 (%)
- Data Table on APAC - Year-over-year growth 2023-2028 (%)
- 11.4 North America - Market size and forecast 2023-2028
- Chart on North America - Market size and forecast 2023-2028 ($ million)
- Data Table on North America - Market size and forecast 2023-2028 ($ million)
- Chart on North America - Year-over-year growth 2023-2028 (%)
- Data Table on North America - Year-over-year growth 2023-2028 (%)
- 11.5 Europe - Market size and forecast 2023-2028
- Chart on Europe - Market size and forecast 2023-2028 ($ million)
- Data Table on Europe - Market size and forecast 2023-2028 ($ million)
- Chart on Europe - Year-over-year growth 2023-2028 (%)
- Data Table on Europe - Year-over-year growth 2023-2028 (%)
- 11.6 South America - Market size and forecast 2023-2028
- Chart on South America - Market size and forecast 2023-2028 ($ million)
- Data Table on South America - Market size and forecast 2023-2028 ($ million)
- Chart on South America - Year-over-year growth 2023-2028 (%)
- Data Table on South America - Year-over-year growth 2023-2028 (%)
- 11.7 Middle East and Africa - Market size and forecast 2023-2028
- Chart on Middle East and Africa - Market size and forecast 2023-2028 ($ million)
- Data Table on Middle East and Africa - Market size and forecast 2023-2028 ($ million)
- Chart on Middle East and Africa - Year-over-year growth 2023-2028 (%)
- Data Table on Middle East and Africa - Year-over-year growth 2023-2028 (%)
- 11.8 US - Market size and forecast 2023-2028
- Chart on US - Market size and forecast 2023-2028 ($ million)
- Data Table on US - Market size and forecast 2023-2028 ($ million)
- Chart on US - Year-over-year growth 2023-2028 (%)
- Data Table on US - Year-over-year growth 2023-2028 (%)
- 11.9 China - Market size and forecast 2023-2028
- Chart on China - Market size and forecast 2023-2028 ($ million)
- Data Table on China - Market size and forecast 2023-2028 ($ million)
- Chart on China - Year-over-year growth 2023-2028 (%)
- Data Table on China - Year-over-year growth 2023-2028 (%)
- 11.10 India - Market size and forecast 2023-2028
- Chart on India - Market size and forecast 2023-2028 ($ million)
- Data Table on India - Market size and forecast 2023-2028 ($ million)
- Chart on India - Year-over-year growth 2023-2028 (%)
- Data Table on India - Year-over-year growth 2023-2028 (%)
- 11.11 UK - Market size and forecast 2023-2028
- Chart on UK - Market size and forecast 2023-2028 ($ million)
- Data Table on UK - Market size and forecast 2023-2028 ($ million)
- Chart on UK - Year-over-year growth 2023-2028 (%)
- Data Table on UK - Year-over-year growth 2023-2028 (%)
- 11.12 Mexico - Market size and forecast 2023-2028
- Chart on Mexico - Market size and forecast 2023-2028 ($ million)
- Data Table on Mexico - Market size and forecast 2023-2028 ($ million)
- Chart on Mexico - Year-over-year growth 2023-2028 (%)
- Data Table on Mexico - Year-over-year growth 2023-2028 (%)
- 11.13 Germany - Market size and forecast 2023-2028
- Chart on Germany - Market size and forecast 2023-2028 ($ million)
- Data Table on Germany - Market size and forecast 2023-2028 ($ million)
- Chart on Germany - Year-over-year growth 2023-2028 (%)
- Data Table on Germany - Year-over-year growth 2023-2028 (%)
- 11.14 Market opportunity by geography
- Market opportunity by geography ($ million)
- Data Tables on Market opportunity by geography ($ million)
12 Drivers, Challenges, and Opportunity/Restraints
- 12.1 Market drivers
- 12.2 Market challenges
- 12.3 Impact of drivers and challenges
- Impact of drivers and challenges in 2023 and 2028
- 12.4 Market opportunities/restraints
13 Competitive Landscape
- 13.1 Overview
- 13.2 Competitive Landscape
- Overview on criticality of inputs and factors of differentiation
- 13.3 Landscape disruption
- Overview on factors of disruption
- 13.4 Industry risks
- Impact of key risks on business
14 Competitive Analysis
- 14.1 Companies profiled
- Companies covered
- 14.2 Company ranking index
- Company ranking index
- 14.3 Market positioning of companies
- Matrix on companies position and classification
- 14.4 AD International B.V.
- AD International B.V. - Overview
- AD International B.V. - Product / Service
- AD International B.V. - Key offerings
- SWOT
- 14.5 Algol Chemicals
- Algol Chemicals - Overview
- Algol Chemicals - Product / Service
- Algol Chemicals - Key offerings
- SWOT
- 14.6 AL-SAIF CHEMICAL MANUFACTURING
- AL-SAIF CHEMICAL MANUFACTURING - Overview
- AL-SAIF CHEMICAL MANUFACTURING - Product / Service
- AL-SAIF CHEMICAL MANUFACTURING - Key offerings
- SWOT
- 14.7 BASF SE
- BASF SE - Overview
- BASF SE - Business segments
- BASF SE - Key news
- BASF SE - Key offerings
- BASF SE - Segment focus
- SWOT
- 14.8 Chemetall GmbH
- Chemetall GmbH - Overview
- Chemetall GmbH - Product / Service
- Chemetall GmbH - Key offerings
- SWOT
- 14.9 Dimetrics Chemicals Pvt Ltd
- Dimetrics Chemicals Pvt Ltd - Overview
- Dimetrics Chemicals Pvt Ltd - Product / Service
- Dimetrics Chemicals Pvt Ltd - Key offerings
- SWOT
- 14.10 Diya Chemicals
- Diya Chemicals - Overview
- Diya Chemicals - Product / Service
- Diya Chemicals - Key offerings
- SWOT
- 14.11 Dow Inc.
- Dow Inc. - Overview
- Dow Inc. - Business segments
- Dow Inc. - Key news
- Dow Inc. - Key offerings
- Dow Inc. - Segment focus
- SWOT
- 14.12 Eastman Chemical Co.
- Eastman Chemical Co. - Overview
- Eastman Chemical Co. - Business segments
- Eastman Chemical Co. - Key news
- Eastman Chemical Co. - Key offerings
- Eastman Chemical Co. - Segment focus
- SWOT
- 14.13 Evonik Industries AG
- Evonik Industries AG - Overview
- Evonik Industries AG - Business segments
- Evonik Industries AG - Key news
- Evonik Industries AG - Key offerings
- Evonik Industries AG - Segment focus
- SWOT
- 14.14 Nihon Parkerizing Co., Ltd.
- Nihon Parkerizing Co., Ltd. - Overview
- Nihon Parkerizing Co., Ltd. - Business segments
- Nihon Parkerizing Co., Ltd. - Key offerings
- Nihon Parkerizing Co., Ltd. - Segment focus
- SWOT
- 14.15 Sanko Shokai Co., Ltd.
- Sanko Shokai Co., Ltd. - Overview
- Sanko Shokai Co., Ltd. - Product / Service
- Sanko Shokai Co., Ltd. - Key offerings
- SWOT
- 14.16 Shandong IRO Chelating Chemical Co. Ltd.
- Shandong IRO Chelating Chemical Co. Ltd. - Overview
- Shandong IRO Chelating Chemical Co. Ltd. - Product / Service
- Shandong IRO Chelating Chemical Co. Ltd. - Key offerings
- SWOT
- 14.17 Vanchem Performance Chemicals
- Vanchem Performance Chemicals - Overview
- Vanchem Performance Chemicals - Product / Service
- Vanchem Performance Chemicals - Key offerings
- SWOT
- 14.18 Wuhan Jadechem International Trade Co.,Ltd.
- Wuhan Jadechem International Trade Co.,Ltd. - Overview
- Wuhan Jadechem International Trade Co.,Ltd. - Product / Service
- Wuhan Jadechem International Trade Co.,Ltd. - Key offerings
- SWOT
15 Appendix
- 15.1 Scope of the report
- 15.2 Inclusions and exclusions checklist
- Inclusions checklist
- Exclusions checklist
- 15.3 Currency conversion rates for US$
- Currency conversion rates for US$
- 15.4 Research methodology
- Research methodology
- 15.5 Data procurement
- Information sources
- 15.6 Data validation
- Data validation
- 15.7 Validation techniques employed for market sizing
- Validation techniques employed for market sizing
- 15.8 Data synthesis
- Data synthesis
- 15.9 360 degree market analysis
- 360 degree market analysis
- 15.10 List of abbreviations
- List of abbreviations
