|
|
市場調査レポート
商品コード
1557701
木材包装の世界市場 2024-2028Global Wood Packaging Market 2024-2028 |
||||||
|
|||||||
カスタマイズ可能
|
|||||||

| 木材包装の世界市場 2024-2028 |
|
出版日: 2024年08月05日
発行: TechNavio
ページ情報: 英文 172 Pages
納期: 即納可能
|

全表示
- 概要
- 図表
- 目次
木材包装市場は2023-2028年に188億米ドル、予測期間中のCAGRは4.6%で成長すると予測されます。
当レポートでは、木材包装市場の全体的な分析、市場規模・予測、動向、成長促進要因、課題、約25のベンダーを網羅したベンダー分析などを掲載しています。
現在の市場シナリオ、最新動向と促進要因、市場環境全体に関する最新分析を提供しています。市場は、木材包装に関連するコストメリット、世界のコンテナ貨物貿易の増加、eコマース業界からの需要の高まりによって牽引されています。
| 市場範囲 | |
|---|---|
| 基準年 | 2024 |
| 終了年 | 2028 |
| 予測期間 | 2024-2028 |
| 成長モメンタム | 加速 |
| 前年比2024年 | 4.16% |
| CAGR | 4.6% |
| 増分額 | 188億米ドル |
本調査では、木製パレットの技術革新が今後数年間の木材包装市場成長を牽引する主要因の1つであるとしています。また、高度なIT技術の導入や、安全で衛生的なパレットへの需要の高まりも、市場の大きな需要につながると思われます。
目次
第1章 エグゼクティブサマリー
- 市場概要
第2章 市場情勢
- 市場エコシステム
- 市場の特徴
- バリューチェーン分析
第3章 市場規模の評価
- 市場の定義
- 市場セグメント分析
- 市場規模 2023
- 市場の見通し 2023-2028
第4章 市場規模実績
- 木材包装の世界市場 2018-2022
- 製品別セグメント分析 2018-2022
- 用途別セグメント分析 2018-2022
- 地域別セグメント分析 2018-2022
- 国別セグメント分析 2018-2022
第5章 ファイブフォース分析
- ファイブフォースの要約
- 買い手の交渉力
- 供給企業の交渉力
- 新規参入業者の脅威
- 代替品の脅威
- 競争の脅威
- 市況
第6章 市場セグメンテーション:製品別
- 市場セグメンテーション
- 比較:製品別
- パレット:市場規模と予測 2023-2028
- ケースと箱:市場規模と予測 2023-2028
- 市場機会:製品別
第7章 市場セグメンテーション:用途別
- 市場セグメンテーション
- 比較:用途別
- 飲食品の保管:市場規模と予測 2023-2028
- 交通機関:市場規模と予測 2023-2028
- 産業用:市場規模と予測 2023-2028
- 配送用:市場規模と予測 2023-2028
- その他:市場規模と予測 2023-2028
- 市場機会:用途別
第8章 顧客情勢
- 顧客情勢の概要
第9章 地域別情勢
- 地域別セグメンテーション
- 比較:地域別
- アジア太平洋:市場規模と予測 2023-2028
- 中東・アフリカ:市場規模と予測 2023-2028
- 南米:市場規模と予測 2023-2028
- 北米:市場規模と予測 2023-2028
- 欧州:市場規模と予測 2023-2028
- インド:市場規模と予測 2023-2028
- 中国:市場規模と予測 2023-2028
- 日本:市場規模と予測 2023-2028
- イラン:市場規模と予測 2023-2028
- ブラジル:市場規模と予測 2023-2028
- 市場機会:地域別
第10章 促進要因・課題・機会・抑制要因
- 市場促進要因
- 市場の課題
- 促進要因と課題の影響
- 市場の機会・抑制要因
第11章 競合情勢
- 概要
- 競合情勢
- 混乱の状況
- 業界のリスク
第12章 競合分析
- 企業プロファイル
- 企業の市場ポジショニング
- Brambles Ltd.
- C and K Box Co. Inc.
- Coxco Inc.
- Falkenhahn AG
- Greif Inc.
- InterAgra SC
- Kamps Inc.
- Millwood Inc.
- Mondi Plc
- NEFAB GROUP
- Pacific Pallet Ltd.
- Palcon LLC
- Rowlinson Group Ltd.
- Shur-way Group Inc.
- UFP Industries Inc.
第13章 付録
Exhibits:
- Exhibits1: Executive Summary - Chart on Market Overview
- Exhibits2: Executive Summary - Data Table on Market Overview
- Exhibits3: Executive Summary - Chart on Global Market Characteristics
- Exhibits4: Executive Summary - Chart on Market by Geography
- Exhibits5: Executive Summary - Chart on Market Segmentation by Product
- Exhibits6: Executive Summary - Chart on Market Segmentation by Application
- Exhibits7: Executive Summary - Chart on Incremental Growth
- Exhibits8: Executive Summary - Data Table on Incremental Growth
- Exhibits9: Executive Summary - Chart on Company Market Positioning
- Exhibits10: Parent Market
- Exhibits11: Data Table on - Parent Market
- Exhibits12: Market characteristics analysis
- Exhibits13: Value Chain Analysis
- Exhibits14: Offerings of companies included in the market definition
- Exhibits15: Market segments
- Exhibits16: Chart on Global - Market size and forecast 2023-2028 ($ billion)
- Exhibits17: Data Table on Global - Market size and forecast 2023-2028 ($ billion)
- Exhibits18: Chart on Global Market: Year-over-year growth 2023-2028 (%)
- Exhibits19: Data Table on Global Market: Year-over-year growth 2023-2028 (%)
- Exhibits20: Historic Market Size - Data Table on Global Wood Packaging Market 2018 - 2022 ($ billion)
- Exhibits21: Historic Market Size - Product Segment 2018 - 2022 ($ billion)
- Exhibits22: Historic Market Size - Application Segment 2018 - 2022 ($ billion)
- Exhibits23: Historic Market Size - Geography Segment 2018 - 2022 ($ billion)
- Exhibits24: Historic Market Size - Country Segment 2018 - 2022 ($ billion)
- Exhibits25: Five forces analysis - Comparison between 2023 and 2028
- Exhibits26: Bargaining power of buyers - Impact of key factors 2023 and 2028
- Exhibits27: Bargaining power of suppliers - Impact of key factors in 2023 and 2028
- Exhibits28: Threat of new entrants - Impact of key factors in 2023 and 2028
- Exhibits29: Threat of substitutes - Impact of key factors in 2023 and 2028
- Exhibits30: Threat of rivalry - Impact of key factors in 2023 and 2028
- Exhibits31: Chart on Market condition - Five forces 2023 and 2028
- Exhibits32: Chart on Product - Market share 2023-2028 (%)
- Exhibits33: Data Table on Product - Market share 2023-2028 (%)
- Exhibits34: Chart on Comparison by Product
- Exhibits35: Data Table on Comparison by Product
- Exhibits36: Chart on Pallets - Market size and forecast 2023-2028 ($ billion)
- Exhibits37: Data Table on Pallets - Market size and forecast 2023-2028 ($ billion)
- Exhibits38: Chart on Pallets - Year-over-year growth 2023-2028 (%)
- Exhibits39: Data Table on Pallets - Year-over-year growth 2023-2028 (%)
- Exhibits40: Chart on Cases and boxes - Market size and forecast 2023-2028 ($ billion)
- Exhibits41: Data Table on Cases and boxes - Market size and forecast 2023-2028 ($ billion)
- Exhibits42: Chart on Cases and boxes - Year-over-year growth 2023-2028 (%)
- Exhibits43: Data Table on Cases and boxes - Year-over-year growth 2023-2028 (%)
- Exhibits44: Market opportunity by Product ($ billion)
- Exhibits45: Data Table on Market opportunity by Product ($ billion)
- Exhibits46: Chart on Application - Market share 2023-2028 (%)
- Exhibits47: Data Table on Application - Market share 2023-2028 (%)
- Exhibits48: Chart on Comparison by Application
- Exhibits49: Data Table on Comparison by Application
- Exhibits50: Chart on Food and beverages storage - Market size and forecast 2023-2028 ($ billion)
- Exhibits51: Data Table on Food and beverages storage - Market size and forecast 2023-2028 ($ billion)
- Exhibits52: Chart on Food and beverages storage - Year-over-year growth 2023-2028 (%)
- Exhibits53: Data Table on Food and beverages storage - Year-over-year growth 2023-2028 (%)
- Exhibits54: Chart on Transportation - Market size and forecast 2023-2028 ($ billion)
- Exhibits55: Data Table on Transportation - Market size and forecast 2023-2028 ($ billion)
- Exhibits56: Chart on Transportation - Year-over-year growth 2023-2028 (%)
- Exhibits57: Data Table on Transportation - Year-over-year growth 2023-2028 (%)
- Exhibits58: Chart on Industrial - Market size and forecast 2023-2028 ($ billion)
- Exhibits59: Data Table on Industrial - Market size and forecast 2023-2028 ($ billion)
- Exhibits60: Chart on Industrial - Year-over-year growth 2023-2028 (%)
- Exhibits61: Data Table on Industrial - Year-over-year growth 2023-2028 (%)
- Exhibits62: Chart on Shipping - Market size and forecast 2023-2028 ($ billion)
- Exhibits63: Data Table on Shipping - Market size and forecast 2023-2028 ($ billion)
- Exhibits64: Chart on Shipping - Year-over-year growth 2023-2028 (%)
- Exhibits65: Data Table on Shipping - Year-over-year growth 2023-2028 (%)
- Exhibits66: Chart on Others - Market size and forecast 2023-2028 ($ billion)
- Exhibits67: Data Table on Others - Market size and forecast 2023-2028 ($ billion)
- Exhibits68: Chart on Others - Year-over-year growth 2023-2028 (%)
- Exhibits69: Data Table on Others - Year-over-year growth 2023-2028 (%)
- Exhibits70: Market opportunity by Application ($ billion)
- Exhibits71: Data Table on Market opportunity by Application ($ billion)
- Exhibits72: Analysis of price sensitivity, lifecycle, customer purchase basket, adoption rates, and purchase criteria
- Exhibits73: Chart on Market share by geography 2023-2028 (%)
- Exhibits74: Data Table on Market share by geography 2023-2028 (%)
- Exhibits75: Chart on Geographic comparison
- Exhibits76: Data Table on Geographic comparison
- Exhibits77: Chart on APAC - Market size and forecast 2023-2028 ($ billion)
- Exhibits78: Data Table on APAC - Market size and forecast 2023-2028 ($ billion)
- Exhibits79: Chart on APAC - Year-over-year growth 2023-2028 (%)
- Exhibits80: Data Table on APAC - Year-over-year growth 2023-2028 (%)
- Exhibits81: Chart on Middle East and Africa - Market size and forecast 2023-2028 ($ billion)
- Exhibits82: Data Table on Middle East and Africa - Market size and forecast 2023-2028 ($ billion)
- Exhibits83: Chart on Middle East and Africa - Year-over-year growth 2023-2028 (%)
- Exhibits84: Data Table on Middle East and Africa - Year-over-year growth 2023-2028 (%)
- Exhibits85: Chart on South America - Market size and forecast 2023-2028 ($ billion)
- Exhibits86: Data Table on South America - Market size and forecast 2023-2028 ($ billion)
- Exhibits87: Chart on South America - Year-over-year growth 2023-2028 (%)
- Exhibits88: Data Table on South America - Year-over-year growth 2023-2028 (%)
- Exhibits89: Chart on North America - Market size and forecast 2023-2028 ($ billion)
- Exhibits90: Data Table on North America - Market size and forecast 2023-2028 ($ billion)
- Exhibits91: Chart on North America - Year-over-year growth 2023-2028 (%)
- Exhibits92: Data Table on North America - Year-over-year growth 2023-2028 (%)
- Exhibits93: Chart on Europe - Market size and forecast 2023-2028 ($ billion)
- Exhibits94: Data Table on Europe - Market size and forecast 2023-2028 ($ billion)
- Exhibits95: Chart on Europe - Year-over-year growth 2023-2028 (%)
- Exhibits96: Data Table on Europe - Year-over-year growth 2023-2028 (%)
- Exhibits97: Chart on India - Market size and forecast 2023-2028 ($ billion)
- Exhibits98: Data Table on India - Market size and forecast 2023-2028 ($ billion)
- Exhibits99: Chart on India - Year-over-year growth 2023-2028 (%)
- Exhibits100: Data Table on India - Year-over-year growth 2023-2028 (%)
- Exhibits101: Chart on China - Market size and forecast 2023-2028 ($ billion)
- Exhibits102: Data Table on China - Market size and forecast 2023-2028 ($ billion)
- Exhibits103: Chart on China - Year-over-year growth 2023-2028 (%)
- Exhibits104: Data Table on China - Year-over-year growth 2023-2028 (%)
- Exhibits105: Chart on Japan - Market size and forecast 2023-2028 ($ billion)
- Exhibits106: Data Table on Japan - Market size and forecast 2023-2028 ($ billion)
- Exhibits107: Chart on Japan - Year-over-year growth 2023-2028 (%)
- Exhibits108: Data Table on Japan - Year-over-year growth 2023-2028 (%)
- Exhibits109: Chart on Iran - Market size and forecast 2023-2028 ($ billion)
- Exhibits110: Data Table on Iran - Market size and forecast 2023-2028 ($ billion)
- Exhibits111: Chart on Iran - Year-over-year growth 2023-2028 (%)
- Exhibits112: Data Table on Iran - Year-over-year growth 2023-2028 (%)
- Exhibits113: Chart on Brazil - Market size and forecast 2023-2028 ($ billion)
- Exhibits114: Data Table on Brazil - Market size and forecast 2023-2028 ($ billion)
- Exhibits115: Chart on Brazil - Year-over-year growth 2023-2028 (%)
- Exhibits116: Data Table on Brazil - Year-over-year growth 2023-2028 (%)
- Exhibits117: Market opportunity by geography ($ billion)
- Exhibits118: Data Tables on Market opportunity by geography ($ billion)
- Exhibits119: Impact of drivers and challenges in 2023 and 2028
- Exhibits120: Overview on criticality of inputs and factors of differentiation
- Exhibits121: Overview on factors of disruption
- Exhibits122: Impact of key risks on business
- Exhibits123: Companies covered
- Exhibits124: Matrix on companies position and classification
- Exhibits125: Brambles Ltd. - Overview
- Exhibits126: Brambles Ltd. - Business segments
- Exhibits127: Brambles Ltd. - Key news
- Exhibits128: Brambles Ltd. - Key offerings
- Exhibits129: Brambles Ltd. - Segment focus
- Exhibits130: C and K Box Co. Inc. - Overview
- Exhibits131: C and K Box Co. Inc. - Product / Service
- Exhibits132: C and K Box Co. Inc. - Key offerings
- Exhibits133: Coxco Inc. - Overview
- Exhibits134: Coxco Inc. - Product / Service
- Exhibits135: Coxco Inc. - Key offerings
- Exhibits136: Falkenhahn AG - Overview
- Exhibits137: Falkenhahn AG - Product / Service
- Exhibits138: Falkenhahn AG - Key offerings
- Exhibits139: Greif Inc. - Overview
- Exhibits140: Greif Inc. - Business segments
- Exhibits141: Greif Inc. - Key news
- Exhibits142: Greif Inc. - Key offerings
- Exhibits143: Greif Inc. - Segment focus
- Exhibits144: InterAgra SC - Overview
- Exhibits145: InterAgra SC - Product / Service
- Exhibits146: InterAgra SC - Key offerings
- Exhibits147: Kamps Inc. - Overview
- Exhibits148: Kamps Inc. - Product / Service
- Exhibits149: Kamps Inc. - Key offerings
- Exhibits150: Millwood Inc. - Overview
- Exhibits151: Millwood Inc. - Product / Service
- Exhibits152: Millwood Inc. - Key offerings
- Exhibits153: Mondi Plc - Overview
- Exhibits154: Mondi Plc - Business segments
- Exhibits155: Mondi Plc - Key news
- Exhibits156: Mondi Plc - Key offerings
- Exhibits157: Mondi Plc - Segment focus
- Exhibits158: NEFAB GROUP - Overview
- Exhibits159: NEFAB GROUP - Product / Service
- Exhibits160: NEFAB GROUP - Key offerings
- Exhibits161: Pacific Pallet Ltd. - Overview
- Exhibits162: Pacific Pallet Ltd. - Product / Service
- Exhibits163: Pacific Pallet Ltd. - Key offerings
- Exhibits164: Palcon LLC - Overview
- Exhibits165: Palcon LLC - Product / Service
- Exhibits166: Palcon LLC - Key offerings
- Exhibits167: Rowlinson Group Ltd. - Overview
- Exhibits168: Rowlinson Group Ltd. - Product / Service
- Exhibits169: Rowlinson Group Ltd. - Key offerings
- Exhibits170: Shur-way Group Inc. - Overview
- Exhibits171: Shur-way Group Inc. - Product / Service
- Exhibits172: Shur-way Group Inc. - Key offerings
- Exhibits173: UFP Industries Inc. - Overview
- Exhibits174: UFP Industries Inc. - Business segments
- Exhibits175: UFP Industries Inc. - Key offerings
- Exhibits176: UFP Industries Inc. - Segment focus
- Exhibits177: Inclusions checklist
- Exhibits178: Exclusions checklist
- Exhibits179: Currency conversion rates for US$
- Exhibits180: Research methodology
- Exhibits181: Information sources
- Exhibits182: Data validation
- Exhibits183: Validation techniques employed for market sizing
- Exhibits184: Data synthesis
- Exhibits185: 360 degree market analysis
- Exhibits186: List of abbreviations
The wood packaging market is forecasted to grow by USD 18.8 bn during 2023-2028, accelerating at a CAGR of 4.6% during the forecast period. The report on the wood packaging market provides a holistic analysis, market size and forecast, trends, growth drivers, and challenges, as well as vendor analysis covering around 25 vendors.
The report offers an up-to-date analysis regarding the current market scenario, the latest trends and drivers, and the overall market environment. The market is driven by cost benefits associated with wood packaging, rise in global containerized cargo trade, and rising demand from e-commerce industry.
Technavio's wood packaging market is segmented as below:
| Market Scope | |
|---|---|
| Base Year | 2024 |
| End Year | 2028 |
| Series Year | 2024-2028 |
| Growth Momentum | Accelerate |
| YOY 2024 | 4.16% |
| CAGR | 4.6% |
| Incremental Value | $18.8bn |
By Product
- Pallets
- Cases and boxes
By Application
- Food and beverages storage
- Transportation
- Industrial
- Shipping
- Others
By Geography
- APAC
- Middle East and Africa
- South America
- North America
- Europe
This study identifies the growing innovation in wooden pallets as one of the prime reasons driving the wood packaging market growth during the next few years. Also, implementation of advanced IT-enabled technology and increased demand for safe and hygienic pallets will lead to sizable demand in the market.
The report on the wood packaging market covers the following areas:
- Wood packaging market sizing
- Wood packaging market forecast
- Wood packaging market industry analysis
The robust vendor analysis is designed to help clients improve their market position, and in line with this, this report provides a detailed analysis of several leading wood packaging market vendors that include Arrington Lumber and Pallet Co., Brambles Ltd., C and K Box Co. Inc., Coxco Inc., Falkenhahn AG, Greif Inc., InterAgra SC, Kamps Inc., Millwood Inc., Mondi PLC, NEFAB GROUP, Ongna Wood Products, Pacific Pallet Ltd., Palcon LLC, Rowlinson Group Ltd., Shur-way Group Inc., Stora Enso Oyj, Totre Industries, UFP Industries Inc., and United Pallet Services Inc.. Also, the wood packaging market analysis report includes information on upcoming trends and challenges that will influence market growth. This is to help companies strategize and leverage all forthcoming growth opportunities.
The study was conducted using an objective combination of primary and secondary information including inputs from key participants in the industry. The report contains a comprehensive market and vendor landscape in addition to an analysis of the key vendors.
The publisher presents a detailed picture of the market by the way of study, synthesis, and summation of data from multiple sources by an analysis of key parameters such as profit, pricing, competition, and promotions. It presents various market facets by identifying the key industry influencers. The data presented is comprehensive, reliable, and a result of extensive research - both primary and secondary. The market research reports provide a complete competitive landscape and an in-depth vendor selection methodology and analysis using qualitative and quantitative research to forecast the accurate market growth.
Table of Contents
1 Executive Summary
- 1.1 Market overview
- Executive Summary - Chart on Market Overview
- Executive Summary - Data Table on Market Overview
- Executive Summary - Chart on Global Market Characteristics
- Executive Summary - Chart on Market by Geography
- Executive Summary - Chart on Market Segmentation by Product
- Executive Summary - Chart on Market Segmentation by Application
- Executive Summary - Chart on Incremental Growth
- Executive Summary - Data Table on Incremental Growth
- Executive Summary - Chart on Company Market Positioning
2 Market Landscape
- 2.1 Market ecosystem
- Parent Market
- Data Table on - Parent Market
- 2.2 Market characteristics
- Market characteristics analysis
- 2.3 Value chain analysis
- Value Chain Analysis
3 Market Sizing
- 3.1 Market definition
- Offerings of companies included in the market definition
- 3.2 Market segment analysis
- Market segments
- 3.3 Market size 2023
- 3.4 Market outlook: Forecast for 2023-2028
- Chart on Global - Market size and forecast 2023-2028 ($ billion)
- Data Table on Global - Market size and forecast 2023-2028 ($ billion)
- Chart on Global Market: Year-over-year growth 2023-2028 (%)
- Data Table on Global Market: Year-over-year growth 2023-2028 (%)
4 Historic Market Size
- 4.1 Global Wood Packaging Market 2018 - 2022
- Historic Market Size - Data Table on Global Wood Packaging Market 2018 - 2022 ($ billion)
- 4.2 Product segment analysis 2018 - 2022
- Historic Market Size - Product Segment 2018 - 2022 ($ billion)
- 4.3 Application segment analysis 2018 - 2022
- Historic Market Size - Application Segment 2018 - 2022 ($ billion)
- 4.4 Geography segment analysis 2018 - 2022
- Historic Market Size - Geography Segment 2018 - 2022 ($ billion)
- 4.5 Country segment analysis 2018 - 2022
- Historic Market Size - Country Segment 2018 - 2022 ($ billion)
5 Five Forces Analysis
- 5.1 Five forces summary
- Five forces analysis - Comparison between 2023 and 2028
- 5.2 Bargaining power of buyers
- Bargaining power of buyers - Impact of key factors 2023 and 2028
- 5.3 Bargaining power of suppliers
- Bargaining power of suppliers - Impact of key factors in 2023 and 2028
- 5.4 Threat of new entrants
- Threat of new entrants - Impact of key factors in 2023 and 2028
- 5.5 Threat of substitutes
- Threat of substitutes - Impact of key factors in 2023 and 2028
- 5.6 Threat of rivalry
- Threat of rivalry - Impact of key factors in 2023 and 2028
- 5.7 Market condition
- Chart on Market condition - Five forces 2023 and 2028
6 Market Segmentation by Product
- 6.1 Market segments
- Chart on Product - Market share 2023-2028 (%)
- Data Table on Product - Market share 2023-2028 (%)
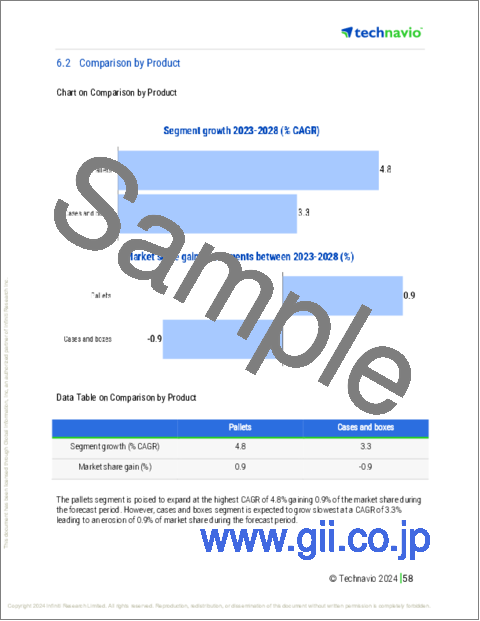
- 6.2 Comparison by Product
- Chart on Comparison by Product
- Data Table on Comparison by Product
- 6.3 Pallets - Market size and forecast 2023-2028
- Chart on Pallets - Market size and forecast 2023-2028 ($ billion)
- Data Table on Pallets - Market size and forecast 2023-2028 ($ billion)
- Chart on Pallets - Year-over-year growth 2023-2028 (%)
- Data Table on Pallets - Year-over-year growth 2023-2028 (%)
- 6.4 Cases and boxes - Market size and forecast 2023-2028
- Chart on Cases and boxes - Market size and forecast 2023-2028 ($ billion)
- Data Table on Cases and boxes - Market size and forecast 2023-2028 ($ billion)
- Chart on Cases and boxes - Year-over-year growth 2023-2028 (%)
- Data Table on Cases and boxes - Year-over-year growth 2023-2028 (%)
- 6.5 Market opportunity by Product
- Market opportunity by Product ($ billion)
- Data Table on Market opportunity by Product ($ billion)
7 Market Segmentation by Application
- 7.1 Market segments
- Chart on Application - Market share 2023-2028 (%)
- Data Table on Application - Market share 2023-2028 (%)
- 7.2 Comparison by Application
- Chart on Comparison by Application
- Data Table on Comparison by Application
- 7.3 Food and beverages storage - Market size and forecast 2023-2028
- Chart on Food and beverages storage - Market size and forecast 2023-2028 ($ billion)
- Data Table on Food and beverages storage - Market size and forecast 2023-2028 ($ billion)
- Chart on Food and beverages storage - Year-over-year growth 2023-2028 (%)
- Data Table on Food and beverages storage - Year-over-year growth 2023-2028 (%)
- 7.4 Transportation - Market size and forecast 2023-2028
- Chart on Transportation - Market size and forecast 2023-2028 ($ billion)
- Data Table on Transportation - Market size and forecast 2023-2028 ($ billion)
- Chart on Transportation - Year-over-year growth 2023-2028 (%)
- Data Table on Transportation - Year-over-year growth 2023-2028 (%)
- 7.5 Industrial - Market size and forecast 2023-2028
- Chart on Industrial - Market size and forecast 2023-2028 ($ billion)
- Data Table on Industrial - Market size and forecast 2023-2028 ($ billion)
- Chart on Industrial - Year-over-year growth 2023-2028 (%)
- Data Table on Industrial - Year-over-year growth 2023-2028 (%)
- 7.6 Shipping - Market size and forecast 2023-2028
- Chart on Shipping - Market size and forecast 2023-2028 ($ billion)
- Data Table on Shipping - Market size and forecast 2023-2028 ($ billion)
- Chart on Shipping - Year-over-year growth 2023-2028 (%)
- Data Table on Shipping - Year-over-year growth 2023-2028 (%)
- 7.7 Others - Market size and forecast 2023-2028
- Chart on Others - Market size and forecast 2023-2028 ($ billion)
- Data Table on Others - Market size and forecast 2023-2028 ($ billion)
- Chart on Others - Year-over-year growth 2023-2028 (%)
- Data Table on Others - Year-over-year growth 2023-2028 (%)
- 7.8 Market opportunity by Application
- Market opportunity by Application ($ billion)
- Data Table on Market opportunity by Application ($ billion)
8 Customer Landscape
- 8.1 Customer landscape overview
- Analysis of price sensitivity, lifecycle, customer purchase basket, adoption rates, and purchase criteria
9 Geographic Landscape
- 9.1 Geographic segmentation
- Chart on Market share by geography 2023-2028 (%)
- Data Table on Market share by geography 2023-2028 (%)
- 9.2 Geographic comparison
- Chart on Geographic comparison
- Data Table on Geographic comparison
- 9.3 APAC - Market size and forecast 2023-2028
- Chart on APAC - Market size and forecast 2023-2028 ($ billion)
- Data Table on APAC - Market size and forecast 2023-2028 ($ billion)
- Chart on APAC - Year-over-year growth 2023-2028 (%)
- Data Table on APAC - Year-over-year growth 2023-2028 (%)
- 9.4 Middle East and Africa - Market size and forecast 2023-2028
- Chart on Middle East and Africa - Market size and forecast 2023-2028 ($ billion)
- Data Table on Middle East and Africa - Market size and forecast 2023-2028 ($ billion)
- Chart on Middle East and Africa - Year-over-year growth 2023-2028 (%)
- Data Table on Middle East and Africa - Year-over-year growth 2023-2028 (%)
- 9.5 South America - Market size and forecast 2023-2028
- Chart on South America - Market size and forecast 2023-2028 ($ billion)
- Data Table on South America - Market size and forecast 2023-2028 ($ billion)
- Chart on South America - Year-over-year growth 2023-2028 (%)
- Data Table on South America - Year-over-year growth 2023-2028 (%)
- 9.6 North America - Market size and forecast 2023-2028
- Chart on North America - Market size and forecast 2023-2028 ($ billion)
- Data Table on North America - Market size and forecast 2023-2028 ($ billion)
- Chart on North America - Year-over-year growth 2023-2028 (%)
- Data Table on North America - Year-over-year growth 2023-2028 (%)
- 9.7 Europe - Market size and forecast 2023-2028
- Chart on Europe - Market size and forecast 2023-2028 ($ billion)
- Data Table on Europe - Market size and forecast 2023-2028 ($ billion)
- Chart on Europe - Year-over-year growth 2023-2028 (%)
- Data Table on Europe - Year-over-year growth 2023-2028 (%)
- 9.8 India - Market size and forecast 2023-2028
- Chart on India - Market size and forecast 2023-2028 ($ billion)
- Data Table on India - Market size and forecast 2023-2028 ($ billion)
- Chart on India - Year-over-year growth 2023-2028 (%)
- Data Table on India - Year-over-year growth 2023-2028 (%)
- 9.9 China - Market size and forecast 2023-2028
- Chart on China - Market size and forecast 2023-2028 ($ billion)
- Data Table on China - Market size and forecast 2023-2028 ($ billion)
- Chart on China - Year-over-year growth 2023-2028 (%)
- Data Table on China - Year-over-year growth 2023-2028 (%)
- 9.10 Japan - Market size and forecast 2023-2028
- Chart on Japan - Market size and forecast 2023-2028 ($ billion)
- Data Table on Japan - Market size and forecast 2023-2028 ($ billion)
- Chart on Japan - Year-over-year growth 2023-2028 (%)
- Data Table on Japan - Year-over-year growth 2023-2028 (%)
- 9.11 Iran - Market size and forecast 2023-2028
- Chart on Iran - Market size and forecast 2023-2028 ($ billion)
- Data Table on Iran - Market size and forecast 2023-2028 ($ billion)
- Chart on Iran - Year-over-year growth 2023-2028 (%)
- Data Table on Iran - Year-over-year growth 2023-2028 (%)
- 9.12 Brazil - Market size and forecast 2023-2028
- Chart on Brazil - Market size and forecast 2023-2028 ($ billion)
- Data Table on Brazil - Market size and forecast 2023-2028 ($ billion)
- Chart on Brazil - Year-over-year growth 2023-2028 (%)
- Data Table on Brazil - Year-over-year growth 2023-2028 (%)
- 9.13 Market opportunity by geography
- Market opportunity by geography ($ billion)
- Data Tables on Market opportunity by geography ($ billion)
10 Drivers, Challenges, and Opportunity/Restraints
- 10.1 Market drivers
- 10.2 Market challenges
- 10.3 Impact of drivers and challenges
- Impact of drivers and challenges in 2023 and 2028
- 10.4 Market opportunities/restraints
11 Competitive Landscape
- 11.1 Overview
- 11.2 Competitive Landscape
- Overview on criticality of inputs and factors of differentiation
- 11.3 Landscape disruption
- Overview on factors of disruption
- 11.4 Industry risks
- Impact of key risks on business
12 Competitive Analysis
- 12.1 Companies profiled
- Companies covered
- 12.2 Market positioning of companies
- Matrix on companies position and classification
- 12.3 Brambles Ltd.
- Brambles Ltd. - Overview
- Brambles Ltd. - Business segments
- Brambles Ltd. - Key news
- Brambles Ltd. - Key offerings
- Brambles Ltd. - Segment focus
- 12.4 C and K Box Co. Inc.
- C and K Box Co. Inc. - Overview
- C and K Box Co. Inc. - Product / Service
- C and K Box Co. Inc. - Key offerings
- 12.5 Coxco Inc.
- Coxco Inc. - Overview
- Coxco Inc. - Product / Service
- Coxco Inc. - Key offerings
- 12.6 Falkenhahn AG
- Falkenhahn AG - Overview
- Falkenhahn AG - Product / Service
- Falkenhahn AG - Key offerings
- 12.7 Greif Inc.
- Greif Inc. - Overview
- Greif Inc. - Business segments
- Greif Inc. - Key news
- Greif Inc. - Key offerings
- Greif Inc. - Segment focus
- 12.8 InterAgra SC
- InterAgra SC - Overview
- InterAgra SC - Product / Service
- InterAgra SC - Key offerings
- 12.9 Kamps Inc.
- Kamps Inc. - Overview
- Kamps Inc. - Product / Service
- Kamps Inc. - Key offerings
- 12.10 Millwood Inc.
- Millwood Inc. - Overview
- Millwood Inc. - Product / Service
- Millwood Inc. - Key offerings
- 12.11 Mondi Plc
- Mondi Plc - Overview
- Mondi Plc - Business segments
- Mondi Plc - Key news
- Mondi Plc - Key offerings
- Mondi Plc - Segment focus
- 12.12 NEFAB GROUP
- NEFAB GROUP - Overview
- NEFAB GROUP - Product / Service
- NEFAB GROUP - Key offerings
- 12.13 Pacific Pallet Ltd.
- Pacific Pallet Ltd. - Overview
- Pacific Pallet Ltd. - Product / Service
- Pacific Pallet Ltd. - Key offerings
- 12.14 Palcon LLC
- Palcon LLC - Overview
- Palcon LLC - Product / Service
- Palcon LLC - Key offerings
- 12.15 Rowlinson Group Ltd.
- Rowlinson Group Ltd. - Overview
- Rowlinson Group Ltd. - Product / Service
- Rowlinson Group Ltd. - Key offerings
- 12.16 Shur-way Group Inc.
- Shur-way Group Inc. - Overview
- Shur-way Group Inc. - Product / Service
- Shur-way Group Inc. - Key offerings
- 12.17 UFP Industries Inc.
- UFP Industries Inc. - Overview
- UFP Industries Inc. - Business segments
- UFP Industries Inc. - Key offerings
- UFP Industries Inc. - Segment focus
13 Appendix
- 13.1 Scope of the report
- 13.2 Inclusions and exclusions checklist
- Inclusions checklist
- Exclusions checklist
- 13.3 Currency conversion rates for US$
- Currency conversion rates for US$
- 13.4 Research methodology
- Research methodology
- 13.5 Data procurement
- Information sources
- 13.6 Data validation
- Data validation
- 13.7 Validation techniques employed for market sizing
- Validation techniques employed for market sizing
- 13.8 Data synthesis
- Data synthesis
- 13.9 360 degree market analysis
- 360 degree market analysis
- 13.10 List of abbreviations
- List of abbreviations
