|
|
市場調査レポート
商品コード
1557700
パワードリルの世界市場 2024年~2028年Global Power Drill Market 2024-2028 |
||||||
|
|||||||
カスタマイズ可能
|
|||||||


| パワードリルの世界市場 2024年~2028年 |
|
出版日: 2024年08月03日
発行: TechNavio
ページ情報: 英文 165 Pages
納期: 即納可能
|

全表示
- 概要
- 図表
- 目次
パワードリル市場は2023年~2028年に4億590万米ドル、予測期間中のCAGRは4.5%で成長すると予測されます。
当レポートでは、パワードリル市場の全体的な分析、市場規模・予測、動向、成長促進要因、課題、約25のベンダーを網羅したベンダー分析などを掲載しています。
現在の市場シナリオ、最新動向と促進要因、市場環境全体に関する最新分析を提供しています。市場は、先端技術による電動ドリルの技術革新の増加、DIYインテリアのためのホームセンター製品への関心の高まり、インフラ整備の重視による不動産業界の急成長などが牽引しています。
| 市場範囲 | |
|---|---|
| 基準年 | 2024年 |
| 終了年 | 2028年 |
| 予測期間 | 2024年~2028年 |
| 成長モメンタム | 加速 |
| 前年比2024年 | 4.23% |
| CAGR | 4.5% |
| 増分額 | 4億590万米ドル |
本調査では、コードレスパワードリルの登場が、今後数年間のパワードリル市場成長を牽引する主要因の1つであるとしています。また、多機能パワードリルのイントロダクションや、Ni-CDからLi-Ionバッテリー化学へのシフトの増加が、市場の大きな需要につながります。
目次
第1章 エグゼクティブサマリー
- 市場概要
第2章 市場情勢
- 市場エコシステム
- 市場の特徴
- バリューチェーン分析
第3章 市場規模の評価
- 市場の定義
- 市場セグメント分析
- 市場規模 2023年
- 市場の見通し 2023年~2028年
第4章 市場規模実績
- パワードリルの世界市場 2018年~2022年
- 製品セグメント分析 2018年~2022年
- 技術セグメント分析 2018年~2022年
- 地域別セグメント分析 2018年~2022年
- 国別セグメント分析 2018年~2022年
第5章 ファイブフォース分析
- ファイブフォースの要約
- 買い手の交渉力
- 供給企業の交渉力
- 新規参入業者の脅威
- 代替品の脅威
- 競争の脅威
- 市況
第6章 市場セグメンテーション:製品別
- 市場セグメンテーション
- 比較:製品別
- ハンマードリルと回転式電動ドリル:市場規模と予測 2023年~2028年
- インパクトパワードリル:市場規模と予測 2023年~2028年
- 従来の電動ドリル:市場規模と予測 2023年~2028年
- 市場機会:製品別
第7章 市場セグメンテーション:技術別
- 市場セグメンテーション
- 比較:技術別
- コードレス電動ドリル:市場規模と予測 2023年~2028年
- コード式電動ドリル:市場規模と予測 2023年~2028年
- 市場機会:技術別
第8章 顧客情勢
- 顧客情勢の概要
第9章 地域別情勢
- 地域別セグメンテーション
- 地域別比較
- 北米:市場規模と予測 2023年~2028年
- 欧州:市場規模と予測 2023年~2028年
- アジア太平洋:市場規模と予測 2023年~2028年
- 中東・アフリカ:市場規模と予測 2023年~2028年
- 南米:市場規模と予測 2023年~2028年
- 米国:市場規模と予測 2023年~2028年
- ドイツ:市場規模と予測 2023年~2028年
- 中国:市場規模と予測 2023年~2028年
- カナダ:市場規模と予測 2023年~2028年
- フランス:市場規模と予測 2023年~2028年
- 市場機会:地域別
第10章 促進要因・課題・機会・抑制要因
- 市場促進要因
- 市場の課題
- 促進要因と課題の影響
- 市場の機会・抑制要因
第11章 競合情勢
- 概要
- 競合情勢
- 混乱の状況
- 業界のリスク
第12章 競合分析
- 企業プロファイル
- 企業の市場ポジショニング
- Atlas Copco AB
- Emerson Electric Co.
- Enerpac Tool Group Corp.
- Hilti AG
- Ingersoll Rand Inc.
- Koki Holdings Co. Ltd.
- Makita Corp.
- Robert Bosch GmbH
- Stanley Black and Decker Inc.
- Techtronic Industries Co. Ltd.
第13章 付録
Exhibits:
- Exhibits1: Executive Summary - Chart on Market Overview
- Exhibits2: Executive Summary - Data Table on Market Overview
- Exhibits3: Executive Summary - Chart on Global Market Characteristics
- Exhibits4: Executive Summary - Chart on Market by Geography
- Exhibits5: Executive Summary - Chart on Market Segmentation by Product
- Exhibits6: Executive Summary - Chart on Market Segmentation by Technology
- Exhibits7: Executive Summary - Chart on Incremental Growth
- Exhibits8: Executive Summary - Data Table on Incremental Growth
- Exhibits9: Executive Summary - Chart on Company Market Positioning
- Exhibits10: Parent Market
- Exhibits11: Data Table on - Parent Market
- Exhibits12: Market characteristics analysis
- Exhibits13: Value Chain Analysis
- Exhibits14: Offerings of companies included in the market definition
- Exhibits15: Market segments
- Exhibits16: Chart on Global - Market size and forecast 2023-2028 ($ million)
- Exhibits17: Data Table on Global - Market size and forecast 2023-2028 ($ million)
- Exhibits18: Chart on Global Market: Year-over-year growth 2023-2028 (%)
- Exhibits19: Data Table on Global Market: Year-over-year growth 2023-2028 (%)
- Exhibits20: Historic Market Size - Data Table on Global Power Drill Market 2018 - 2022 ($ million)
- Exhibits21: Historic Market Size - Product Segment 2018 - 2022 ($ million)
- Exhibits22: Historic Market Size - Technology Segment 2018 - 2022 ($ million)
- Exhibits23: Historic Market Size - Geography Segment 2018 - 2022 ($ million)
- Exhibits24: Historic Market Size - Country Segment 2018 - 2022 ($ million)
- Exhibits25: Five forces analysis - Comparison between 2023 and 2028
- Exhibits26: Bargaining power of buyers - Impact of key factors 2023 and 2028
- Exhibits27: Bargaining power of suppliers - Impact of key factors in 2023 and 2028
- Exhibits28: Threat of new entrants - Impact of key factors in 2023 and 2028
- Exhibits29: Threat of substitutes - Impact of key factors in 2023 and 2028
- Exhibits30: Threat of rivalry - Impact of key factors in 2023 and 2028
- Exhibits31: Chart on Market condition - Five forces 2023 and 2028
- Exhibits32: Chart on Product - Market share 2023-2028 (%)
- Exhibits33: Data Table on Product - Market share 2023-2028 (%)
- Exhibits34: Chart on Comparison by Product
- Exhibits35: Data Table on Comparison by Product
- Exhibits36: Chart on Hammer and rotary power drills - Market size and forecast 2023-2028 ($ million)
- Exhibits37: Data Table on Hammer and rotary power drills - Market size and forecast 2023-2028 ($ million)
- Exhibits38: Chart on Hammer and rotary power drills - Year-over-year growth 2023-2028 (%)
- Exhibits39: Data Table on Hammer and rotary power drills - Year-over-year growth 2023-2028 (%)
- Exhibits40: Chart on Impact power drills - Market size and forecast 2023-2028 ($ million)
- Exhibits41: Data Table on Impact power drills - Market size and forecast 2023-2028 ($ million)
- Exhibits42: Chart on Impact power drills - Year-over-year growth 2023-2028 (%)
- Exhibits43: Data Table on Impact power drills - Year-over-year growth 2023-2028 (%)
- Exhibits44: Chart on Traditional power drills - Market size and forecast 2023-2028 ($ million)
- Exhibits45: Data Table on Traditional power drills - Market size and forecast 2023-2028 ($ million)
- Exhibits46: Chart on Traditional power drills - Year-over-year growth 2023-2028 (%)
- Exhibits47: Data Table on Traditional power drills - Year-over-year growth 2023-2028 (%)
- Exhibits48: Market opportunity by Product ($ million)
- Exhibits49: Data Table on Market opportunity by Product ($ million)
- Exhibits50: Chart on Technology - Market share 2023-2028 (%)
- Exhibits51: Data Table on Technology - Market share 2023-2028 (%)
- Exhibits52: Chart on Comparison by Technology
- Exhibits53: Data Table on Comparison by Technology
- Exhibits54: Chart on Cordless power drills - Market size and forecast 2023-2028 ($ million)
- Exhibits55: Data Table on Cordless power drills - Market size and forecast 2023-2028 ($ million)
- Exhibits56: Chart on Cordless power drills - Year-over-year growth 2023-2028 (%)
- Exhibits57: Data Table on Cordless power drills - Year-over-year growth 2023-2028 (%)
- Exhibits58: Chart on Corded power drills - Market size and forecast 2023-2028 ($ million)
- Exhibits59: Data Table on Corded power drills - Market size and forecast 2023-2028 ($ million)
- Exhibits60: Chart on Corded power drills - Year-over-year growth 2023-2028 (%)
- Exhibits61: Data Table on Corded power drills - Year-over-year growth 2023-2028 (%)
- Exhibits62: Market opportunity by Technology ($ million)
- Exhibits63: Data Table on Market opportunity by Technology ($ million)
- Exhibits64: Analysis of price sensitivity, lifecycle, customer purchase basket, adoption rates, and purchase criteria
- Exhibits65: Chart on Market share by geography 2023-2028 (%)
- Exhibits66: Data Table on Market share by geography 2023-2028 (%)
- Exhibits67: Chart on Geographic comparison
- Exhibits68: Data Table on Geographic comparison
- Exhibits69: Chart on North America - Market size and forecast 2023-2028 ($ million)
- Exhibits70: Data Table on North America - Market size and forecast 2023-2028 ($ million)
- Exhibits71: Chart on North America - Year-over-year growth 2023-2028 (%)
- Exhibits72: Data Table on North America - Year-over-year growth 2023-2028 (%)
- Exhibits73: Chart on Europe - Market size and forecast 2023-2028 ($ million)
- Exhibits74: Data Table on Europe - Market size and forecast 2023-2028 ($ million)
- Exhibits75: Chart on Europe - Year-over-year growth 2023-2028 (%)
- Exhibits76: Data Table on Europe - Year-over-year growth 2023-2028 (%)
- Exhibits77: Chart on APAC - Market size and forecast 2023-2028 ($ million)
- Exhibits78: Data Table on APAC - Market size and forecast 2023-2028 ($ million)
- Exhibits79: Chart on APAC - Year-over-year growth 2023-2028 (%)
- Exhibits80: Data Table on APAC - Year-over-year growth 2023-2028 (%)
- Exhibits81: Chart on Middle East and Africa - Market size and forecast 2023-2028 ($ million)
- Exhibits82: Data Table on Middle East and Africa - Market size and forecast 2023-2028 ($ million)
- Exhibits83: Chart on Middle East and Africa - Year-over-year growth 2023-2028 (%)
- Exhibits84: Data Table on Middle East and Africa - Year-over-year growth 2023-2028 (%)
- Exhibits85: Chart on South America - Market size and forecast 2023-2028 ($ million)
- Exhibits86: Data Table on South America - Market size and forecast 2023-2028 ($ million)
- Exhibits87: Chart on South America - Year-over-year growth 2023-2028 (%)
- Exhibits88: Data Table on South America - Year-over-year growth 2023-2028 (%)
- Exhibits89: Chart on US - Market size and forecast 2023-2028 ($ million)
- Exhibits90: Data Table on US - Market size and forecast 2023-2028 ($ million)
- Exhibits91: Chart on US - Year-over-year growth 2023-2028 (%)
- Exhibits92: Data Table on US - Year-over-year growth 2023-2028 (%)
- Exhibits93: Chart on Germany - Market size and forecast 2023-2028 ($ million)
- Exhibits94: Data Table on Germany - Market size and forecast 2023-2028 ($ million)
- Exhibits95: Chart on Germany - Year-over-year growth 2023-2028 (%)
- Exhibits96: Data Table on Germany - Year-over-year growth 2023-2028 (%)
- Exhibits97: Chart on China - Market size and forecast 2023-2028 ($ million)
- Exhibits98: Data Table on China - Market size and forecast 2023-2028 ($ million)
- Exhibits99: Chart on China - Year-over-year growth 2023-2028 (%)
- Exhibits100: Data Table on China - Year-over-year growth 2023-2028 (%)
- Exhibits101: Chart on Canada - Market size and forecast 2023-2028 ($ million)
- Exhibits102: Data Table on Canada - Market size and forecast 2023-2028 ($ million)
- Exhibits103: Chart on Canada - Year-over-year growth 2023-2028 (%)
- Exhibits104: Data Table on Canada - Year-over-year growth 2023-2028 (%)
- Exhibits105: Chart on France - Market size and forecast 2023-2028 ($ million)
- Exhibits106: Data Table on France - Market size and forecast 2023-2028 ($ million)
- Exhibits107: Chart on France - Year-over-year growth 2023-2028 (%)
- Exhibits108: Data Table on France - Year-over-year growth 2023-2028 (%)
- Exhibits109: Market opportunity by geography ($ million)
- Exhibits110: Data Tables on Market opportunity by geography ($ million)
- Exhibits111: Impact of drivers and challenges in 2023 and 2028
- Exhibits112: Overview on criticality of inputs and factors of differentiation
- Exhibits113: Overview on factors of disruption
- Exhibits114: Impact of key risks on business
- Exhibits115: Companies covered
- Exhibits116: Matrix on companies position and classification
- Exhibits117: Atlas Copco AB - Overview
- Exhibits118: Atlas Copco AB - Business segments
- Exhibits119: Atlas Copco AB - Key news
- Exhibits120: Atlas Copco AB - Key offerings
- Exhibits121: Atlas Copco AB - Segment focus
- Exhibits122: Emerson Electric Co. - Overview
- Exhibits123: Emerson Electric Co. - Business segments
- Exhibits124: Emerson Electric Co. - Key news
- Exhibits125: Emerson Electric Co. - Key offerings
- Exhibits126: Emerson Electric Co. - Segment focus
- Exhibits127: Enerpac Tool Group Corp. - Overview
- Exhibits128: Enerpac Tool Group Corp. - Business segments
- Exhibits129: Enerpac Tool Group Corp. - Key offerings
- Exhibits130: Enerpac Tool Group Corp. - Segment focus
- Exhibits131: Hilti AG - Overview
- Exhibits132: Hilti AG - Product / Service
- Exhibits133: Hilti AG - Key offerings
- Exhibits134: Ingersoll Rand Inc. - Overview
- Exhibits135: Ingersoll Rand Inc. - Business segments
- Exhibits136: Ingersoll Rand Inc. - Key news
- Exhibits137: Ingersoll Rand Inc. - Key offerings
- Exhibits138: Ingersoll Rand Inc. - Segment focus
- Exhibits139: Koki Holdings Co. Ltd. - Overview
- Exhibits140: Koki Holdings Co. Ltd. - Product / Service
- Exhibits141: Koki Holdings Co. Ltd. - Key news
- Exhibits142: Koki Holdings Co. Ltd. - Key offerings
- Exhibits143: Makita Corp. - Overview
- Exhibits144: Makita Corp. - Business segments
- Exhibits145: Makita Corp. - Key offerings
- Exhibits146: Makita Corp. - Segment focus
- Exhibits147: Robert Bosch GmbH - Overview
- Exhibits148: Robert Bosch GmbH - Product / Service
- Exhibits149: Robert Bosch GmbH - Key news
- Exhibits150: Robert Bosch GmbH - Key offerings
- Exhibits151: Stanley Black and Decker Inc. - Overview
- Exhibits152: Stanley Black and Decker Inc. - Business segments
- Exhibits153: Stanley Black and Decker Inc. - Key news
- Exhibits154: Stanley Black and Decker Inc. - Key offerings
- Exhibits155: Stanley Black and Decker Inc. - Segment focus
- Exhibits156: Techtronic Industries Co. Ltd. - Overview
- Exhibits157: Techtronic Industries Co. Ltd. - Business segments
- Exhibits158: Techtronic Industries Co. Ltd. - Key news
- Exhibits159: Techtronic Industries Co. Ltd. - Key offerings
- Exhibits160: Techtronic Industries Co. Ltd. - Segment focus
- Exhibits161: Inclusions checklist
- Exhibits162: Exclusions checklist
- Exhibits163: Currency conversion rates for US$
- Exhibits164: Research methodology
- Exhibits165: Information sources
- Exhibits166: Data validation
- Exhibits167: Validation techniques employed for market sizing
- Exhibits168: Data synthesis
- Exhibits169: 360 degree market analysis
- Exhibits170: List of abbreviations
The power drill market is forecasted to grow by USD 405.9 mn during 2023-2028, accelerating at a CAGR of 4.5% during the forecast period. The report on the power drill market provides a holistic analysis, market size and forecast, trends, growth drivers, and challenges, as well as vendor analysis covering around 25 vendors.
The report offers an up-to-date analysis regarding the current market scenario, the latest trends and drivers, and the overall market environment. The market is driven by increased innovations in power drills through advanced technologies, growing interest in home improvement products for DIY interior designing, and surging real estate industry owing to emphasis on infrastructure development.
Technavio's power drill market is segmented as below:
| Market Scope | |
|---|---|
| Base Year | 2024 |
| End Year | 2028 |
| Series Year | 2024-2028 |
| Growth Momentum | Accelerate |
| YOY 2024 | 4.23% |
| CAGR | 4.5% |
| Incremental Value | $405.9mn |
By Product
- Hammer and rotary power drills
- Impact power drills
- Traditional power drills
By Technology
- Cordless power drills
- Corded power drills
By Geography
- North America
- Europe
- APAC
- Middle East and Africa
- South America
This study identifies the advent of cordless power drills as one of the prime reasons driving the power drill market growth during the next few years. Also, introduction of multifunctional power drills and increasing shift from Ni-CD to Li-Ion battery chemistry will lead to sizable demand in the market.
The report on the power drill market covers the following areas:
- Power drill market sizing
- Power drill market forecast
- Power drill market industry analysis
The robust vendor analysis is designed to help clients improve their market position, and in line with this, this report provides a detailed analysis of several leading power drill market vendors that include Apex Tool Group LLC, Atlas Copco AB, C. and E. Fein GmbH, Chervon Holdings Ltd., Emerson Electric Co., Enerpac Tool Group Corp., Festool GmbH, Hilti AG, Husqvarna AB, Ingersoll Rand Inc., Jiangsu Dongcheng M and E Tools Co Ltd, Josch Group, Koki Holdings Co. Ltd., Makita Corp., Nemo Power Tools Ltd., Panasonic Holdings Corp., Robert Bosch GmbH, Snap On Inc., Stanley Black and Decker Inc., and Techtronic Industries Co. Ltd.. Also, the power drill market analysis report includes information on upcoming trends and challenges that will influence market growth. This is to help companies strategize and leverage all forthcoming growth opportunities.
The study was conducted using an objective combination of primary and secondary information including inputs from key participants in the industry. The report contains a comprehensive market and vendor landscape in addition to an analysis of the key vendors.
The publisher presents a detailed picture of the market by the way of study, synthesis, and summation of data from multiple sources by an analysis of key parameters such as profit, pricing, competition, and promotions. It presents various market facets by identifying the key industry influencers. The data presented is comprehensive, reliable, and a result of extensive research - both primary and secondary. The market research reports provide a complete competitive landscape and an in-depth vendor selection methodology and analysis using qualitative and quantitative research to forecast the accurate market growth.
Table of Contents
1 Executive Summary
- 1.1 Market overview
- Executive Summary - Chart on Market Overview
- Executive Summary - Data Table on Market Overview
- Executive Summary - Chart on Global Market Characteristics
- Executive Summary - Chart on Market by Geography
- Executive Summary - Chart on Market Segmentation by Product
- Executive Summary - Chart on Market Segmentation by Technology
- Executive Summary - Chart on Incremental Growth
- Executive Summary - Data Table on Incremental Growth
- Executive Summary - Chart on Company Market Positioning
2 Market Landscape
- 2.1 Market ecosystem
- Parent Market
- Data Table on - Parent Market
- 2.2 Market characteristics
- Market characteristics analysis
- 2.3 Value chain analysis
- Value Chain Analysis
3 Market Sizing
- 3.1 Market definition
- Offerings of companies included in the market definition
- 3.2 Market segment analysis
- Market segments
- 3.3 Market size 2023
- 3.4 Market outlook: Forecast for 2023-2028
- Chart on Global - Market size and forecast 2023-2028 ($ million)
- Data Table on Global - Market size and forecast 2023-2028 ($ million)
- Chart on Global Market: Year-over-year growth 2023-2028 (%)
- Data Table on Global Market: Year-over-year growth 2023-2028 (%)
4 Historic Market Size
- 4.1 Global Power Drill Market 2018 - 2022
- Historic Market Size - Data Table on Global Power Drill Market 2018 - 2022 ($ million)
- 4.2 Product segment analysis 2018 - 2022
- Historic Market Size - Product Segment 2018 - 2022 ($ million)
- 4.3 Technology segment analysis 2018 - 2022
- Historic Market Size - Technology Segment 2018 - 2022 ($ million)
- 4.4 Geography segment analysis 2018 - 2022
- Historic Market Size - Geography Segment 2018 - 2022 ($ million)
- 4.5 Country segment analysis 2018 - 2022
- Historic Market Size - Country Segment 2018 - 2022 ($ million)
5 Five Forces Analysis
- 5.1 Five forces summary
- Five forces analysis - Comparison between 2023 and 2028
- 5.2 Bargaining power of buyers
- Bargaining power of buyers - Impact of key factors 2023 and 2028
- 5.3 Bargaining power of suppliers
- Bargaining power of suppliers - Impact of key factors in 2023 and 2028
- 5.4 Threat of new entrants
- Threat of new entrants - Impact of key factors in 2023 and 2028
- 5.5 Threat of substitutes
- Threat of substitutes - Impact of key factors in 2023 and 2028
- 5.6 Threat of rivalry
- Threat of rivalry - Impact of key factors in 2023 and 2028
- 5.7 Market condition
- Chart on Market condition - Five forces 2023 and 2028
6 Market Segmentation by Product
- 6.1 Market segments
- Chart on Product - Market share 2023-2028 (%)
- Data Table on Product - Market share 2023-2028 (%)
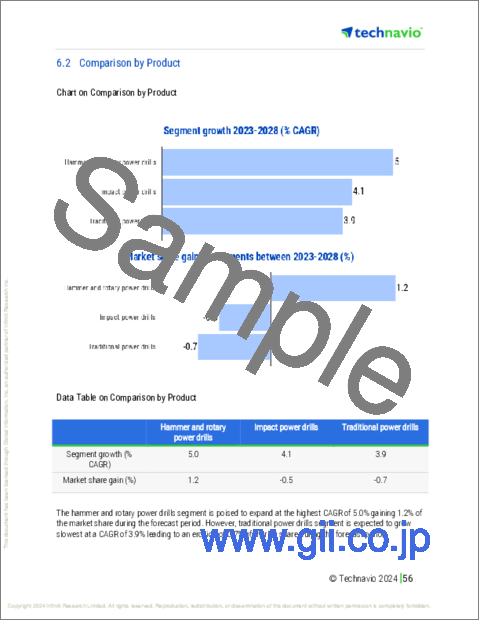
- 6.2 Comparison by Product
- Chart on Comparison by Product
- Data Table on Comparison by Product
- 6.3 Hammer and rotary power drills - Market size and forecast 2023-2028
- Chart on Hammer and rotary power drills - Market size and forecast 2023-2028 ($ million)
- Data Table on Hammer and rotary power drills - Market size and forecast 2023-2028 ($ million)
- Chart on Hammer and rotary power drills - Year-over-year growth 2023-2028 (%)
- Data Table on Hammer and rotary power drills - Year-over-year growth 2023-2028 (%)
- 6.4 Impact power drills - Market size and forecast 2023-2028
- Chart on Impact power drills - Market size and forecast 2023-2028 ($ million)
- Data Table on Impact power drills - Market size and forecast 2023-2028 ($ million)
- Chart on Impact power drills - Year-over-year growth 2023-2028 (%)
- Data Table on Impact power drills - Year-over-year growth 2023-2028 (%)
- 6.5 Traditional power drills - Market size and forecast 2023-2028
- Chart on Traditional power drills - Market size and forecast 2023-2028 ($ million)
- Data Table on Traditional power drills - Market size and forecast 2023-2028 ($ million)
- Chart on Traditional power drills - Year-over-year growth 2023-2028 (%)
- Data Table on Traditional power drills - Year-over-year growth 2023-2028 (%)
- 6.6 Market opportunity by Product
- Market opportunity by Product ($ million)
- Data Table on Market opportunity by Product ($ million)
7 Market Segmentation by Technology
- 7.1 Market segments
- Chart on Technology - Market share 2023-2028 (%)
- Data Table on Technology - Market share 2023-2028 (%)
- 7.2 Comparison by Technology
- Chart on Comparison by Technology
- Data Table on Comparison by Technology
- 7.3 Cordless power drills - Market size and forecast 2023-2028
- Chart on Cordless power drills - Market size and forecast 2023-2028 ($ million)
- Data Table on Cordless power drills - Market size and forecast 2023-2028 ($ million)
- Chart on Cordless power drills - Year-over-year growth 2023-2028 (%)
- Data Table on Cordless power drills - Year-over-year growth 2023-2028 (%)
- 7.4 Corded power drills - Market size and forecast 2023-2028
- Chart on Corded power drills - Market size and forecast 2023-2028 ($ million)
- Data Table on Corded power drills - Market size and forecast 2023-2028 ($ million)
- Chart on Corded power drills - Year-over-year growth 2023-2028 (%)
- Data Table on Corded power drills - Year-over-year growth 2023-2028 (%)
- 7.5 Market opportunity by Technology
- Market opportunity by Technology ($ million)
- Data Table on Market opportunity by Technology ($ million)
8 Customer Landscape
- 8.1 Customer landscape overview
- Analysis of price sensitivity, lifecycle, customer purchase basket, adoption rates, and purchase criteria
9 Geographic Landscape
- 9.1 Geographic segmentation
- Chart on Market share by geography 2023-2028 (%)
- Data Table on Market share by geography 2023-2028 (%)
- 9.2 Geographic comparison
- Chart on Geographic comparison
- Data Table on Geographic comparison
- 9.3 North America - Market size and forecast 2023-2028
- Chart on North America - Market size and forecast 2023-2028 ($ million)
- Data Table on North America - Market size and forecast 2023-2028 ($ million)
- Chart on North America - Year-over-year growth 2023-2028 (%)
- Data Table on North America - Year-over-year growth 2023-2028 (%)
- 9.4 Europe - Market size and forecast 2023-2028
- Chart on Europe - Market size and forecast 2023-2028 ($ million)
- Data Table on Europe - Market size and forecast 2023-2028 ($ million)
- Chart on Europe - Year-over-year growth 2023-2028 (%)
- Data Table on Europe - Year-over-year growth 2023-2028 (%)
- 9.5 APAC - Market size and forecast 2023-2028
- Chart on APAC - Market size and forecast 2023-2028 ($ million)
- Data Table on APAC - Market size and forecast 2023-2028 ($ million)
- Chart on APAC - Year-over-year growth 2023-2028 (%)
- Data Table on APAC - Year-over-year growth 2023-2028 (%)
- 9.6 Middle East and Africa - Market size and forecast 2023-2028
- Chart on Middle East and Africa - Market size and forecast 2023-2028 ($ million)
- Data Table on Middle East and Africa - Market size and forecast 2023-2028 ($ million)
- Chart on Middle East and Africa - Year-over-year growth 2023-2028 (%)
- Data Table on Middle East and Africa - Year-over-year growth 2023-2028 (%)
- 9.7 South America - Market size and forecast 2023-2028
- Chart on South America - Market size and forecast 2023-2028 ($ million)
- Data Table on South America - Market size and forecast 2023-2028 ($ million)
- Chart on South America - Year-over-year growth 2023-2028 (%)
- Data Table on South America - Year-over-year growth 2023-2028 (%)
- 9.8 US - Market size and forecast 2023-2028
- Chart on US - Market size and forecast 2023-2028 ($ million)
- Data Table on US - Market size and forecast 2023-2028 ($ million)
- Chart on US - Year-over-year growth 2023-2028 (%)
- Data Table on US - Year-over-year growth 2023-2028 (%)
- 9.9 Germany - Market size and forecast 2023-2028
- Chart on Germany - Market size and forecast 2023-2028 ($ million)
- Data Table on Germany - Market size and forecast 2023-2028 ($ million)
- Chart on Germany - Year-over-year growth 2023-2028 (%)
- Data Table on Germany - Year-over-year growth 2023-2028 (%)
- 9.10 China - Market size and forecast 2023-2028
- Chart on China - Market size and forecast 2023-2028 ($ million)
- Data Table on China - Market size and forecast 2023-2028 ($ million)
- Chart on China - Year-over-year growth 2023-2028 (%)
- Data Table on China - Year-over-year growth 2023-2028 (%)
- 9.11 Canada - Market size and forecast 2023-2028
- Chart on Canada - Market size and forecast 2023-2028 ($ million)
- Data Table on Canada - Market size and forecast 2023-2028 ($ million)
- Chart on Canada - Year-over-year growth 2023-2028 (%)
- Data Table on Canada - Year-over-year growth 2023-2028 (%)
- 9.12 France - Market size and forecast 2023-2028
- Chart on France - Market size and forecast 2023-2028 ($ million)
- Data Table on France - Market size and forecast 2023-2028 ($ million)
- Chart on France - Year-over-year growth 2023-2028 (%)
- Data Table on France - Year-over-year growth 2023-2028 (%)
- 9.13 Market opportunity by geography
- Market opportunity by geography ($ million)
- Data Tables on Market opportunity by geography ($ million)
10 Drivers, Challenges, and Opportunity/Restraints
- 10.1 Market drivers
- 10.2 Market challenges
- 10.3 Impact of drivers and challenges
- Impact of drivers and challenges in 2023 and 2028
- 10.4 Market opportunities/restraints
11 Competitive Landscape
- 11.1 Overview
- 11.2 Competitive Landscape
- Overview on criticality of inputs and factors of differentiation
- 11.3 Landscape disruption
- Overview on factors of disruption
- 11.4 Industry risks
- Impact of key risks on business
12 Competitive Analysis
- 12.1 Companies profiled
- Companies covered
- 12.2 Market positioning of companies
- Matrix on companies position and classification
- 12.3 Atlas Copco AB
- Atlas Copco AB - Overview
- Atlas Copco AB - Business segments
- Atlas Copco AB - Key news
- Atlas Copco AB - Key offerings
- Atlas Copco AB - Segment focus
- 12.4 Emerson Electric Co.
- Emerson Electric Co. - Overview
- Emerson Electric Co. - Business segments
- Emerson Electric Co. - Key news
- Emerson Electric Co. - Key offerings
- Emerson Electric Co. - Segment focus
- 12.5 Enerpac Tool Group Corp.
- Enerpac Tool Group Corp. - Overview
- Enerpac Tool Group Corp. - Business segments
- Enerpac Tool Group Corp. - Key offerings
- Enerpac Tool Group Corp. - Segment focus
- 12.6 Hilti AG
- Hilti AG - Overview
- Hilti AG - Product / Service
- Hilti AG - Key offerings
- 12.7 Ingersoll Rand Inc.
- Ingersoll Rand Inc. - Overview
- Ingersoll Rand Inc. - Business segments
- Ingersoll Rand Inc. - Key news
- Ingersoll Rand Inc. - Key offerings
- Ingersoll Rand Inc. - Segment focus
- 12.8 Koki Holdings Co. Ltd.
- Koki Holdings Co. Ltd. - Overview
- Koki Holdings Co. Ltd. - Product / Service
- Koki Holdings Co. Ltd. - Key news
- Koki Holdings Co. Ltd. - Key offerings
- 12.9 Makita Corp.
- Makita Corp. - Overview
- Makita Corp. - Business segments
- Makita Corp. - Key offerings
- Makita Corp. - Segment focus
- 12.10 Robert Bosch GmbH
- Robert Bosch GmbH - Overview
- Robert Bosch GmbH - Product / Service
- Robert Bosch GmbH - Key news
- Robert Bosch GmbH - Key offerings
- 12.11 Stanley Black and Decker Inc.
- Stanley Black and Decker Inc. - Overview
- Stanley Black and Decker Inc. - Business segments
- Stanley Black and Decker Inc. - Key news
- Stanley Black and Decker Inc. - Key offerings
- Stanley Black and Decker Inc. - Segment focus
- 12.12 Techtronic Industries Co. Ltd.
- Techtronic Industries Co. Ltd. - Overview
- Techtronic Industries Co. Ltd. - Business segments
- Techtronic Industries Co. Ltd. - Key news
- Techtronic Industries Co. Ltd. - Key offerings
- Techtronic Industries Co. Ltd. - Segment focus
13 Appendix
- 13.1 Scope of the report
- 13.2 Inclusions and exclusions checklist
- Inclusions checklist
- Exclusions checklist
- 13.3 Currency conversion rates for US$
- Currency conversion rates for US$
- 13.4 Research methodology
- Research methodology
- 13.5 Data procurement
- Information sources
- 13.6 Data validation
- Data validation
- 13.7 Validation techniques employed for market sizing
- Validation techniques employed for market sizing
- 13.8 Data synthesis
- Data synthesis
- 13.9 360 degree market analysis
- 360 degree market analysis
- 13.10 List of abbreviations
- List of abbreviations
