|
|
市場調査レポート
商品コード
1557694
体外受精機器・消耗品の世界市場 2024年~2028年Global IVF Devices and Consumables Market 2024-2028 |
||||||

|
|||||||
カスタマイズ可能
|
|||||||

| 体外受精機器・消耗品の世界市場 2024年~2028年 |
|
出版日: 2024年08月02日
発行: TechNavio
ページ情報: 英文 145 Pages
納期: 即納可能
|

全表示
- 概要
- 図表
- 目次
体外受精機器・消耗品市場は2023年~2028年に10億1,480万米ドル、予測期間中のCAGRは4.5%で成長すると予測されます。
当レポートでは、体外受精機器・消耗品市場の全体的な分析、市場規模・予測、動向、成長促進要因、課題、約25のベンダーを網羅したベンダー分析などを掲載しています。
現在の市場シナリオ、最新動向と促進要因、市場環境全体に関する最新分析を提供しています。市場は、不妊症患者数の増加、人工授精の需要の高まりと成功率の高さ、ベンダーによる投資や製品発売によって牽引されています。
| 市場範囲 | |
|---|---|
| 基準年 | 2024年 |
| 終了年 | 2028年 |
| 予測期間 | 2024年~2028年 |
| 成長モメンタム | 加速 |
| 前年比2024年 | 4.23% |
| CAGR | 4.5% |
| 増分額 | 10億1,480万米ドル |
本調査では、今後数年間の体外受精機器・消耗品市場成長を牽引する主な要因の一つとして、女性の妊娠遅延という新たな動向を挙げています。また、配偶子提供に対する意識の高まりと技術の進歩は、市場の大きな需要につながります。
目次
第1章 エグゼクティブサマリー
- 市場概要
第2章 市場情勢
- 市場エコシステム
- 市場の特徴
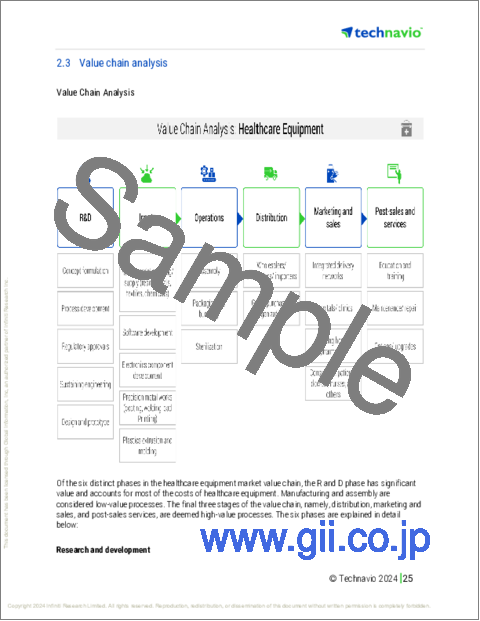
- バリューチェーン分析
第3章 市場規模の評価
- 市場の定義
- 市場セグメント分析
- 市場規模 2023年
- 市場の見通し 2023年~2028年
第4章 市場規模実績
- 体外受精機器・消耗品の世界市場 2018年~2022年
- 製品セグメント分析 2018年~2022年
- 地域別セグメント分析 2018年~2022年
- 国別セグメント分析 2018年~2022年
第5章 ファイブフォース分析
- ファイブフォースの要約
- 買い手の交渉力
- 供給企業の交渉力
- 新規参入業者の脅威
- 代替品の脅威
- 競争の脅威
- 市況
第6章 市場セグメンテーション:製品別
- 市場セグメンテーション
- 比較:製品別
- 培地および試薬:市場規模と予測 2023年~2028年
- アクセサリーと使い捨て品:市場規模と予測 2023年~2028年
- 器具:市場規模と予測 2023年~2028年
- 市場機会:製品別
第7章 顧客情勢
- 顧客情勢の概要
第8章 地域別情勢
- 地域別セグメンテーション
- 地域別比較
- 北米:市場規模と予測 2023年~2028年
- 欧州:市場規模と予測 2023年~2028年
- アジア:市場規模と予測 2023年~2028年
- 世界のその他の地域:市場規模と予測 2023年~2028年
- 米国:市場規模と予測 2023年~2028年
- ドイツ:市場規模と予測 2023年~2028年
- インド:市場規模と予測 2023年~2028年
- スペイン:市場規模と予測 2023年~2028年
- カナダ:市場規模と予測 2023年~2028年
- 市場機会:地域別
第9章 促進要因・課題・機会・抑制要因
- 市場促進要因
- 市場の課題
- 促進要因と課題の影響
- 市場の機会・抑制要因
第10章 競合情勢
- 概要
- 競合情勢
- 混乱の状況
- 業界のリスク
第11章 競合分析
- 企業プロファイル
- 企業の市場ポジショニング
- BIOPSYBELL Srl
- Cook Group Inc.
- Esco Medical
- FUJIFILM Irvine Scientific Inc.
- Hamilton Thorne Ltd
- INVO Bioscience Inc.
- Merck KGaA
- The Cooper Companies Inc.
- Thermo Fisher Scientific Inc.
- Vitrolife AB
第12章 付録
Exhibits:
- Exhibits1: Executive Summary - Chart on Market Overview
- Exhibits2: Executive Summary - Data Table on Market Overview
- Exhibits3: Executive Summary - Chart on Global Market Characteristics
- Exhibits4: Executive Summary - Chart on Market by Geography
- Exhibits5: Executive Summary - Chart on Market Segmentation by Product
- Exhibits6: Executive Summary - Chart on Incremental Growth
- Exhibits7: Executive Summary - Data Table on Incremental Growth
- Exhibits8: Executive Summary - Chart on Company Market Positioning
- Exhibits9: Parent Market
- Exhibits10: Data Table on - Parent Market
- Exhibits11: Market characteristics analysis
- Exhibits12: Value Chain Analysis
- Exhibits13: Offerings of companies included in the market definition
- Exhibits14: Market segments
- Exhibits15: Chart on Global - Market size and forecast 2023-2028 ($ million)
- Exhibits16: Data Table on Global - Market size and forecast 2023-2028 ($ million)
- Exhibits17: Chart on Global Market: Year-over-year growth 2023-2028 (%)
- Exhibits18: Data Table on Global Market: Year-over-year growth 2023-2028 (%)
- Exhibits19: Historic Market Size - Data Table on Global IVF Devices And Consumables Market 2018 - 2022 ($ million)
- Exhibits20: Historic Market Size - Product Segment 2018 - 2022 ($ million)
- Exhibits21: Historic Market Size - Geography Segment 2018 - 2022 ($ million)
- Exhibits22: Historic Market Size - Country Segment 2018 - 2022 ($ million)
- Exhibits23: Five forces analysis - Comparison between 2023 and 2028
- Exhibits24: Bargaining power of buyers - Impact of key factors 2023 and 2028
- Exhibits25: Bargaining power of suppliers - Impact of key factors in 2023 and 2028
- Exhibits26: Threat of new entrants - Impact of key factors in 2023 and 2028
- Exhibits27: Threat of substitutes - Impact of key factors in 2023 and 2028
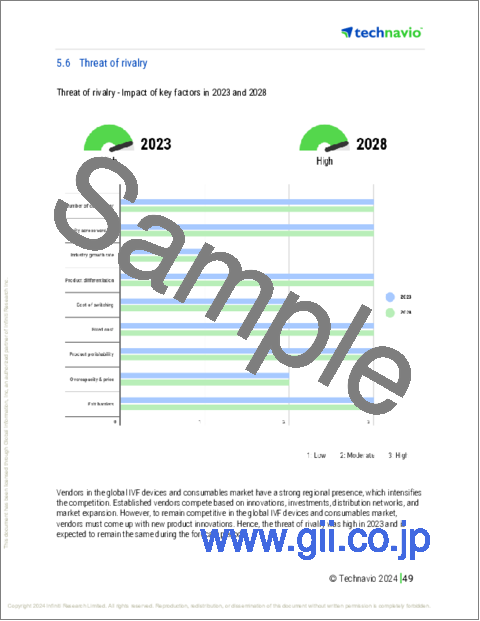
- Exhibits28: Threat of rivalry - Impact of key factors in 2023 and 2028
- Exhibits29: Chart on Market condition - Five forces 2023 and 2028
- Exhibits30: Chart on Product - Market share 2023-2028 (%)
- Exhibits31: Data Table on Product - Market share 2023-2028 (%)
- Exhibits32: Chart on Comparison by Product
- Exhibits33: Data Table on Comparison by Product
- Exhibits34: Chart on Culture media and reagents - Market size and forecast 2023-2028 ($ million)
- Exhibits35: Data Table on Culture media and reagents - Market size and forecast 2023-2028 ($ million)
- Exhibits36: Chart on Culture media and reagents - Year-over-year growth 2023-2028 (%)
- Exhibits37: Data Table on Culture media and reagents - Year-over-year growth 2023-2028 (%)
- Exhibits38: Chart on Accessories and disposables - Market size and forecast 2023-2028 ($ million)
- Exhibits39: Data Table on Accessories and disposables - Market size and forecast 2023-2028 ($ million)
- Exhibits40: Chart on Accessories and disposables - Year-over-year growth 2023-2028 (%)
- Exhibits41: Data Table on Accessories and disposables - Year-over-year growth 2023-2028 (%)
- Exhibits42: Chart on Instruments - Market size and forecast 2023-2028 ($ million)
- Exhibits43: Data Table on Instruments - Market size and forecast 2023-2028 ($ million)
- Exhibits44: Chart on Instruments - Year-over-year growth 2023-2028 (%)
- Exhibits45: Data Table on Instruments - Year-over-year growth 2023-2028 (%)
- Exhibits46: Market opportunity by Product ($ million)
- Exhibits47: Data Table on Market opportunity by Product ($ million)
- Exhibits48: Analysis of price sensitivity, lifecycle, customer purchase basket, adoption rates, and purchase criteria
- Exhibits49: Chart on Market share by geography 2023-2028 (%)
- Exhibits50: Data Table on Market share by geography 2023-2028 (%)
- Exhibits51: Chart on Geographic comparison
- Exhibits52: Data Table on Geographic comparison
- Exhibits53: Chart on North America - Market size and forecast 2023-2028 ($ million)
- Exhibits54: Data Table on North America - Market size and forecast 2023-2028 ($ million)
- Exhibits55: Chart on North America - Year-over-year growth 2023-2028 (%)
- Exhibits56: Data Table on North America - Year-over-year growth 2023-2028 (%)
- Exhibits57: Chart on Europe - Market size and forecast 2023-2028 ($ million)
- Exhibits58: Data Table on Europe - Market size and forecast 2023-2028 ($ million)
- Exhibits59: Chart on Europe - Year-over-year growth 2023-2028 (%)
- Exhibits60: Data Table on Europe - Year-over-year growth 2023-2028 (%)
- Exhibits61: Chart on Asia - Market size and forecast 2023-2028 ($ million)
- Exhibits62: Data Table on Asia - Market size and forecast 2023-2028 ($ million)
- Exhibits63: Chart on Asia - Year-over-year growth 2023-2028 (%)
- Exhibits64: Data Table on Asia - Year-over-year growth 2023-2028 (%)
- Exhibits65: Chart on Rest of World (ROW) - Market size and forecast 2023-2028 ($ million)
- Exhibits66: Data Table on Rest of World (ROW) - Market size and forecast 2023-2028 ($ million)
- Exhibits67: Chart on Rest of World (ROW) - Year-over-year growth 2023-2028 (%)
- Exhibits68: Data Table on Rest of World (ROW) - Year-over-year growth 2023-2028 (%)
- Exhibits69: Chart on US - Market size and forecast 2023-2028 ($ million)
- Exhibits70: Data Table on US - Market size and forecast 2023-2028 ($ million)
- Exhibits71: Chart on US - Year-over-year growth 2023-2028 (%)
- Exhibits72: Data Table on US - Year-over-year growth 2023-2028 (%)
- Exhibits73: Chart on Germany - Market size and forecast 2023-2028 ($ million)
- Exhibits74: Data Table on Germany - Market size and forecast 2023-2028 ($ million)
- Exhibits75: Chart on Germany - Year-over-year growth 2023-2028 (%)
- Exhibits76: Data Table on Germany - Year-over-year growth 2023-2028 (%)
- Exhibits77: Chart on India - Market size and forecast 2023-2028 ($ million)
- Exhibits78: Data Table on India - Market size and forecast 2023-2028 ($ million)
- Exhibits79: Chart on India - Year-over-year growth 2023-2028 (%)
- Exhibits80: Data Table on India - Year-over-year growth 2023-2028 (%)
- Exhibits81: Chart on Spain - Market size and forecast 2023-2028 ($ million)
- Exhibits82: Data Table on Spain - Market size and forecast 2023-2028 ($ million)
- Exhibits83: Chart on Spain - Year-over-year growth 2023-2028 (%)
- Exhibits84: Data Table on Spain - Year-over-year growth 2023-2028 (%)
- Exhibits85: Chart on Canada - Market size and forecast 2023-2028 ($ million)
- Exhibits86: Data Table on Canada - Market size and forecast 2023-2028 ($ million)
- Exhibits87: Chart on Canada - Year-over-year growth 2023-2028 (%)
- Exhibits88: Data Table on Canada - Year-over-year growth 2023-2028 (%)
- Exhibits89: Market opportunity by geography ($ million)
- Exhibits90: Data Tables on Market opportunity by geography ($ million)
- Exhibits91: Impact of drivers and challenges in 2023 and 2028
- Exhibits92: Overview on criticality of inputs and factors of differentiation
- Exhibits93: Overview on factors of disruption
- Exhibits94: Impact of key risks on business
- Exhibits95: Companies covered
- Exhibits96: Matrix on companies position and classification
- Exhibits97: BIOPSYBELL Srl - Overview
- Exhibits98: BIOPSYBELL Srl - Product / Service
- Exhibits99: BIOPSYBELL Srl - Key offerings
- Exhibits100: Cook Group Inc. - Overview
- Exhibits101: Cook Group Inc. - Product / Service
- Exhibits102: Cook Group Inc. - Key offerings
- Exhibits103: Esco Medical - Overview
- Exhibits104: Esco Medical - Product / Service
- Exhibits105: Esco Medical - Key offerings
- Exhibits106: FUJIFILM Irvine Scientific Inc. - Overview
- Exhibits107: FUJIFILM Irvine Scientific Inc. - Product / Service
- Exhibits108: FUJIFILM Irvine Scientific Inc. - Key offerings
- Exhibits109: Hamilton Thorne Ltd - Overview
- Exhibits110: Hamilton Thorne Ltd - Product / Service
- Exhibits111: Hamilton Thorne Ltd - Key offerings
- Exhibits112: INVO Bioscience Inc. - Overview
- Exhibits113: INVO Bioscience Inc. - Product / Service
- Exhibits114: INVO Bioscience Inc. - Key news
- Exhibits115: INVO Bioscience Inc. - Key offerings
- Exhibits116: Merck KGaA - Overview
- Exhibits117: Merck KGaA - Business segments
- Exhibits118: Merck KGaA - Key news
- Exhibits119: Merck KGaA - Key offerings
- Exhibits120: Merck KGaA - Segment focus
- Exhibits121: The Cooper Companies Inc. - Overview
- Exhibits122: The Cooper Companies Inc. - Business segments
- Exhibits123: The Cooper Companies Inc. - Key news
- Exhibits124: The Cooper Companies Inc. - Key offerings
- Exhibits125: The Cooper Companies Inc. - Segment focus
- Exhibits126: Thermo Fisher Scientific Inc. - Overview
- Exhibits127: Thermo Fisher Scientific Inc. - Business segments
- Exhibits128: Thermo Fisher Scientific Inc. - Key news
- Exhibits129: Thermo Fisher Scientific Inc. - Key offerings
- Exhibits130: Thermo Fisher Scientific Inc. - Segment focus
- Exhibits131: Vitrolife AB - Overview
- Exhibits132: Vitrolife AB - Business segments
- Exhibits133: Vitrolife AB - Key news
- Exhibits134: Vitrolife AB - Key offerings
- Exhibits135: Vitrolife AB - Segment focus
- Exhibits136: Inclusions checklist
- Exhibits137: Exclusions checklist
- Exhibits138: Currency conversion rates for US$
- Exhibits139: Research methodology
- Exhibits140: Information sources
- Exhibits141: Data validation
- Exhibits142: Validation techniques employed for market sizing
- Exhibits143: Data synthesis
- Exhibits144: 360 degree market analysis
- Exhibits145: List of abbreviations
The ivf devices and consumables market is forecasted to grow by USD 1014.8 mn during 2023-2028, accelerating at a CAGR of 4.5% during the forecast period. The report on the ivf devices and consumables market provides a holistic analysis, market size and forecast, trends, growth drivers, and challenges, as well as vendor analysis covering around 25 vendors.
The report offers an up-to-date analysis regarding the current market scenario, the latest trends and drivers, and the overall market environment. The market is driven by rise in the number of infertility cases, growing demand for and high success rate of ivf procedures, and investments and product launches by market vendors.
Technavio's ivf devices and consumables market is segmented as below:
| Market Scope | |
|---|---|
| Base Year | 2024 |
| End Year | 2028 |
| Series Year | 2024-2028 |
| Growth Momentum | Accelerate |
| YOY 2024 | 4.23% |
| CAGR | 4.5% |
| Incremental Value | $1014.8mn |
By Product
- Culture media and reagents
- Accessories and disposables
- Instruments
By Geography
- North America
- Europe
- Asia
- Rest of World (ROW)
This study identifies the emerging trend of delayed pregnancies among women as one of the prime reasons driving the ivf devices and consumables market growth during the next few years. Also, growing awareness of gamete donations and technological advances will lead to sizable demand in the market.
The report on the ivf devices and consumables market covers the following areas:
- Ivf devices and consumables market sizing
- Ivf devices and consumables market forecast
- Ivf devices and consumables market industry analysis
The robust vendor analysis is designed to help clients improve their market position, and in line with this, this report provides a detailed analysis of several leading ivf devices and consumables market vendors that include BIOPSYBELL Srl, CCD Laboratory, Cook Group Inc., Esco Medical, FUJIFILM Irvine Scientific Inc., Genea Biomedx, Hamilton Thorne Ltd, Intermedics Ltd., INVO Bioscience Inc., IVFtech ApS, KITAZATO Corp., LabIVF Asia Pte Ltd., Merck KGaA, Progyny Inc, Rocket Medical Plc, SAR Healthline Pvt Ltd., Shivani Scientific Industries Pvt. Ltd., The Cooper Companies Inc., Thermo Fisher Scientific Inc., and Vitrolife AB. Also, the ivf devices and consumables market analysis report includes information on upcoming trends and challenges that will influence market growth. This is to help companies strategize and leverage all forthcoming growth opportunities.
The study was conducted using an objective combination of primary and secondary information including inputs from key participants in the industry. The report contains a comprehensive market and vendor landscape in addition to an analysis of the key vendors.
The publisher presents a detailed picture of the market by the way of study, synthesis, and summation of data from multiple sources by an analysis of key parameters such as profit, pricing, competition, and promotions. It presents various market facets by identifying the key industry influencers. The data presented is comprehensive, reliable, and a result of extensive research - both primary and secondary. The market research reports provide a complete competitive landscape and an in-depth vendor selection methodology and analysis using qualitative and quantitative research to forecast the accurate market growth.
Table of Contents
1 Executive Summary
- 1.1 Market overview
- Executive Summary - Chart on Market Overview
- Executive Summary - Data Table on Market Overview
- Executive Summary - Chart on Global Market Characteristics
- Executive Summary - Chart on Market by Geography
- Executive Summary - Chart on Market Segmentation by Product
- Executive Summary - Chart on Incremental Growth
- Executive Summary - Data Table on Incremental Growth
- Executive Summary - Chart on Company Market Positioning
2 Market Landscape
- 2.1 Market ecosystem
- Parent Market
- Data Table on - Parent Market
- 2.2 Market characteristics
- Market characteristics analysis
- 2.3 Value chain analysis
- Value Chain Analysis
3 Market Sizing
- 3.1 Market definition
- Offerings of companies included in the market definition
- 3.2 Market segment analysis
- Market segments
- 3.3 Market size 2023
- 3.4 Market outlook: Forecast for 2023-2028
- Chart on Global - Market size and forecast 2023-2028 ($ million)
- Data Table on Global - Market size and forecast 2023-2028 ($ million)
- Chart on Global Market: Year-over-year growth 2023-2028 (%)
- Data Table on Global Market: Year-over-year growth 2023-2028 (%)
4 Historic Market Size
- 4.1 Global IVF Devices And Consumables Market 2018 - 2022
- Historic Market Size - Data Table on Global IVF Devices And Consumables Market 2018 - 2022 ($ million)
- 4.2 Product segment analysis 2018 - 2022
- Historic Market Size - Product Segment 2018 - 2022 ($ million)
- 4.3 Geography segment analysis 2018 - 2022
- Historic Market Size - Geography Segment 2018 - 2022 ($ million)
- 4.4 Country segment analysis 2018 - 2022
- Historic Market Size - Country Segment 2018 - 2022 ($ million)
5 Five Forces Analysis
- 5.1 Five forces summary
- Five forces analysis - Comparison between 2023 and 2028
- 5.2 Bargaining power of buyers
- Bargaining power of buyers - Impact of key factors 2023 and 2028
- 5.3 Bargaining power of suppliers
- Bargaining power of suppliers - Impact of key factors in 2023 and 2028
- 5.4 Threat of new entrants
- Threat of new entrants - Impact of key factors in 2023 and 2028
- 5.5 Threat of substitutes
- Threat of substitutes - Impact of key factors in 2023 and 2028
- 5.6 Threat of rivalry
- Threat of rivalry - Impact of key factors in 2023 and 2028
- 5.7 Market condition
- Chart on Market condition - Five forces 2023 and 2028
6 Market Segmentation by Product
- 6.1 Market segments
- Chart on Product - Market share 2023-2028 (%)
- Data Table on Product - Market share 2023-2028 (%)
- 6.2 Comparison by Product
- Chart on Comparison by Product
- Data Table on Comparison by Product
- 6.3 Culture media and reagents - Market size and forecast 2023-2028
- Chart on Culture media and reagents - Market size and forecast 2023-2028 ($ million)
- Data Table on Culture media and reagents - Market size and forecast 2023-2028 ($ million)
- Chart on Culture media and reagents - Year-over-year growth 2023-2028 (%)
- Data Table on Culture media and reagents - Year-over-year growth 2023-2028 (%)
- 6.4 Accessories and disposables - Market size and forecast 2023-2028
- Chart on Accessories and disposables - Market size and forecast 2023-2028 ($ million)
- Data Table on Accessories and disposables - Market size and forecast 2023-2028 ($ million)
- Chart on Accessories and disposables - Year-over-year growth 2023-2028 (%)
- Data Table on Accessories and disposables - Year-over-year growth 2023-2028 (%)
- 6.5 Instruments - Market size and forecast 2023-2028
- Chart on Instruments - Market size and forecast 2023-2028 ($ million)
- Data Table on Instruments - Market size and forecast 2023-2028 ($ million)
- Chart on Instruments - Year-over-year growth 2023-2028 (%)
- Data Table on Instruments - Year-over-year growth 2023-2028 (%)
- 6.6 Market opportunity by Product
- Market opportunity by Product ($ million)
- Data Table on Market opportunity by Product ($ million)
7 Customer Landscape
- 7.1 Customer landscape overview
- Analysis of price sensitivity, lifecycle, customer purchase basket, adoption rates, and purchase criteria
8 Geographic Landscape
- 8.1 Geographic segmentation
- Chart on Market share by geography 2023-2028 (%)
- Data Table on Market share by geography 2023-2028 (%)
- 8.2 Geographic comparison
- Chart on Geographic comparison
- Data Table on Geographic comparison
- 8.3 North America - Market size and forecast 2023-2028
- Chart on North America - Market size and forecast 2023-2028 ($ million)
- Data Table on North America - Market size and forecast 2023-2028 ($ million)
- Chart on North America - Year-over-year growth 2023-2028 (%)
- Data Table on North America - Year-over-year growth 2023-2028 (%)
- 8.4 Europe - Market size and forecast 2023-2028
- Chart on Europe - Market size and forecast 2023-2028 ($ million)
- Data Table on Europe - Market size and forecast 2023-2028 ($ million)
- Chart on Europe - Year-over-year growth 2023-2028 (%)
- Data Table on Europe - Year-over-year growth 2023-2028 (%)
- 8.5 Asia - Market size and forecast 2023-2028
- Chart on Asia - Market size and forecast 2023-2028 ($ million)
- Data Table on Asia - Market size and forecast 2023-2028 ($ million)
- Chart on Asia - Year-over-year growth 2023-2028 (%)
- Data Table on Asia - Year-over-year growth 2023-2028 (%)
- 8.6 Rest of World (ROW) - Market size and forecast 2023-2028
- Chart on Rest of World (ROW) - Market size and forecast 2023-2028 ($ million)
- Data Table on Rest of World (ROW) - Market size and forecast 2023-2028 ($ million)
- Chart on Rest of World (ROW) - Year-over-year growth 2023-2028 (%)
- Data Table on Rest of World (ROW) - Year-over-year growth 2023-2028 (%)
- 8.7 US - Market size and forecast 2023-2028
- Chart on US - Market size and forecast 2023-2028 ($ million)
- Data Table on US - Market size and forecast 2023-2028 ($ million)
- Chart on US - Year-over-year growth 2023-2028 (%)
- Data Table on US - Year-over-year growth 2023-2028 (%)
- 8.8 Germany - Market size and forecast 2023-2028
- Chart on Germany - Market size and forecast 2023-2028 ($ million)
- Data Table on Germany - Market size and forecast 2023-2028 ($ million)
- Chart on Germany - Year-over-year growth 2023-2028 (%)
- Data Table on Germany - Year-over-year growth 2023-2028 (%)
- 8.9 India - Market size and forecast 2023-2028
- Chart on India - Market size and forecast 2023-2028 ($ million)
- Data Table on India - Market size and forecast 2023-2028 ($ million)
- Chart on India - Year-over-year growth 2023-2028 (%)
- Data Table on India - Year-over-year growth 2023-2028 (%)
- 8.10 Spain - Market size and forecast 2023-2028
- Chart on Spain - Market size and forecast 2023-2028 ($ million)
- Data Table on Spain - Market size and forecast 2023-2028 ($ million)
- Chart on Spain - Year-over-year growth 2023-2028 (%)
- Data Table on Spain - Year-over-year growth 2023-2028 (%)
- 8.11 Canada - Market size and forecast 2023-2028
- Chart on Canada - Market size and forecast 2023-2028 ($ million)
- Data Table on Canada - Market size and forecast 2023-2028 ($ million)
- Chart on Canada - Year-over-year growth 2023-2028 (%)
- Data Table on Canada - Year-over-year growth 2023-2028 (%)
- 8.12 Market opportunity by geography
- Market opportunity by geography ($ million)
- Data Tables on Market opportunity by geography ($ million)
9 Drivers, Challenges, and Opportunity/Restraints
- 9.1 Market drivers
- 9.2 Market challenges
- 9.3 Impact of drivers and challenges
- Impact of drivers and challenges in 2023 and 2028
- 9.4 Market opportunities/restraints
10 Competitive Landscape
- 10.1 Overview
- 10.2 Competitive Landscape
- Overview on criticality of inputs and factors of differentiation
- 10.3 Landscape disruption
- Overview on factors of disruption
- 10.4 Industry risks
- Impact of key risks on business
11 Competitive Analysis
- 11.1 Companies profiled
- Companies covered
- 11.2 Market positioning of companies
- Matrix on companies position and classification
- 11.3 BIOPSYBELL Srl
- BIOPSYBELL Srl - Overview
- BIOPSYBELL Srl - Product / Service
- BIOPSYBELL Srl - Key offerings
- 11.4 Cook Group Inc.
- Cook Group Inc. - Overview
- Cook Group Inc. - Product / Service
- Cook Group Inc. - Key offerings
- 11.5 Esco Medical
- Esco Medical - Overview
- Esco Medical - Product / Service
- Esco Medical - Key offerings
- 11.6 FUJIFILM Irvine Scientific Inc.
- FUJIFILM Irvine Scientific Inc. - Overview
- FUJIFILM Irvine Scientific Inc. - Product / Service
- FUJIFILM Irvine Scientific Inc. - Key offerings
- 11.7 Hamilton Thorne Ltd
- Hamilton Thorne Ltd - Overview
- Hamilton Thorne Ltd - Product / Service
- Hamilton Thorne Ltd - Key offerings
- 11.8 INVO Bioscience Inc.
- INVO Bioscience Inc. - Overview
- INVO Bioscience Inc. - Product / Service
- INVO Bioscience Inc. - Key news
- INVO Bioscience Inc. - Key offerings
- 11.9 Merck KGaA
- Merck KGaA - Overview
- Merck KGaA - Business segments
- Merck KGaA - Key news
- Merck KGaA - Key offerings
- Merck KGaA - Segment focus
- 11.10 The Cooper Companies Inc.
- The Cooper Companies Inc. - Overview
- The Cooper Companies Inc. - Business segments
- The Cooper Companies Inc. - Key news
- The Cooper Companies Inc. - Key offerings
- The Cooper Companies Inc. - Segment focus
- 11.11 Thermo Fisher Scientific Inc.
- Thermo Fisher Scientific Inc. - Overview
- Thermo Fisher Scientific Inc. - Business segments
- Thermo Fisher Scientific Inc. - Key news
- Thermo Fisher Scientific Inc. - Key offerings
- Thermo Fisher Scientific Inc. - Segment focus
- 11.12 Vitrolife AB
- Vitrolife AB - Overview
- Vitrolife AB - Business segments
- Vitrolife AB - Key news
- Vitrolife AB - Key offerings
- Vitrolife AB - Segment focus
12 Appendix
- 12.1 Scope of the report
- 12.2 Inclusions and exclusions checklist
- Inclusions checklist
- Exclusions checklist
- 12.3 Currency conversion rates for US$
- Currency conversion rates for US$
- 12.4 Research methodology
- Research methodology
- 12.5 Data procurement
- Information sources
- 12.6 Data validation
- Data validation
- 12.7 Validation techniques employed for market sizing
- Validation techniques employed for market sizing
- 12.8 Data synthesis
- Data synthesis
- 12.9 360 degree market analysis
- 360 degree market analysis
- 12.10 List of abbreviations
- List of abbreviations
