|
|
市場調査レポート
商品コード
1557684
フコイダンの世界市場、2024~2028年Global Fucoidan Market 2024-2028 |
||||||
|
|||||||
カスタマイズ可能
|
|||||||

| フコイダンの世界市場、2024~2028年 |
|
出版日: 2024年08月01日
発行: TechNavio
ページ情報: 英文 186 Pages
納期: 即納可能
|

全表示
- 概要
- 図表
- 目次
フコイダン市場は2023~2028年に1億960万米ドル、予測期間中のCAGRは7.77%で成長すると予測されます。
当レポートでは、フコイダン市場の全体的な分析、市場規模・予測、動向、成長促進要因、課題、約25のベンダーを網羅したベンダー分析などを掲載しています。
現在の市場シナリオ、最新動向と促進要因、市場環境全体に関する最新分析を提供しています。市場は、消費者の健康志向の高まり、家畜における疾病発生の増加に起因する動物用医薬品への需要の高まり、eコマースの導入の高まりによって牽引されています。
| 市場範囲 | |
|---|---|
| 基準年 | 2024年 |
| 終了年 | 2028年 |
| 予測期間 | 2024~2028年 |
| 成長モメンタム | 加速 |
| 前年比[2024年] | 7.57% |
| CAGR | 7.77% |
| 増分額 | 1億960万米ドル |
本調査では、製薬業界におけるフコイダンの需要増加が、今後数年間のフコイダン市場成長を牽引する主要因の一つであると分析しています。また、化粧品業界におけるフコイダンの用途拡大、フコイダン抽出物に対する規制認可の増加は、市場の大きな需要につながります。
目次
第1章 エグゼクティブサマリー
- 市場概要
第2章 Technavio分析
- 価格・ライフサイクル・顧客購入バスケット・採用率・購入基準の分析
- インプットの重要性と差別化の要因
- 混乱の要因
- 促進要因と課題の影響
第3章 市場情勢
- 市場エコシステム
- 市場の特徴
- バリューチェーン分析
第4章 市場規模の評価
- 市場の定義
- 市場セグメント分析
- 市場規模 2023年
- 市場の展望 2023~2028年
第5章 市場規模実績
- フコイダンの世界市場 2018~2022年
- タイプ別セグメント分析 2018~2022年
- 用途別セグメント分析 2018~2022年
- 地域別セグメント分析 2018~2022年
- 国別セグメント分析 2018~2022年
第6章 ファイブフォース分析
- ファイブフォースの要約
- 買い手の交渉力
- 供給企業の交渉力
- 新規参入業者の脅威
- 代替品の脅威
- 競争の脅威
- 市況
第7章 市場セグメンテーション:タイプ別
- 市場セグメンテーション
- 比較:タイプ別
- 粉:市場規模と予測 2023~2028年
- カプセル:市場規模と予測 2023~2028年
- その他:市場規模と予測 2023~2028年
- 市場機会:タイプ別
第8章 市場セグメンテーション:用途別
- 市場セグメンテーション
- 比較:用途別
- 製薬:市場規模と予測 2023~2028年
- 栄養補助食品:市場規模と予測 2023~2028年
- 化粧品:市場規模と予測 2023~2028年
- 市場機会:用途別
第9章 顧客情勢
- 顧客情勢概要
第10章 地域別情勢
- 地域別セグメンテーション
- 比較:地域別
- アジア太平洋:市場規模と予測 2023~2028年
- 欧州:市場規模と予測 2023~2028年
- 北米:市場規模と予測 2023~2028年
- 南米:市場規模と予測 2023~2028年
- 中東・アフリカ:市場規模と予測 2023~2028年
- 日本:市場規模と予測 2023~2028年
- 中国:市場規模と予測 2023~2028年
- 米国:市場規模と予測 2023~2028年
- インドネシア:市場規模と予測 2023~2028年
- ドイツ:市場規模と予測 2023~2028年
- 市場機会:地域別
第11章 促進要因・課題・機会・抑制要因
- 市場促進要因
- 市場課題
- 促進要因と課題の影響
- 市場の機会・抑制要因
第12章 競合情勢
- 概要
- 競合情勢
- 混乱の状況
- 業界のリスク
第13章 競合分析
- 企業プロファイル
- 企業ランキング指数
- 企業の市場ポジショニング
- Biocorp Co. Ltd.
- Champion Co., Ltd.
- Fucoidan USA.com
- Hi Q Marine Biotech International Ltd.
- Inaba Foods USA Inc.
- Kamerycah, Inc.
- KANEHIDE BIO Co.Ltd.
- Lemandou Chemicals
- Marinova Pty Ltd.
- Merck KGaA
- SeaHerb Co., LTD.
- SUGOI HEALTH
- The Synergy Co.
- TOKAI BUSSAN CO., LTD.
- Vesta Nutra
第14章 付録
Exhibits:
- Exhibits1: Executive Summary - Chart on Market Overview
- Exhibits2: Executive Summary - Data Table on Market Overview
- Exhibits3: Executive Summary - Chart on Global Market Characteristics
- Exhibits4: Executive Summary - Chart on Market by Geography
- Exhibits5: Executive Summary - Chart on Market Segmentation by Type
- Exhibits6: Executive Summary - Chart on Market Segmentation by Application
- Exhibits7: Executive Summary - Chart on Incremental Growth
- Exhibits8: Executive Summary - Data Table on Incremental Growth
- Exhibits9: Executive Summary - Chart on Company Market Positioning
- Exhibits10: Analysis of price sensitivity, lifecycle, customer purchase basket, adoption rates, and purchase criteria
- Exhibits11: Overview on criticality of inputs and factors of differentiation
- Exhibits12: Overview on factors of disruption
- Exhibits13: Impact of drivers and challenges in 2023 and 2028
- Exhibits14: Parent Market
- Exhibits15: Data Table on - Parent Market
- Exhibits16: Market characteristics analysis
- Exhibits17: Value Chain Analysis
- Exhibits18: Offerings of companies included in the market definition
- Exhibits19: Market segments
- Exhibits20: Chart on Global - Market size and forecast 2023-2028 ($ million)
- Exhibits21: Data Table on Global - Market size and forecast 2023-2028 ($ million)
- Exhibits22: Chart on Global Market: Year-over-year growth 2023-2028 (%)
- Exhibits23: Data Table on Global Market: Year-over-year growth 2023-2028 (%)
- Exhibits24: Historic Market Size - Data Table on Global Fucoidan Market 2018 - 2022 ($ million)
- Exhibits25: Historic Market Size - Type Segment 2018 - 2022 ($ million)
- Exhibits26: Historic Market Size - Application Segment 2018 - 2022 ($ million)
- Exhibits27: Historic Market Size - Geography Segment 2018 - 2022 ($ million)
- Exhibits28: Historic Market Size - Country Segment 2018 - 2022 ($ million)
- Exhibits29: Five forces analysis - Comparison between 2023 and 2028
- Exhibits30: Bargaining power of buyers - Impact of key factors 2023 and 2028
- Exhibits31: Bargaining power of suppliers - Impact of key factors in 2023 and 2028
- Exhibits32: Threat of new entrants - Impact of key factors in 2023 and 2028
- Exhibits33: Threat of substitutes - Impact of key factors in 2023 and 2028
- Exhibits34: Threat of rivalry - Impact of key factors in 2023 and 2028
- Exhibits35: Chart on Market condition - Five forces 2023 and 2028
- Exhibits36: Chart on Type - Market share 2023-2028 (%)
- Exhibits37: Data Table on Type - Market share 2023-2028 (%)
- Exhibits38: Chart on Comparison by Type
- Exhibits39: Data Table on Comparison by Type
- Exhibits40: Chart on Powder - Market size and forecast 2023-2028 ($ million)
- Exhibits41: Data Table on Powder - Market size and forecast 2023-2028 ($ million)
- Exhibits42: Chart on Powder - Year-over-year growth 2023-2028 (%)
- Exhibits43: Data Table on Powder - Year-over-year growth 2023-2028 (%)
- Exhibits44: Chart on Capsule - Market size and forecast 2023-2028 ($ million)
- Exhibits45: Data Table on Capsule - Market size and forecast 2023-2028 ($ million)
- Exhibits46: Chart on Capsule - Year-over-year growth 2023-2028 (%)
- Exhibits47: Data Table on Capsule - Year-over-year growth 2023-2028 (%)
- Exhibits48: Chart on Others - Market size and forecast 2023-2028 ($ million)
- Exhibits49: Data Table on Others - Market size and forecast 2023-2028 ($ million)
- Exhibits50: Chart on Others - Year-over-year growth 2023-2028 (%)
- Exhibits51: Data Table on Others - Year-over-year growth 2023-2028 (%)
- Exhibits52: Market opportunity by Type ($ million)
- Exhibits53: Data Table on Market opportunity by Type ($ million)
- Exhibits54: Chart on Application - Market share 2023-2028 (%)
- Exhibits55: Data Table on Application - Market share 2023-2028 (%)
- Exhibits56: Chart on Comparison by Application
- Exhibits57: Data Table on Comparison by Application
- Exhibits58: Chart on Pharmaceutical - Market size and forecast 2023-2028 ($ million)
- Exhibits59: Data Table on Pharmaceutical - Market size and forecast 2023-2028 ($ million)
- Exhibits60: Chart on Pharmaceutical - Year-over-year growth 2023-2028 (%)
- Exhibits61: Data Table on Pharmaceutical - Year-over-year growth 2023-2028 (%)
- Exhibits62: Chart on Dietary Supplements - Market size and forecast 2023-2028 ($ million)
- Exhibits63: Data Table on Dietary Supplements - Market size and forecast 2023-2028 ($ million)
- Exhibits64: Chart on Dietary Supplements - Year-over-year growth 2023-2028 (%)
- Exhibits65: Data Table on Dietary Supplements - Year-over-year growth 2023-2028 (%)
- Exhibits66: Chart on Cosmetics - Market size and forecast 2023-2028 ($ million)
- Exhibits67: Data Table on Cosmetics - Market size and forecast 2023-2028 ($ million)
- Exhibits68: Chart on Cosmetics - Year-over-year growth 2023-2028 (%)
- Exhibits69: Data Table on Cosmetics - Year-over-year growth 2023-2028 (%)
- Exhibits70: Market opportunity by Application ($ million)
- Exhibits71: Data Table on Market opportunity by Application ($ million)
- Exhibits72: Analysis of price sensitivity, lifecycle, customer purchase basket, adoption rates, and purchase criteria
- Exhibits73: Chart on Market share by geography 2023-2028 (%)
- Exhibits74: Data Table on Market share by geography 2023-2028 (%)
- Exhibits75: Chart on Geographic comparison
- Exhibits76: Data Table on Geographic comparison
- Exhibits77: Chart on APAC - Market size and forecast 2023-2028 ($ million)
- Exhibits78: Data Table on APAC - Market size and forecast 2023-2028 ($ million)
- Exhibits79: Chart on APAC - Year-over-year growth 2023-2028 (%)
- Exhibits80: Data Table on APAC - Year-over-year growth 2023-2028 (%)
- Exhibits81: Chart on Europe - Market size and forecast 2023-2028 ($ million)
- Exhibits82: Data Table on Europe - Market size and forecast 2023-2028 ($ million)
- Exhibits83: Chart on Europe - Year-over-year growth 2023-2028 (%)
- Exhibits84: Data Table on Europe - Year-over-year growth 2023-2028 (%)
- Exhibits85: Chart on North America - Market size and forecast 2023-2028 ($ million)
- Exhibits86: Data Table on North America - Market size and forecast 2023-2028 ($ million)
- Exhibits87: Chart on North America - Year-over-year growth 2023-2028 (%)
- Exhibits88: Data Table on North America - Year-over-year growth 2023-2028 (%)
- Exhibits89: Chart on South America - Market size and forecast 2023-2028 ($ million)
- Exhibits90: Data Table on South America - Market size and forecast 2023-2028 ($ million)
- Exhibits91: Chart on South America - Year-over-year growth 2023-2028 (%)
- Exhibits92: Data Table on South America - Year-over-year growth 2023-2028 (%)
- Exhibits93: Chart on Middle East and Africa - Market size and forecast 2023-2028 ($ million)
- Exhibits94: Data Table on Middle East and Africa - Market size and forecast 2023-2028 ($ million)
- Exhibits95: Chart on Middle East and Africa - Year-over-year growth 2023-2028 (%)
- Exhibits96: Data Table on Middle East and Africa - Year-over-year growth 2023-2028 (%)
- Exhibits97: Chart on Japan - Market size and forecast 2023-2028 ($ million)
- Exhibits98: Data Table on Japan - Market size and forecast 2023-2028 ($ million)
- Exhibits99: Chart on Japan - Year-over-year growth 2023-2028 (%)
- Exhibits100: Data Table on Japan - Year-over-year growth 2023-2028 (%)
- Exhibits101: Chart on China - Market size and forecast 2023-2028 ($ million)
- Exhibits102: Data Table on China - Market size and forecast 2023-2028 ($ million)
- Exhibits103: Chart on China - Year-over-year growth 2023-2028 (%)
- Exhibits104: Data Table on China - Year-over-year growth 2023-2028 (%)
- Exhibits105: Chart on US - Market size and forecast 2023-2028 ($ million)
- Exhibits106: Data Table on US - Market size and forecast 2023-2028 ($ million)
- Exhibits107: Chart on US - Year-over-year growth 2023-2028 (%)
- Exhibits108: Data Table on US - Year-over-year growth 2023-2028 (%)
- Exhibits109: Chart on Indonesia - Market size and forecast 2023-2028 ($ million)
- Exhibits110: Data Table on Indonesia - Market size and forecast 2023-2028 ($ million)
- Exhibits111: Chart on Indonesia - Year-over-year growth 2023-2028 (%)
- Exhibits112: Data Table on Indonesia - Year-over-year growth 2023-2028 (%)
- Exhibits113: Chart on Germany - Market size and forecast 2023-2028 ($ million)
- Exhibits114: Data Table on Germany - Market size and forecast 2023-2028 ($ million)
- Exhibits115: Chart on Germany - Year-over-year growth 2023-2028 (%)
- Exhibits116: Data Table on Germany - Year-over-year growth 2023-2028 (%)
- Exhibits117: Market opportunity by geography ($ million)
- Exhibits118: Data Tables on Market opportunity by geography ($ million)
- Exhibits119: Impact of drivers and challenges in 2023 and 2028
- Exhibits120: Overview on criticality of inputs and factors of differentiation
- Exhibits121: Overview on factors of disruption
- Exhibits122: Impact of key risks on business
- Exhibits123: Companies covered
- Exhibits124: Company ranking index
- Exhibits125: Matrix on companies position and classification
- Exhibits126: Biocorp Co. Ltd. - Overview
- Exhibits127: Biocorp Co. Ltd. - Product / Service
- Exhibits128: Biocorp Co. Ltd. - Key offerings
- Exhibits129: SWOT
- Exhibits130: Champion Co., Ltd. - Overview
- Exhibits131: Champion Co., Ltd. - Product / Service
- Exhibits132: Champion Co., Ltd. - Key offerings
- Exhibits133: SWOT
- Exhibits134: Fucoidan USA.com - Overview
- Exhibits135: Fucoidan USA.com - Product / Service
- Exhibits136: Fucoidan USA.com - Key offerings
- Exhibits137: SWOT
- Exhibits138: Hi Q Marine Biotech International Ltd. - Overview
- Exhibits139: Hi Q Marine Biotech International Ltd. - Product / Service
- Exhibits140: Hi Q Marine Biotech International Ltd. - Key offerings
- Exhibits141: SWOT
- Exhibits142: Inaba Foods USA Inc. - Overview
- Exhibits143: Inaba Foods USA Inc. - Product / Service
- Exhibits144: Inaba Foods USA Inc. - Key offerings
- Exhibits145: SWOT
- Exhibits146: Kamerycah, Inc. - Overview
- Exhibits147: Kamerycah, Inc. - Product / Service
- Exhibits148: Kamerycah, Inc. - Key offerings
- Exhibits149: SWOT
- Exhibits150: KANEHIDE BIO Co.Ltd. - Overview
- Exhibits151: KANEHIDE BIO Co.Ltd. - Product / Service
- Exhibits152: KANEHIDE BIO Co.Ltd. - Key offerings
- Exhibits153: SWOT
- Exhibits154: Lemandou Chemicals - Overview
- Exhibits155: Lemandou Chemicals - Product / Service
- Exhibits156: Lemandou Chemicals - Key offerings
- Exhibits157: SWOT
- Exhibits158: Marinova Pty Ltd. - Overview
- Exhibits159: Marinova Pty Ltd. - Product / Service
- Exhibits160: Marinova Pty Ltd. - Key offerings
- Exhibits161: SWOT
- Exhibits162: Merck KGaA - Overview
- Exhibits163: Merck KGaA - Business segments
- Exhibits164: Merck KGaA - Key news
- Exhibits165: Merck KGaA - Key offerings
- Exhibits166: Merck KGaA - Segment focus
- Exhibits167: SWOT
- Exhibits168: SeaHerb Co., LTD. - Overview
- Exhibits169: SeaHerb Co., LTD. - Product / Service
- Exhibits170: SeaHerb Co., LTD. - Key offerings
- Exhibits171: SWOT
- Exhibits172: SUGOI HEALTH - Overview
- Exhibits173: SUGOI HEALTH - Product / Service
- Exhibits174: SUGOI HEALTH - Key offerings
- Exhibits175: SWOT
- Exhibits176: The Synergy Co. - Overview
- Exhibits177: The Synergy Co. - Product / Service
- Exhibits178: The Synergy Co. - Key offerings
- Exhibits179: SWOT
- Exhibits180: TOKAI BUSSAN CO., LTD. - Overview
- Exhibits181: TOKAI BUSSAN CO., LTD. - Product / Service
- Exhibits182: TOKAI BUSSAN CO., LTD. - Key offerings
- Exhibits183: SWOT
- Exhibits184: Vesta Nutra - Overview
- Exhibits185: Vesta Nutra - Product / Service
- Exhibits186: Vesta Nutra - Key offerings
- Exhibits187: SWOT
- Exhibits188: Inclusions checklist
- Exhibits189: Exclusions checklist
- Exhibits190: Currency conversion rates for US$
- Exhibits191: Research methodology
- Exhibits192: Information sources
- Exhibits193: Data validation
- Exhibits194: Validation techniques employed for market sizing
- Exhibits195: Data synthesis
- Exhibits196: 360 degree market analysis
- Exhibits197: List of abbreviations
The fucoidan market is forecasted to grow by USD 109.6 mn during 2023-2028, accelerating at a CAGR of 7.77% during the forecast period. The report on the fucoidan market provides a holistic analysis, market size and forecast, trends, growth drivers, and challenges, as well as vendor analysis covering around 25 vendors.
The report offers an up-to-date analysis regarding the current market scenario, the latest trends and drivers, and the overall market environment. The market is driven by growing health consciousness among consumers, growing demand for animal health products owing to rising disease outbreaks in livestock, and rising adoption of e-commerce.
Technavio's fucoidan market is segmented as below:
| Market Scope | |
|---|---|
| Base Year | 2024 |
| End Year | 2028 |
| Series Year | 2024-2028 |
| Growth Momentum | Accelerate |
| YOY 2024 | 7.57% |
| CAGR | 7.77% |
| Incremental Value | $109.6mn |
By Type
- Powder
- Capsule
- Others
By Application
- Pharmaceutical
- Dietary Supplements
- Cosmetics
By Geography
- APAC
- Europe
- North America
- South America
- Middle East and Africa
This study identifies the increasing demand for fucoidan in pharmaceutical industry as one of the prime reasons driving the fucoidan market growth during the next few years. Also, growing applications of fucoidan in cosmetics industry and increasing regulatory approvals for fucoidan extracts will lead to sizable demand in the market.
The report on the fucoidan market covers the following areas:
- Fucoidan market sizing
- Fucoidan market forecast
- Fucoidan market industry analysis
The robust vendor analysis is designed to help clients improve their market position, and in line with this, this report provides a detailed analysis of several leading fucoidan market vendors that include ABLY, Inc., Biocorp Co. Ltd., Biosynth Ltd., Champion Co., Ltd., Fucoidan USA.com, Hi Q Marine Biotech International Ltd., Hongo Co.,Ltd., Inaba Foods USA Inc., International Flavors and Fragrances Inc., Kamerycah, Inc., KANEHIDE BIO Co.Ltd., Lemandou Chemicals, Marinova Pty Ltd., Merck KGaA, SeaHerb Co., LTD., SUGOI HEALTH, The Synergy Co., TOKAI BUSSAN CO., LTD., and Vesta Nutra. Also, the fucoidan market analysis report includes information on upcoming trends and challenges that will influence market growth. This is to help companies strategize and leverage all forthcoming growth opportunities.
The study was conducted using an objective combination of primary and secondary information including inputs from key participants in the industry. The report contains a comprehensive market and vendor landscape in addition to an analysis of the key vendors.
The publisher presents a detailed picture of the market by the way of study, synthesis, and summation of data from multiple sources by an analysis of key parameters such as profit, pricing, competition, and promotions. It presents various market facets by identifying the key industry influencers. The data presented is comprehensive, reliable, and a result of extensive research - both primary and secondary. The market research reports provide a complete competitive landscape and an in-depth vendor selection methodology and analysis using qualitative and quantitative research to forecast the accurate market growth.
Table of Contents
1 Executive Summary
- 1.1 Market overview
- Executive Summary - Chart on Market Overview
- Executive Summary - Data Table on Market Overview
- Executive Summary - Chart on Global Market Characteristics
- Executive Summary - Chart on Market by Geography
- Executive Summary - Chart on Market Segmentation by Type
- Executive Summary - Chart on Market Segmentation by Application
- Executive Summary - Chart on Incremental Growth
- Executive Summary - Data Table on Incremental Growth
- Executive Summary - Chart on Company Market Positioning
2 Technavio Analysis
- 2.1 Analysis of price sensitivity, lifecycle, customer purchase basket, adoption rates, and purchase criteria
- Analysis of price sensitivity, lifecycle, customer purchase basket, adoption rates, and purchase criteria
- 2.2 Criticality of inputs and Factors of differentiation
- Overview on criticality of inputs and factors of differentiation
- 2.3 Factors of disruption
- Overview on factors of disruption
- 2.4 Impact of drivers and challenges
- Impact of drivers and challenges in 2023 and 2028
3 Market Landscape
- 3.1 Market ecosystem
- Parent Market
- Data Table on - Parent Market
- 3.2 Market characteristics
- Market characteristics analysis
- 3.3 Value chain analysis
- Value Chain Analysis
4 Market Sizing
- 4.1 Market definition
- Offerings of companies included in the market definition
- 4.2 Market segment analysis
- Market segments
- 4.3 Market size 2023
- 4.4 Market outlook: Forecast for 2023-2028
- Chart on Global - Market size and forecast 2023-2028 ($ million)
- Data Table on Global - Market size and forecast 2023-2028 ($ million)
- Chart on Global Market: Year-over-year growth 2023-2028 (%)
- Data Table on Global Market: Year-over-year growth 2023-2028 (%)
5 Historic Market Size
- 5.1 Global Fucoidan Market 2018 - 2022
- Historic Market Size - Data Table on Global Fucoidan Market 2018 - 2022 ($ million)
- 5.2 Type segment analysis 2018 - 2022
- Historic Market Size - Type Segment 2018 - 2022 ($ million)
- 5.3 Application segment analysis 2018 - 2022
- Historic Market Size - Application Segment 2018 - 2022 ($ million)
- 5.4 Geography segment analysis 2018 - 2022
- Historic Market Size - Geography Segment 2018 - 2022 ($ million)
- 5.5 Country segment analysis 2018 - 2022
- Historic Market Size - Country Segment 2018 - 2022 ($ million)
6 Five Forces Analysis
- 6.1 Five forces summary
- Five forces analysis - Comparison between 2023 and 2028
- 6.2 Bargaining power of buyers
- Bargaining power of buyers - Impact of key factors 2023 and 2028
- 6.3 Bargaining power of suppliers
- Bargaining power of suppliers - Impact of key factors in 2023 and 2028
- 6.4 Threat of new entrants
- Threat of new entrants - Impact of key factors in 2023 and 2028
- 6.5 Threat of substitutes
- Threat of substitutes - Impact of key factors in 2023 and 2028
- 6.6 Threat of rivalry
- Threat of rivalry - Impact of key factors in 2023 and 2028
- 6.7 Market condition
- Chart on Market condition - Five forces 2023 and 2028
7 Market Segmentation by Type
- 7.1 Market segments
- Chart on Type - Market share 2023-2028 (%)
- Data Table on Type - Market share 2023-2028 (%)
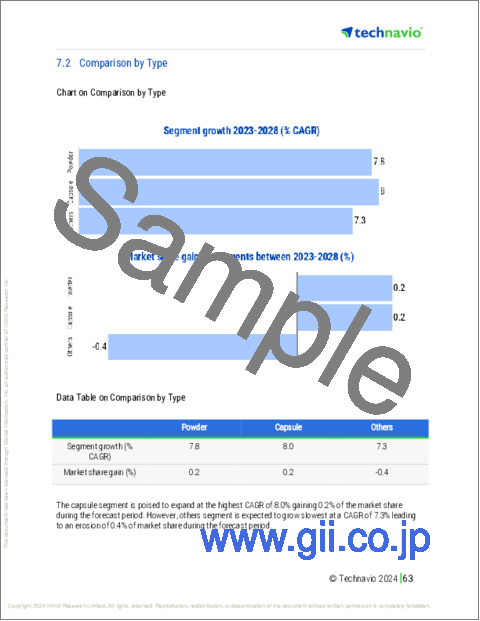
- 7.2 Comparison by Type
- Chart on Comparison by Type
- Data Table on Comparison by Type
- 7.3 Powder - Market size and forecast 2023-2028
- Chart on Powder - Market size and forecast 2023-2028 ($ million)
- Data Table on Powder - Market size and forecast 2023-2028 ($ million)
- Chart on Powder - Year-over-year growth 2023-2028 (%)
- Data Table on Powder - Year-over-year growth 2023-2028 (%)
- 7.4 Capsule - Market size and forecast 2023-2028
- Chart on Capsule - Market size and forecast 2023-2028 ($ million)
- Data Table on Capsule - Market size and forecast 2023-2028 ($ million)
- Chart on Capsule - Year-over-year growth 2023-2028 (%)
- Data Table on Capsule - Year-over-year growth 2023-2028 (%)
- 7.5 Others - Market size and forecast 2023-2028
- Chart on Others - Market size and forecast 2023-2028 ($ million)
- Data Table on Others - Market size and forecast 2023-2028 ($ million)
- Chart on Others - Year-over-year growth 2023-2028 (%)
- Data Table on Others - Year-over-year growth 2023-2028 (%)
- 7.6 Market opportunity by Type
- Market opportunity by Type ($ million)
- Data Table on Market opportunity by Type ($ million)
8 Market Segmentation by Application
- 8.1 Market segments
- Chart on Application - Market share 2023-2028 (%)
- Data Table on Application - Market share 2023-2028 (%)
- 8.2 Comparison by Application
- Chart on Comparison by Application
- Data Table on Comparison by Application
- 8.3 Pharmaceutical - Market size and forecast 2023-2028
- Chart on Pharmaceutical - Market size and forecast 2023-2028 ($ million)
- Data Table on Pharmaceutical - Market size and forecast 2023-2028 ($ million)
- Chart on Pharmaceutical - Year-over-year growth 2023-2028 (%)
- Data Table on Pharmaceutical - Year-over-year growth 2023-2028 (%)
- 8.4 Dietary Supplements - Market size and forecast 2023-2028
- Chart on Dietary Supplements - Market size and forecast 2023-2028 ($ million)
- Data Table on Dietary Supplements - Market size and forecast 2023-2028 ($ million)
- Chart on Dietary Supplements - Year-over-year growth 2023-2028 (%)
- Data Table on Dietary Supplements - Year-over-year growth 2023-2028 (%)
- 8.5 Cosmetics - Market size and forecast 2023-2028
- Chart on Cosmetics - Market size and forecast 2023-2028 ($ million)
- Data Table on Cosmetics - Market size and forecast 2023-2028 ($ million)
- Chart on Cosmetics - Year-over-year growth 2023-2028 (%)
- Data Table on Cosmetics - Year-over-year growth 2023-2028 (%)
- 8.6 Market opportunity by Application
- Market opportunity by Application ($ million)
- Data Table on Market opportunity by Application ($ million)
9 Customer Landscape
- 9.1 Customer landscape overview
- Analysis of price sensitivity, lifecycle, customer purchase basket, adoption rates, and purchase criteria
10 Geographic Landscape
- 10.1 Geographic segmentation
- Chart on Market share by geography 2023-2028 (%)
- Data Table on Market share by geography 2023-2028 (%)
- 10.2 Geographic comparison
- Chart on Geographic comparison
- Data Table on Geographic comparison
- 10.3 APAC - Market size and forecast 2023-2028
- Chart on APAC - Market size and forecast 2023-2028 ($ million)
- Data Table on APAC - Market size and forecast 2023-2028 ($ million)
- Chart on APAC - Year-over-year growth 2023-2028 (%)
- Data Table on APAC - Year-over-year growth 2023-2028 (%)
- 10.4 Europe - Market size and forecast 2023-2028
- Chart on Europe - Market size and forecast 2023-2028 ($ million)
- Data Table on Europe - Market size and forecast 2023-2028 ($ million)
- Chart on Europe - Year-over-year growth 2023-2028 (%)
- Data Table on Europe - Year-over-year growth 2023-2028 (%)
- 10.5 North America - Market size and forecast 2023-2028
- Chart on North America - Market size and forecast 2023-2028 ($ million)
- Data Table on North America - Market size and forecast 2023-2028 ($ million)
- Chart on North America - Year-over-year growth 2023-2028 (%)
- Data Table on North America - Year-over-year growth 2023-2028 (%)
- 10.6 South America - Market size and forecast 2023-2028
- Chart on South America - Market size and forecast 2023-2028 ($ million)
- Data Table on South America - Market size and forecast 2023-2028 ($ million)
- Chart on South America - Year-over-year growth 2023-2028 (%)
- Data Table on South America - Year-over-year growth 2023-2028 (%)
- 10.7 Middle East and Africa - Market size and forecast 2023-2028
- Chart on Middle East and Africa - Market size and forecast 2023-2028 ($ million)
- Data Table on Middle East and Africa - Market size and forecast 2023-2028 ($ million)
- Chart on Middle East and Africa - Year-over-year growth 2023-2028 (%)
- Data Table on Middle East and Africa - Year-over-year growth 2023-2028 (%)
- 10.8 Japan - Market size and forecast 2023-2028
- Chart on Japan - Market size and forecast 2023-2028 ($ million)
- Data Table on Japan - Market size and forecast 2023-2028 ($ million)
- Chart on Japan - Year-over-year growth 2023-2028 (%)
- Data Table on Japan - Year-over-year growth 2023-2028 (%)
- 10.9 China - Market size and forecast 2023-2028
- Chart on China - Market size and forecast 2023-2028 ($ million)
- Data Table on China - Market size and forecast 2023-2028 ($ million)
- Chart on China - Year-over-year growth 2023-2028 (%)
- Data Table on China - Year-over-year growth 2023-2028 (%)
- 10.10 US - Market size and forecast 2023-2028
- Chart on US - Market size and forecast 2023-2028 ($ million)
- Data Table on US - Market size and forecast 2023-2028 ($ million)
- Chart on US - Year-over-year growth 2023-2028 (%)
- Data Table on US - Year-over-year growth 2023-2028 (%)
- 10.11 Indonesia - Market size and forecast 2023-2028
- Chart on Indonesia - Market size and forecast 2023-2028 ($ million)
- Data Table on Indonesia - Market size and forecast 2023-2028 ($ million)
- Chart on Indonesia - Year-over-year growth 2023-2028 (%)
- Data Table on Indonesia - Year-over-year growth 2023-2028 (%)
- 10.12 Germany - Market size and forecast 2023-2028
- Chart on Germany - Market size and forecast 2023-2028 ($ million)
- Data Table on Germany - Market size and forecast 2023-2028 ($ million)
- Chart on Germany - Year-over-year growth 2023-2028 (%)
- Data Table on Germany - Year-over-year growth 2023-2028 (%)
- 10.13 Market opportunity by geography
- Market opportunity by geography ($ million)
- Data Tables on Market opportunity by geography ($ million)
11 Drivers, Challenges, and Opportunity/Restraints
- 11.1 Market drivers
- 11.2 Market challenges
- 11.3 Impact of drivers and challenges
- Impact of drivers and challenges in 2023 and 2028
- 11.4 Market opportunities/restraints
12 Competitive Landscape
- 12.1 Overview
- 12.2 Competitive Landscape
- Overview on criticality of inputs and factors of differentiation
- 12.3 Landscape disruption
- Overview on factors of disruption
- 12.4 Industry risks
- Impact of key risks on business
13 Competitive Analysis
- 13.1 Companies profiled
- Companies covered
- 13.2 Company ranking index
- Company ranking index
- 13.3 Market positioning of companies
- Matrix on companies position and classification
- 13.4 Biocorp Co. Ltd.
- Biocorp Co. Ltd. - Overview
- Biocorp Co. Ltd. - Product / Service
- Biocorp Co. Ltd. - Key offerings
- SWOT
- 13.5 Champion Co., Ltd.
- Champion Co., Ltd. - Overview
- Champion Co., Ltd. - Product / Service
- Champion Co., Ltd. - Key offerings
- SWOT
- 13.6 Fucoidan USA.com
- Fucoidan USA.com - Overview
- Fucoidan USA.com - Product / Service
- Fucoidan USA.com - Key offerings
- SWOT
- 13.7 Hi Q Marine Biotech International Ltd.
- Hi Q Marine Biotech International Ltd. - Overview
- Hi Q Marine Biotech International Ltd. - Product / Service
- Hi Q Marine Biotech International Ltd. - Key offerings
- SWOT
- 13.8 Inaba Foods USA Inc.
- Inaba Foods USA Inc. - Overview
- Inaba Foods USA Inc. - Product / Service
- Inaba Foods USA Inc. - Key offerings
- SWOT
- 13.9 Kamerycah, Inc.
- Kamerycah, Inc. - Overview
- Kamerycah, Inc. - Product / Service
- Kamerycah, Inc. - Key offerings
- SWOT
- 13.10 KANEHIDE BIO Co.Ltd.
- KANEHIDE BIO Co.Ltd. - Overview
- KANEHIDE BIO Co.Ltd. - Product / Service
- KANEHIDE BIO Co.Ltd. - Key offerings
- SWOT
- 13.11 Lemandou Chemicals
- Lemandou Chemicals - Overview
- Lemandou Chemicals - Product / Service
- Lemandou Chemicals - Key offerings
- SWOT
- 13.12 Marinova Pty Ltd.
- Marinova Pty Ltd. - Overview
- Marinova Pty Ltd. - Product / Service
- Marinova Pty Ltd. - Key offerings
- SWOT
- 13.13 Merck KGaA
- Merck KGaA - Overview
- Merck KGaA - Business segments
- Merck KGaA - Key news
- Merck KGaA - Key offerings
- Merck KGaA - Segment focus
- SWOT
- 13.14 SeaHerb Co., LTD.
- SeaHerb Co., LTD. - Overview
- SeaHerb Co., LTD. - Product / Service
- SeaHerb Co., LTD. - Key offerings
- SWOT
- 13.15 SUGOI HEALTH
- SUGOI HEALTH - Overview
- SUGOI HEALTH - Product / Service
- SUGOI HEALTH - Key offerings
- SWOT
- 13.16 The Synergy Co.
- The Synergy Co. - Overview
- The Synergy Co. - Product / Service
- The Synergy Co. - Key offerings
- SWOT
- 13.17 TOKAI BUSSAN CO., LTD.
- TOKAI BUSSAN CO., LTD. - Overview
- TOKAI BUSSAN CO., LTD. - Product / Service
- TOKAI BUSSAN CO., LTD. - Key offerings
- SWOT
- 13.18 Vesta Nutra
- Vesta Nutra - Overview
- Vesta Nutra - Product / Service
- Vesta Nutra - Key offerings
- SWOT
14 Appendix
- 14.1 Scope of the report
- 14.2 Inclusions and exclusions checklist
- Inclusions checklist
- Exclusions checklist
- 14.3 Currency conversion rates for US$
- Currency conversion rates for US$
- 14.4 Research methodology
- Research methodology
- 14.5 Data procurement
- Information sources
- 14.6 Data validation
- Data validation
- 14.7 Validation techniques employed for market sizing
- Validation techniques employed for market sizing
- 14.8 Data synthesis
- Data synthesis
- 14.9 360 degree market analysis
- 360 degree market analysis
- 14.10 List of abbreviations
- List of abbreviations
