|
|
市場調査レポート
商品コード
1763003
製品デザイン開発サービスの世界市場 2025-2029Global Product Design Development Services Market 2025-2029 |
||||||

|
|||||||
カスタマイズ可能
|
|||||||


| 製品デザイン開発サービスの世界市場 2025-2029 |
|
出版日: 2025年06月20日
発行: TechNavio
ページ情報: 英文 218 Pages
納期: 即納可能
|

全表示
- 概要
- 図表
- 目次
製品デザイン開発サービス市場は2024-2029年に74億9,420万米ドル、予測期間中のCAGRは10.3%で成長すると予測されます。
当レポートでは、製品デザイン開発サービス市場の全体的な分析、市場規模・予測、動向、成長促進要因、課題、約25のベンダーを網羅したベンダー分析などを掲載しています。
現在の市場シナリオ、最新動向と促進要因、市場環境全体に関する最新分析を提供しています。市場は、ヘルスケア技術の進歩、疾患の有病率の増加、医療機器に対する需要の増加によって牽引されています。
| 市場範囲 | |
|---|---|
| 基準年 | 2025 |
| 終了年 | 2029 |
| 予測期間 | 2025-2029 |
| 成長モメンタム | 加速 |
| 前年比 | 9.1% |
| CAGR | 10.3% |
| 増分額 | 74億9,420万米ドル |
本調査は、業界の主要参加者からのインプットを含め、一次情報と二次情報を客観的に組み合わせて実施しました。レポートには、主要企業の分析に加え、包括的な市場規模データ、地域別分析によるセグメント、ベンダー情勢が含まれています。レポートは過去データと予測データを掲載しています。
本調査では、ヘルスケア産業におけるデジタル化が、今後数年間の製品デザイン開発サービス市場の成長を促進する主要な理由の1つであると特定しています。また、研究開発への高額な支出やM&Aの増加は、市場の大きな需要につながるでしょう。
目次
第1章 エグゼクティブサマリー
- 市場概要
第2章 Technavio分析
- 価格・ライフサイクル・顧客購入バスケット・採用率・購入基準の分析
- インプットの重要性と差別化の要因
- 混乱の要因
- 促進要因と課題の影響
第3章 市場情勢
- 市場エコシステム
- 市場の特徴
- バリューチェーン分析
第4章 市場規模
- 市場の定義
- 市場セグメント分析
- 市場規模 2024
- 市場の見通し 2024-2029
第5章 市場規模実績
- 製品デザイン開発サービスの世界市場 2019-2023
- 用途別セグメント分析 2019-2023
- エンドユーザーセグメント分析 2019-2023
- サービスタイプセグメント分析 2019-2023
- 地域別セグメント分析 2019-2023
- 国別セグメント分析 2019-2023
第6章 定性分析
- AIの影響:製品デザイン開発サービスの世界市場
第7章 ファイブフォース分析
- ファイブフォースの要約
- 買い手の交渉力
- 供給企業の交渉力
- 新規参入業者の脅威
- 代替品の脅威
- 競争の脅威
- 市況
第8章 市場セグメンテーション:用途別
- 市場セグメント
- 比較:用途別
- 手術器具:市場規模と予測 2024-2029
- 診断機器:市場規模と予測 2024-2029
- 治療機器:市場規模と予測 2024-2029
- 臨床検査機器:市場規模と予測 2024-2029
- その他:市場規模と予測 2024-2029
- 市場機会:用途別
第9章 市場セグメンテーション:エンドユーザー別
- 市場セグメント
- 比較:エンドユーザー別
- 医療機器企業:市場規模と予測 2024-2029
- 製薬会社:市場規模と予測 2024-2029
- バイオテクノロジー企業:市場規模と予測 2024-2029
- 契約調査機関:市場規模と予測 2024-2029
- 市場機会:エンドユーザー別
第10章 市場セグメンテーション:サービスタイプ別
- 市場セグメント
- 比較:サービスタイプ別
- RSとCG:市場規模と予測 2024-2029
- コンセプトと要件の開発:市場規模と予測 2024-2029
- 詳細設計とプロセス開発:市場規模と予測 2024-2029
- 設計検証:市場規模と予測 2024-2029
- その他:市場規模と予測 2024-2029
- 市場機会:サービスタイプ別
第11章 顧客情勢
- 顧客情勢の概要
第12章 地域別情勢
- 地域別セグメンテーション
- 地域別比較
- アジア:市場規模と予測 2024-2029
- 北米:市場規模と予測 2024-2029
- 欧州:市場規模と予測 2024-2029
- 世界のその他の地域:市場規模と予測 2024-2029
- 米国:市場規模と予測 2024-2029
- 中国:市場規模と予測 2024-2029
- 日本:市場規模と予測 2024-2029
- インド:市場規模と予測 2024-2029
- ドイツ:市場規模と予測 2024-2029
- 韓国:市場規模と予測 2024-2029
- カナダ:市場規模と予測 2024-2029
- 英国:市場規模と予測 2024-2029
- オーストラリア:市場規模と予測 2024-2029
- ブラジル:市場規模と予測 2024-2029
- 市場機会:地域情勢別
第13章 促進要因・課題・機会・抑制要因
- 市場促進要因
- 市場の課題
- 促進要因と課題の影響
- 市場の機会・抑制要因
第14章 競合情勢
- 概要
- 競合情勢
- 混乱の状況
- 業界のリスク
第15章 競合分析
- 企業プロファイル
- 企業ランキング指数
- 企業の市場ポジショニング
- Aran Biomedical
- Biomerics LLC
- Cambridge Design Partnership Ltd.
- Celestica Inc.
- DeviceLab Inc.
- Flex Ltd.
- Freudenberg and Co. KG
- Integrated Computer Solutions Inc.
- Jabil Inc.
- Nordson Corp.
- Nuova Donatella
- Planet Innovation Holdings
- Plexus Corp.
- StarFish Product Engineering Inc.
- Veranex
第16章 付録
Exhibits:
- Exhibits1: Executive Summary - Chart on Market Overview
- Exhibits2: Executive Summary - Data Table on Market Overview
- Exhibits3: Executive Summary - Chart on Global Market Characteristics
- Exhibits4: Executive Summary - Chart on Market By Geographical Landscape
- Exhibits5: Executive Summary - Chart on Market Segmentation by Application
- Exhibits6: Executive Summary - Chart on Market Segmentation by End-user
- Exhibits7: Executive Summary - Chart on Market Segmentation by Service Type
- Exhibits8: Executive Summary - Chart on Incremental Growth
- Exhibits9: Executive Summary - Data Table on Incremental Growth
- Exhibits10: Executive Summary - Chart on Company Market Positioning
- Exhibits11: Analysis of price sensitivity, lifecycle, customer purchase basket, adoption rates, and purchase criteria
- Exhibits12: Overview on criticality of inputs and factors of differentiation
- Exhibits13: Overview on factors of disruption
- Exhibits14: Impact of drivers and challenges in 2024 and 2029
- Exhibits15: Parent Market
- Exhibits16: Data Table on - Parent Market
- Exhibits17: Market characteristics analysis
- Exhibits18: Value chain analysis
- Exhibits19: Offerings of companies included in the market definition
- Exhibits20: Market segments
- Exhibits21: Chart on Global - Market size and forecast 2024-2029 ($ million)
- Exhibits22: Data Table on Global - Market size and forecast 2024-2029 ($ million)
- Exhibits23: Chart on Global Market: Year-over-year growth 2024-2029 (%)
- Exhibits24: Data Table on Global Market: Year-over-year growth 2024-2029 (%)
- Exhibits25: Historic Market Size - Data Table on Global Product Design Development Services Market 2019 - 2023 ($ million)
- Exhibits26: Historic Market Size - Application Segment 2019 - 2023 ($ million)
- Exhibits27: Historic Market Size - End-user Segment 2019 - 2023 ($ million)
- Exhibits28: Historic Market Size - Service Type Segment 2019 - 2023 ($ million)
- Exhibits29: Historic Market Size - Geography Segment 2019 - 2023 ($ million)
- Exhibits30: Historic Market Size - Country Segment 2019 - 2023 ($ million)
- Exhibits31: Five forces analysis - Comparison between 2024 and 2029
- Exhibits32: Bargaining power of buyers - Impact of key factors 2024 and 2029
- Exhibits33: Bargaining power of suppliers - Impact of key factors in 2024 and 2029
- Exhibits34: Threat of new entrants - Impact of key factors in 2024 and 2029
- Exhibits35: Threat of substitutes - Impact of key factors in 2024 and 2029
- Exhibits36: Threat of rivalry - Impact of key factors in 2024 and 2029
- Exhibits37: Chart on Market condition - Five forces 2024 and 2029
- Exhibits38: Chart on Application - Market share 2024-2029 (%)
- Exhibits39: Data Table on Application - Market share 2024-2029 (%)
- Exhibits40: Chart on Comparison by Application
- Exhibits41: Data Table on Comparison by Application
- Exhibits42: Chart on Surgical instruments - Market size and forecast 2024-2029 ($ million)
- Exhibits43: Data Table on Surgical instruments - Market size and forecast 2024-2029 ($ million)
- Exhibits44: Chart on Surgical instruments - Year-over-year growth 2024-2029 (%)
- Exhibits45: Data Table on Surgical instruments - Year-over-year growth 2024-2029 (%)
- Exhibits46: Chart on Diagnostic equipment - Market size and forecast 2024-2029 ($ million)
- Exhibits47: Data Table on Diagnostic equipment - Market size and forecast 2024-2029 ($ million)
- Exhibits48: Chart on Diagnostic equipment - Year-over-year growth 2024-2029 (%)
- Exhibits49: Data Table on Diagnostic equipment - Year-over-year growth 2024-2029 (%)
- Exhibits50: Chart on Therapeutic equipment - Market size and forecast 2024-2029 ($ million)
- Exhibits51: Data Table on Therapeutic equipment - Market size and forecast 2024-2029 ($ million)
- Exhibits52: Chart on Therapeutic equipment - Year-over-year growth 2024-2029 (%)
- Exhibits53: Data Table on Therapeutic equipment - Year-over-year growth 2024-2029 (%)
- Exhibits54: Chart on Clinical laboratory equipment - Market size and forecast 2024-2029 ($ million)
- Exhibits55: Data Table on Clinical laboratory equipment - Market size and forecast 2024-2029 ($ million)
- Exhibits56: Chart on Clinical laboratory equipment - Year-over-year growth 2024-2029 (%)
- Exhibits57: Data Table on Clinical laboratory equipment - Year-over-year growth 2024-2029 (%)
- Exhibits58: Chart on Others - Market size and forecast 2024-2029 ($ million)
- Exhibits59: Data Table on Others - Market size and forecast 2024-2029 ($ million)
- Exhibits60: Chart on Others - Year-over-year growth 2024-2029 (%)
- Exhibits61: Data Table on Others - Year-over-year growth 2024-2029 (%)
- Exhibits62: Market opportunity by Application ($ million)
- Exhibits63: Data Table on Market opportunity by Application ($ million)
- Exhibits64: Chart on End-user - Market share 2024-2029 (%)
- Exhibits65: Data Table on End-user - Market share 2024-2029 (%)
- Exhibits66: Chart on Comparison by End-user
- Exhibits67: Data Table on Comparison by End-user
- Exhibits68: Chart on Medical device companies - Market size and forecast 2024-2029 ($ million)
- Exhibits69: Data Table on Medical device companies - Market size and forecast 2024-2029 ($ million)
- Exhibits70: Chart on Medical device companies - Year-over-year growth 2024-2029 (%)
- Exhibits71: Data Table on Medical device companies - Year-over-year growth 2024-2029 (%)
- Exhibits72: Chart on Pharmaceutical companies - Market size and forecast 2024-2029 ($ million)
- Exhibits73: Data Table on Pharmaceutical companies - Market size and forecast 2024-2029 ($ million)
- Exhibits74: Chart on Pharmaceutical companies - Year-over-year growth 2024-2029 (%)
- Exhibits75: Data Table on Pharmaceutical companies - Year-over-year growth 2024-2029 (%)
- Exhibits76: Chart on Biotechnology companies - Market size and forecast 2024-2029 ($ million)
- Exhibits77: Data Table on Biotechnology companies - Market size and forecast 2024-2029 ($ million)
- Exhibits78: Chart on Biotechnology companies - Year-over-year growth 2024-2029 (%)
- Exhibits79: Data Table on Biotechnology companies - Year-over-year growth 2024-2029 (%)
- Exhibits80: Chart on Contract research organizations - Market size and forecast 2024-2029 ($ million)
- Exhibits81: Data Table on Contract research organizations - Market size and forecast 2024-2029 ($ million)
- Exhibits82: Chart on Contract research organizations - Year-over-year growth 2024-2029 (%)
- Exhibits83: Data Table on Contract research organizations - Year-over-year growth 2024-2029 (%)
- Exhibits84: Market opportunity by End-user ($ million)
- Exhibits85: Data Table on Market opportunity by End-user ($ million)
- Exhibits86: Chart on Service Type - Market share 2024-2029 (%)
- Exhibits87: Data Table on Service Type - Market share 2024-2029 (%)
- Exhibits88: Chart on Comparison by Service Type
- Exhibits89: Data Table on Comparison by Service Type
- Exhibits90: Chart on RS and CG - Market size and forecast 2024-2029 ($ million)
- Exhibits91: Data Table on RS and CG - Market size and forecast 2024-2029 ($ million)
- Exhibits92: Chart on RS and CG - Year-over-year growth 2024-2029 (%)
- Exhibits93: Data Table on RS and CG - Year-over-year growth 2024-2029 (%)
- Exhibits94: Chart on Concept and requirements development - Market size and forecast 2024-2029 ($ million)
- Exhibits95: Data Table on Concept and requirements development - Market size and forecast 2024-2029 ($ million)
- Exhibits96: Chart on Concept and requirements development - Year-over-year growth 2024-2029 (%)
- Exhibits97: Data Table on Concept and requirements development - Year-over-year growth 2024-2029 (%)
- Exhibits98: Chart on Detailed design and process development - Market size and forecast 2024-2029 ($ million)
- Exhibits99: Data Table on Detailed design and process development - Market size and forecast 2024-2029 ($ million)
- Exhibits100: Chart on Detailed design and process development - Year-over-year growth 2024-2029 (%)
- Exhibits101: Data Table on Detailed design and process development - Year-over-year growth 2024-2029 (%)
- Exhibits102: Chart on Design verification - Market size and forecast 2024-2029 ($ million)
- Exhibits103: Data Table on Design verification - Market size and forecast 2024-2029 ($ million)
- Exhibits104: Chart on Design verification - Year-over-year growth 2024-2029 (%)
- Exhibits105: Data Table on Design verification - Year-over-year growth 2024-2029 (%)
- Exhibits106: Chart on Others - Market size and forecast 2024-2029 ($ million)
- Exhibits107: Data Table on Others - Market size and forecast 2024-2029 ($ million)
- Exhibits108: Chart on Others - Year-over-year growth 2024-2029 (%)
- Exhibits109: Data Table on Others - Year-over-year growth 2024-2029 (%)
- Exhibits110: Market opportunity by Service Type ($ million)
- Exhibits111: Data Table on Market opportunity by Service Type ($ million)
- Exhibits112: Analysis of price sensitivity, lifecycle, customer purchase basket, adoption rates, and purchase criteria
- Exhibits113: Chart on Market share By Geographical Landscape 2024-2029 (%)
- Exhibits114: Data Table on Market share By Geographical Landscape 2024-2029 (%)
- Exhibits115: Chart on Geographic comparison
- Exhibits116: Data Table on Geographic comparison
- Exhibits117: Chart on Asia - Market size and forecast 2024-2029 ($ million)
- Exhibits118: Data Table on Asia - Market size and forecast 2024-2029 ($ million)
- Exhibits119: Chart on Asia - Year-over-year growth 2024-2029 (%)
- Exhibits120: Data Table on Asia - Year-over-year growth 2024-2029 (%)
- Exhibits121: Chart on North America - Market size and forecast 2024-2029 ($ million)
- Exhibits122: Data Table on North America - Market size and forecast 2024-2029 ($ million)
- Exhibits123: Chart on North America - Year-over-year growth 2024-2029 (%)
- Exhibits124: Data Table on North America - Year-over-year growth 2024-2029 (%)
- Exhibits125: Chart on Europe - Market size and forecast 2024-2029 ($ million)
- Exhibits126: Data Table on Europe - Market size and forecast 2024-2029 ($ million)
- Exhibits127: Chart on Europe - Year-over-year growth 2024-2029 (%)
- Exhibits128: Data Table on Europe - Year-over-year growth 2024-2029 (%)
- Exhibits129: Chart on Rest of World (ROW) - Market size and forecast 2024-2029 ($ million)
- Exhibits130: Data Table on Rest of World (ROW) - Market size and forecast 2024-2029 ($ million)
- Exhibits131: Chart on Rest of World (ROW) - Year-over-year growth 2024-2029 (%)
- Exhibits132: Data Table on Rest of World (ROW) - Year-over-year growth 2024-2029 (%)
- Exhibits133: Chart on US - Market size and forecast 2024-2029 ($ million)
- Exhibits134: Data Table on US - Market size and forecast 2024-2029 ($ million)
- Exhibits135: Chart on US - Year-over-year growth 2024-2029 (%)
- Exhibits136: Data Table on US - Year-over-year growth 2024-2029 (%)
- Exhibits137: Chart on China - Market size and forecast 2024-2029 ($ million)
- Exhibits138: Data Table on China - Market size and forecast 2024-2029 ($ million)
- Exhibits139: Chart on China - Year-over-year growth 2024-2029 (%)
- Exhibits140: Data Table on China - Year-over-year growth 2024-2029 (%)
- Exhibits141: Chart on Japan - Market size and forecast 2024-2029 ($ million)
- Exhibits142: Data Table on Japan - Market size and forecast 2024-2029 ($ million)
- Exhibits143: Chart on Japan - Year-over-year growth 2024-2029 (%)
- Exhibits144: Data Table on Japan - Year-over-year growth 2024-2029 (%)
- Exhibits145: Chart on India - Market size and forecast 2024-2029 ($ million)
- Exhibits146: Data Table on India - Market size and forecast 2024-2029 ($ million)
- Exhibits147: Chart on India - Year-over-year growth 2024-2029 (%)
- Exhibits148: Data Table on India - Year-over-year growth 2024-2029 (%)
- Exhibits149: Chart on Germany - Market size and forecast 2024-2029 ($ million)
- Exhibits150: Data Table on Germany - Market size and forecast 2024-2029 ($ million)
- Exhibits151: Chart on Germany - Year-over-year growth 2024-2029 (%)
- Exhibits152: Data Table on Germany - Year-over-year growth 2024-2029 (%)
- Exhibits153: Chart on South Korea - Market size and forecast 2024-2029 ($ million)
- Exhibits154: Data Table on South Korea - Market size and forecast 2024-2029 ($ million)
- Exhibits155: Chart on South Korea - Year-over-year growth 2024-2029 (%)
- Exhibits156: Data Table on South Korea - Year-over-year growth 2024-2029 (%)
- Exhibits157: Chart on Canada - Market size and forecast 2024-2029 ($ million)
- Exhibits158: Data Table on Canada - Market size and forecast 2024-2029 ($ million)
- Exhibits159: Chart on Canada - Year-over-year growth 2024-2029 (%)
- Exhibits160: Data Table on Canada - Year-over-year growth 2024-2029 (%)
- Exhibits161: Chart on UK - Market size and forecast 2024-2029 ($ million)
- Exhibits162: Data Table on UK - Market size and forecast 2024-2029 ($ million)
- Exhibits163: Chart on UK - Year-over-year growth 2024-2029 (%)
- Exhibits164: Data Table on UK - Year-over-year growth 2024-2029 (%)
- Exhibits165: Chart on Australia - Market size and forecast 2024-2029 ($ million)
- Exhibits166: Data Table on Australia - Market size and forecast 2024-2029 ($ million)
- Exhibits167: Chart on Australia - Year-over-year growth 2024-2029 (%)
- Exhibits168: Data Table on Australia - Year-over-year growth 2024-2029 (%)
- Exhibits169: Chart on Brazil - Market size and forecast 2024-2029 ($ million)
- Exhibits170: Data Table on Brazil - Market size and forecast 2024-2029 ($ million)
- Exhibits171: Chart on Brazil - Year-over-year growth 2024-2029 (%)
- Exhibits172: Data Table on Brazil - Year-over-year growth 2024-2029 (%)
- Exhibits173: Market opportunity By Geographical Landscape ($ million)
- Exhibits174: Data Tables on Market opportunity By Geographical Landscape ($ million)
- Exhibits175: Impact of drivers and challenges in 2024 and 2029
- Exhibits176: Overview on criticality of inputs and factors of differentiation
- Exhibits177: Overview on factors of disruption
- Exhibits178: Impact of key risks on business
- Exhibits179: Companies covered
- Exhibits180: Company ranking index
- Exhibits181: Matrix on companies position and classification
- Exhibits182: Aran Biomedical - Overview
- Exhibits183: Aran Biomedical - Product / Service
- Exhibits184: Aran Biomedical - Key offerings
- Exhibits185: SWOT
- Exhibits186: Biomerics LLC - Overview
- Exhibits187: Biomerics LLC - Product / Service
- Exhibits188: Biomerics LLC - Key offerings
- Exhibits189: SWOT
- Exhibits190: Cambridge Design Partnership Ltd. - Overview
- Exhibits191: Cambridge Design Partnership Ltd. - Product / Service
- Exhibits192: Cambridge Design Partnership Ltd. - Key offerings
- Exhibits193: SWOT
- Exhibits194: Celestica Inc. - Overview
- Exhibits195: Celestica Inc. - Business segments
- Exhibits196: Celestica Inc. - Key offerings
- Exhibits197: Celestica Inc. - Segment focus
- Exhibits198: SWOT
- Exhibits199: DeviceLab Inc. - Overview
- Exhibits200: DeviceLab Inc. - Product / Service
- Exhibits201: DeviceLab Inc. - Key offerings
- Exhibits202: SWOT
- Exhibits203: Flex Ltd. - Overview
- Exhibits204: Flex Ltd. - Business segments
- Exhibits205: Flex Ltd. - Key offerings
- Exhibits206: Flex Ltd. - Segment focus
- Exhibits207: SWOT
- Exhibits208: Freudenberg and Co. KG - Overview
- Exhibits209: Freudenberg and Co. KG - Product / Service
- Exhibits210: Freudenberg and Co. KG - Key news
- Exhibits211: Freudenberg and Co. KG - Key offerings
- Exhibits212: SWOT
- Exhibits213: Integrated Computer Solutions Inc. - Overview
- Exhibits214: Integrated Computer Solutions Inc. - Product / Service
- Exhibits215: Integrated Computer Solutions Inc. - Key offerings
- Exhibits216: SWOT
- Exhibits217: Jabil Inc. - Overview
- Exhibits218: Jabil Inc. - Business segments
- Exhibits219: Jabil Inc. - Key offerings
- Exhibits220: Jabil Inc. - Segment focus
- Exhibits221: SWOT
- Exhibits222: Nordson Corp. - Overview
- Exhibits223: Nordson Corp. - Business segments
- Exhibits224: Nordson Corp. - Key news
- Exhibits225: Nordson Corp. - Key offerings
- Exhibits226: Nordson Corp. - Segment focus
- Exhibits227: SWOT
- Exhibits228: Nuova Donatella - Overview
- Exhibits229: Nuova Donatella - Product / Service
- Exhibits230: Nuova Donatella - Key offerings
- Exhibits231: SWOT
- Exhibits232: Planet Innovation Holdings - Overview
- Exhibits233: Planet Innovation Holdings - Product / Service
- Exhibits234: Planet Innovation Holdings - Key offerings
- Exhibits235: SWOT
- Exhibits236: Plexus Corp. - Overview
- Exhibits237: Plexus Corp. - Business segments
- Exhibits238: Plexus Corp. - Key offerings
- Exhibits239: Plexus Corp. - Segment focus
- Exhibits240: SWOT
- Exhibits241: StarFish Product Engineering Inc. - Overview
- Exhibits242: StarFish Product Engineering Inc. - Product / Service
- Exhibits243: StarFish Product Engineering Inc. - Key offerings
- Exhibits244: SWOT
- Exhibits245: Veranex - Overview
- Exhibits246: Veranex - Product / Service
- Exhibits247: Veranex - Key offerings
- Exhibits248: SWOT
- Exhibits249: Inclusions checklist
- Exhibits250: Exclusions checklist
- Exhibits251: Currency conversion rates for US$
- Exhibits252: Research methodology
- Exhibits253: Information sources
- Exhibits254: Data validation
- Exhibits255: Validation techniques employed for market sizing
- Exhibits256: Data synthesis
- Exhibits257: 360 degree market analysis
- Exhibits258: List of abbreviations
The product design development services market is forecasted to grow by USD 7,494.2 mn during 2024-2029, accelerating at a CAGR of 10.3% during the forecast period. The report on the product design development services market provides a holistic analysis, market size and forecast, trends, growth drivers, and challenges, as well as vendor analysis covering around 25 vendors.
The report offers an up-to-date analysis regarding the current market scenario, the latest trends and drivers, and the overall market environment. The market is driven by advancements in healthcare technology, increasing prevalence of diseases, and increasing demand for medical devices.
| Market Scope | |
|---|---|
| Base Year | 2025 |
| End Year | 2029 |
| Series Year | 2025-2029 |
| Growth Momentum | Accelerate |
| YOY 2025 | 9.1% |
| CAGR | 10.3% |
| Incremental Value | $7,494.2 mn |
The study was conducted using an objective combination of primary and secondary information including inputs from key participants in the industry. The report contains a comprehensive market size data, segment with regional analysis and vendor landscape in addition to an analysis of the key companies. Reports have historic and forecast data.
Technavio's product design development services market is segmented as below:
By Application
- Surgical instruments
- Diagnostic equipment
- Therapeutic equipment
- Clinical laboratory equipment
- Others
By End-user
- Medical device companies
- Pharmaceutical companies
- Biotechnology companies
- Contract research organizations
By Service Type
- RS and CG
- Concept and requirements development
- Detailed design and process development
- Design verification
- Others
By Geographical Landscape
- Asia
- North America
- Europe
- Rest of World (ROW)
This study identifies the digitalization in healthcare industry as one of the prime reasons driving the product design development services market growth during the next few years. Also, high spending on research and development and increasing mergers and acquisitions will lead to sizable demand in the market.
The report on the product design development services market covers the following areas:
- Product Design Development Services Market sizing
- Product Design Development Services Market forecast
- Product Design Development Services Market industry analysis
The robust vendor analysis is designed to help clients improve their market position, and in line with this, this report provides a detailed analysis of several leading product design development services market vendors that include Aran Biomedical, Biomerics LLC, Cambridge Design Partnership Ltd., Celestica Inc., Delve, DeviceLab Inc., Flex Ltd., Freudenberg and Co. KG, IndiaCADworks, Integrated Computer Solutions Inc., Jabil Inc., KKR BOSE DESIGN SERVICES Pvt. Ltd., Nordson Corp., Nuova Donatella, Planet Innovation Holdings, Plexus Corp., RA Global Tech Solutions LLP, StarFish Product Engineering Inc., Steripack Group Ltd., and Veranex. Also, the product design development services market analysis report includes information on upcoming trends and challenges that will influence market growth. This is to help companies strategize and leverage all forthcoming growth opportunities.
The publisher presents a detailed picture of the market by the way of study, synthesis, and summation of data from multiple sources by an analysis of key parameters such as profit, pricing, competition, and promotions. It presents various market facets by identifying the key industry influencers. The data presented is comprehensive, reliable, and a result of extensive primary and secondary research. The market research reports provide a complete competitive landscape and an in-depth vendor selection methodology and analysis using qualitative and quantitative research to forecast accurate market growth.
Table of Contents
1 Executive Summary
- 1.1 Market overview
- Executive Summary - Chart on Market Overview
- Executive Summary - Data Table on Market Overview
- Executive Summary - Chart on Global Market Characteristics
- Executive Summary - Chart on Market By Geographical Landscape
- Executive Summary - Chart on Market Segmentation by Application
- Executive Summary - Chart on Market Segmentation by End-user
- Executive Summary - Chart on Market Segmentation by Service Type
- Executive Summary - Chart on Incremental Growth
- Executive Summary - Data Table on Incremental Growth
- Executive Summary - Chart on Company Market Positioning
2 Technavio Analysis
- 2.1 Analysis of price sensitivity, lifecycle, customer purchase basket, adoption rates, and purchase criteria
- Analysis of price sensitivity, lifecycle, customer purchase basket, adoption rates, and purchase criteria
- 2.2 Criticality of inputs and Factors of differentiation
- Overview on criticality of inputs and factors of differentiation
- 2.3 Factors of disruption
- Overview on factors of disruption
- 2.4 Impact of drivers and challenges
- Impact of drivers and challenges in 2024 and 2029
3 Market Landscape
- 3.1 Market ecosystem
- Parent Market
- Data Table on - Parent Market
- 3.2 Market characteristics
- Market characteristics analysis
- 3.3 Value chain analysis
- Value chain analysis
4 Market Sizing
- 4.1 Market definition
- Offerings of companies included in the market definition
- 4.2 Market segment analysis
- Market segments
- 4.3 Market size 2024
- 4.4 Market outlook: Forecast for 2024-2029
- Chart on Global - Market size and forecast 2024-2029 ($ million)
- Data Table on Global - Market size and forecast 2024-2029 ($ million)
- Chart on Global Market: Year-over-year growth 2024-2029 (%)
- Data Table on Global Market: Year-over-year growth 2024-2029 (%)
5 Historic Market Size
- 5.1 Global Product Design Development Services Market 2019 - 2023
- Historic Market Size - Data Table on Global Product Design Development Services Market 2019 - 2023 ($ million)
- 5.2 Application segment analysis 2019 - 2023
- Historic Market Size - Application Segment 2019 - 2023 ($ million)
- 5.3 End-user segment analysis 2019 - 2023
- Historic Market Size - End-user Segment 2019 - 2023 ($ million)
- 5.4 Service Type segment analysis 2019 - 2023
- Historic Market Size - Service Type Segment 2019 - 2023 ($ million)
- 5.5 Geography segment analysis 2019 - 2023
- Historic Market Size - Geography Segment 2019 - 2023 ($ million)
- 5.6 Country segment analysis 2019 - 2023
- Historic Market Size - Country Segment 2019 - 2023 ($ million)
6 Qualitative Analysis
- 6.1 The AI impact on global product design development services market
7 Five Forces Analysis
- 7.1 Five forces summary
- Five forces analysis - Comparison between 2024 and 2029
- 7.2 Bargaining power of buyers
- Bargaining power of buyers - Impact of key factors 2024 and 2029
- 7.3 Bargaining power of suppliers
- Bargaining power of suppliers - Impact of key factors in 2024 and 2029
- 7.4 Threat of new entrants
- Threat of new entrants - Impact of key factors in 2024 and 2029
- 7.5 Threat of substitutes
- Threat of substitutes - Impact of key factors in 2024 and 2029
- 7.6 Threat of rivalry
- Threat of rivalry - Impact of key factors in 2024 and 2029
- 7.7 Market condition
- Chart on Market condition - Five forces 2024 and 2029
8 Market Segmentation by Application
- 8.1 Market segments
- Chart on Application - Market share 2024-2029 (%)
- Data Table on Application - Market share 2024-2029 (%)
- 8.2 Comparison by Application
- Chart on Comparison by Application
- Data Table on Comparison by Application
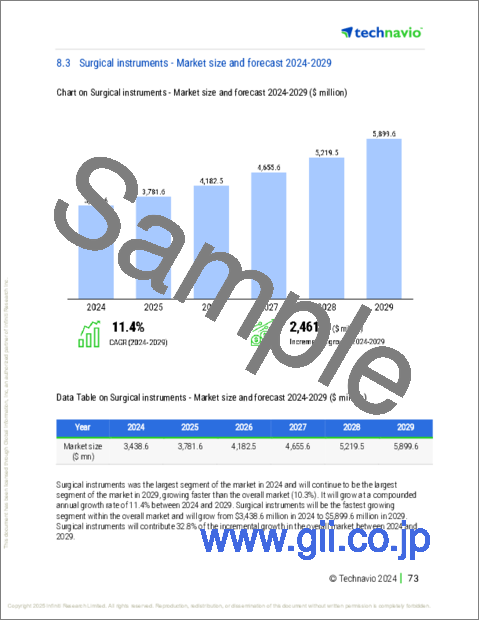
- 8.3 Surgical instruments - Market size and forecast 2024-2029
- Chart on Surgical instruments - Market size and forecast 2024-2029 ($ million)
- Data Table on Surgical instruments - Market size and forecast 2024-2029 ($ million)
- Chart on Surgical instruments - Year-over-year growth 2024-2029 (%)
- Data Table on Surgical instruments - Year-over-year growth 2024-2029 (%)
- 8.4 Diagnostic equipment - Market size and forecast 2024-2029
- Chart on Diagnostic equipment - Market size and forecast 2024-2029 ($ million)
- Data Table on Diagnostic equipment - Market size and forecast 2024-2029 ($ million)
- Chart on Diagnostic equipment - Year-over-year growth 2024-2029 (%)
- Data Table on Diagnostic equipment - Year-over-year growth 2024-2029 (%)
- 8.5 Therapeutic equipment - Market size and forecast 2024-2029
- Chart on Therapeutic equipment - Market size and forecast 2024-2029 ($ million)
- Data Table on Therapeutic equipment - Market size and forecast 2024-2029 ($ million)
- Chart on Therapeutic equipment - Year-over-year growth 2024-2029 (%)
- Data Table on Therapeutic equipment - Year-over-year growth 2024-2029 (%)
- 8.6 Clinical laboratory equipment - Market size and forecast 2024-2029
- Chart on Clinical laboratory equipment - Market size and forecast 2024-2029 ($ million)
- Data Table on Clinical laboratory equipment - Market size and forecast 2024-2029 ($ million)
- Chart on Clinical laboratory equipment - Year-over-year growth 2024-2029 (%)
- Data Table on Clinical laboratory equipment - Year-over-year growth 2024-2029 (%)
- 8.7 Others - Market size and forecast 2024-2029
- Chart on Others - Market size and forecast 2024-2029 ($ million)
- Data Table on Others - Market size and forecast 2024-2029 ($ million)
- Chart on Others - Year-over-year growth 2024-2029 (%)
- Data Table on Others - Year-over-year growth 2024-2029 (%)
- 8.8 Market opportunity by Application
- Market opportunity by Application ($ million)
- Data Table on Market opportunity by Application ($ million)
9 Market Segmentation by End-user
- 9.1 Market segments
- Chart on End-user - Market share 2024-2029 (%)
- Data Table on End-user - Market share 2024-2029 (%)
- 9.2 Comparison by End-user
- Chart on Comparison by End-user
- Data Table on Comparison by End-user
- 9.3 Medical device companies - Market size and forecast 2024-2029
- Chart on Medical device companies - Market size and forecast 2024-2029 ($ million)
- Data Table on Medical device companies - Market size and forecast 2024-2029 ($ million)
- Chart on Medical device companies - Year-over-year growth 2024-2029 (%)
- Data Table on Medical device companies - Year-over-year growth 2024-2029 (%)
- 9.4 Pharmaceutical companies - Market size and forecast 2024-2029
- Chart on Pharmaceutical companies - Market size and forecast 2024-2029 ($ million)
- Data Table on Pharmaceutical companies - Market size and forecast 2024-2029 ($ million)
- Chart on Pharmaceutical companies - Year-over-year growth 2024-2029 (%)
- Data Table on Pharmaceutical companies - Year-over-year growth 2024-2029 (%)
- 9.5 Biotechnology companies - Market size and forecast 2024-2029
- Chart on Biotechnology companies - Market size and forecast 2024-2029 ($ million)
- Data Table on Biotechnology companies - Market size and forecast 2024-2029 ($ million)
- Chart on Biotechnology companies - Year-over-year growth 2024-2029 (%)
- Data Table on Biotechnology companies - Year-over-year growth 2024-2029 (%)
- 9.6 Contract research organizations - Market size and forecast 2024-2029
- Chart on Contract research organizations - Market size and forecast 2024-2029 ($ million)
- Data Table on Contract research organizations - Market size and forecast 2024-2029 ($ million)
- Chart on Contract research organizations - Year-over-year growth 2024-2029 (%)
- Data Table on Contract research organizations - Year-over-year growth 2024-2029 (%)
- 9.7 Market opportunity by End-user
- Market opportunity by End-user ($ million)
- Data Table on Market opportunity by End-user ($ million)
10 Market Segmentation by Service Type
- 10.1 Market segments
- Chart on Service Type - Market share 2024-2029 (%)
- Data Table on Service Type - Market share 2024-2029 (%)
- 10.2 Comparison by Service Type
- Chart on Comparison by Service Type
- Data Table on Comparison by Service Type
- 10.3 RS and CG - Market size and forecast 2024-2029
- Chart on RS and CG - Market size and forecast 2024-2029 ($ million)
- Data Table on RS and CG - Market size and forecast 2024-2029 ($ million)
- Chart on RS and CG - Year-over-year growth 2024-2029 (%)
- Data Table on RS and CG - Year-over-year growth 2024-2029 (%)
- 10.4 Concept and requirements development - Market size and forecast 2024-2029
- Chart on Concept and requirements development - Market size and forecast 2024-2029 ($ million)
- Data Table on Concept and requirements development - Market size and forecast 2024-2029 ($ million)
- Chart on Concept and requirements development - Year-over-year growth 2024-2029 (%)
- Data Table on Concept and requirements development - Year-over-year growth 2024-2029 (%)
- 10.5 Detailed design and process development - Market size and forecast 2024-2029
- Chart on Detailed design and process development - Market size and forecast 2024-2029 ($ million)
- Data Table on Detailed design and process development - Market size and forecast 2024-2029 ($ million)
- Chart on Detailed design and process development - Year-over-year growth 2024-2029 (%)
- Data Table on Detailed design and process development - Year-over-year growth 2024-2029 (%)
- 10.6 Design verification - Market size and forecast 2024-2029
- Chart on Design verification - Market size and forecast 2024-2029 ($ million)
- Data Table on Design verification - Market size and forecast 2024-2029 ($ million)
- Chart on Design verification - Year-over-year growth 2024-2029 (%)
- Data Table on Design verification - Year-over-year growth 2024-2029 (%)
- 10.7 Others - Market size and forecast 2024-2029
- Chart on Others - Market size and forecast 2024-2029 ($ million)
- Data Table on Others - Market size and forecast 2024-2029 ($ million)
- Chart on Others - Year-over-year growth 2024-2029 (%)
- Data Table on Others - Year-over-year growth 2024-2029 (%)
- 10.8 Market opportunity by Service Type
- Market opportunity by Service Type ($ million)
- Data Table on Market opportunity by Service Type ($ million)
11 Customer Landscape
- 11.1 Customer landscape overview
- Analysis of price sensitivity, lifecycle, customer purchase basket, adoption rates, and purchase criteria
12 Geographic Landscape
- 12.1 Geographic segmentation
- Chart on Market share By Geographical Landscape 2024-2029 (%)
- Data Table on Market share By Geographical Landscape 2024-2029 (%)
- 12.2 Geographic comparison
- Chart on Geographic comparison
- Data Table on Geographic comparison
- 12.3 Asia - Market size and forecast 2024-2029
- Chart on Asia - Market size and forecast 2024-2029 ($ million)
- Data Table on Asia - Market size and forecast 2024-2029 ($ million)
- Chart on Asia - Year-over-year growth 2024-2029 (%)
- Data Table on Asia - Year-over-year growth 2024-2029 (%)
- 12.4 North America - Market size and forecast 2024-2029
- Chart on North America - Market size and forecast 2024-2029 ($ million)
- Data Table on North America - Market size and forecast 2024-2029 ($ million)
- Chart on North America - Year-over-year growth 2024-2029 (%)
- Data Table on North America - Year-over-year growth 2024-2029 (%)
- 12.5 Europe - Market size and forecast 2024-2029
- Chart on Europe - Market size and forecast 2024-2029 ($ million)
- Data Table on Europe - Market size and forecast 2024-2029 ($ million)
- Chart on Europe - Year-over-year growth 2024-2029 (%)
- Data Table on Europe - Year-over-year growth 2024-2029 (%)
- 12.6 Rest of World (ROW) - Market size and forecast 2024-2029
- Chart on Rest of World (ROW) - Market size and forecast 2024-2029 ($ million)
- Data Table on Rest of World (ROW) - Market size and forecast 2024-2029 ($ million)
- Chart on Rest of World (ROW) - Year-over-year growth 2024-2029 (%)
- Data Table on Rest of World (ROW) - Year-over-year growth 2024-2029 (%)
- 12.7 US - Market size and forecast 2024-2029
- Chart on US - Market size and forecast 2024-2029 ($ million)
- Data Table on US - Market size and forecast 2024-2029 ($ million)
- Chart on US - Year-over-year growth 2024-2029 (%)
- Data Table on US - Year-over-year growth 2024-2029 (%)
- 12.8 China - Market size and forecast 2024-2029
- Chart on China - Market size and forecast 2024-2029 ($ million)
- Data Table on China - Market size and forecast 2024-2029 ($ million)
- Chart on China - Year-over-year growth 2024-2029 (%)
- Data Table on China - Year-over-year growth 2024-2029 (%)
- 12.9 Japan - Market size and forecast 2024-2029
- Chart on Japan - Market size and forecast 2024-2029 ($ million)
- Data Table on Japan - Market size and forecast 2024-2029 ($ million)
- Chart on Japan - Year-over-year growth 2024-2029 (%)
- Data Table on Japan - Year-over-year growth 2024-2029 (%)
- 12.10 India - Market size and forecast 2024-2029
- Chart on India - Market size and forecast 2024-2029 ($ million)
- Data Table on India - Market size and forecast 2024-2029 ($ million)
- Chart on India - Year-over-year growth 2024-2029 (%)
- Data Table on India - Year-over-year growth 2024-2029 (%)
- 12.11 Germany - Market size and forecast 2024-2029
- Chart on Germany - Market size and forecast 2024-2029 ($ million)
- Data Table on Germany - Market size and forecast 2024-2029 ($ million)
- Chart on Germany - Year-over-year growth 2024-2029 (%)
- Data Table on Germany - Year-over-year growth 2024-2029 (%)
- 12.12 South Korea - Market size and forecast 2024-2029
- Chart on South Korea - Market size and forecast 2024-2029 ($ million)
- Data Table on South Korea - Market size and forecast 2024-2029 ($ million)
- Chart on South Korea - Year-over-year growth 2024-2029 (%)
- Data Table on South Korea - Year-over-year growth 2024-2029 (%)
- 12.13 Canada - Market size and forecast 2024-2029
- Chart on Canada - Market size and forecast 2024-2029 ($ million)
- Data Table on Canada - Market size and forecast 2024-2029 ($ million)
- Chart on Canada - Year-over-year growth 2024-2029 (%)
- Data Table on Canada - Year-over-year growth 2024-2029 (%)
- 12.14 UK - Market size and forecast 2024-2029
- Chart on UK - Market size and forecast 2024-2029 ($ million)
- Data Table on UK - Market size and forecast 2024-2029 ($ million)
- Chart on UK - Year-over-year growth 2024-2029 (%)
- Data Table on UK - Year-over-year growth 2024-2029 (%)
- 12.15 Australia - Market size and forecast 2024-2029
- Chart on Australia - Market size and forecast 2024-2029 ($ million)
- Data Table on Australia - Market size and forecast 2024-2029 ($ million)
- Chart on Australia - Year-over-year growth 2024-2029 (%)
- Data Table on Australia - Year-over-year growth 2024-2029 (%)
- 12.16 Brazil - Market size and forecast 2024-2029
- Chart on Brazil - Market size and forecast 2024-2029 ($ million)
- Data Table on Brazil - Market size and forecast 2024-2029 ($ million)
- Chart on Brazil - Year-over-year growth 2024-2029 (%)
- Data Table on Brazil - Year-over-year growth 2024-2029 (%)
- 12.17 Market opportunity By Geographical Landscape
- Market opportunity By Geographical Landscape ($ million)
- Data Tables on Market opportunity By Geographical Landscape ($ million)
13 Drivers, Challenges, and Opportunity/Restraints
- 13.1 Market drivers
- 13.2 Market challenges
- 13.3 Impact of drivers and challenges
- Impact of drivers and challenges in 2024 and 2029
- 13.4 Market opportunities/restraints
14 Competitive Landscape
- 14.1 Overview
- 14.2 Competitive Landscape
- Overview on criticality of inputs and factors of differentiation
- 14.3 Landscape disruption
- Overview on factors of disruption
- 14.4 Industry risks
- Impact of key risks on business
15 Competitive Analysis
- 15.1 Companies profiled
- Companies covered
- 15.2 Company ranking index
- Company ranking index
- 15.3 Market positioning of companies
- Matrix on companies position and classification
- 15.4 Aran Biomedical
- Aran Biomedical - Overview
- Aran Biomedical - Product / Service
- Aran Biomedical - Key offerings
- SWOT
- 15.5 Biomerics LLC
- Biomerics LLC - Overview
- Biomerics LLC - Product / Service
- Biomerics LLC - Key offerings
- SWOT
- 15.6 Cambridge Design Partnership Ltd.
- Cambridge Design Partnership Ltd. - Overview
- Cambridge Design Partnership Ltd. - Product / Service
- Cambridge Design Partnership Ltd. - Key offerings
- SWOT
- 15.7 Celestica Inc.
- Celestica Inc. - Overview
- Celestica Inc. - Business segments
- Celestica Inc. - Key offerings
- Celestica Inc. - Segment focus
- SWOT
- 15.8 DeviceLab Inc.
- DeviceLab Inc. - Overview
- DeviceLab Inc. - Product / Service
- DeviceLab Inc. - Key offerings
- SWOT
- 15.9 Flex Ltd.
- Flex Ltd. - Overview
- Flex Ltd. - Business segments
- Flex Ltd. - Key offerings
- Flex Ltd. - Segment focus
- SWOT
- 15.10 Freudenberg and Co. KG
- Freudenberg and Co. KG - Overview
- Freudenberg and Co. KG - Product / Service
- Freudenberg and Co. KG - Key news
- Freudenberg and Co. KG - Key offerings
- SWOT
- 15.11 Integrated Computer Solutions Inc.
- Integrated Computer Solutions Inc. - Overview
- Integrated Computer Solutions Inc. - Product / Service
- Integrated Computer Solutions Inc. - Key offerings
- SWOT
- 15.12 Jabil Inc.
- Jabil Inc. - Overview
- Jabil Inc. - Business segments
- Jabil Inc. - Key offerings
- Jabil Inc. - Segment focus
- SWOT
- 15.13 Nordson Corp.
- Nordson Corp. - Overview
- Nordson Corp. - Business segments
- Nordson Corp. - Key news
- Nordson Corp. - Key offerings
- Nordson Corp. - Segment focus
- SWOT
- 15.14 Nuova Donatella
- Nuova Donatella - Overview
- Nuova Donatella - Product / Service
- Nuova Donatella - Key offerings
- SWOT
- 15.15 Planet Innovation Holdings
- Planet Innovation Holdings - Overview
- Planet Innovation Holdings - Product / Service
- Planet Innovation Holdings - Key offerings
- SWOT
- 15.16 Plexus Corp.
- Plexus Corp. - Overview
- Plexus Corp. - Business segments
- Plexus Corp. - Key offerings
- Plexus Corp. - Segment focus
- SWOT
- 15.17 StarFish Product Engineering Inc.
- StarFish Product Engineering Inc. - Overview
- StarFish Product Engineering Inc. - Product / Service
- StarFish Product Engineering Inc. - Key offerings
- SWOT
- 15.18 Veranex
- Veranex - Overview
- Veranex - Product / Service
- Veranex - Key offerings
- SWOT
16 Appendix
- 16.1 Scope of the report
- 16.2 Inclusions and exclusions checklist
- Inclusions checklist
- Exclusions checklist
- 16.3 Currency conversion rates for US$
- Currency conversion rates for US$
- 16.4 Research methodology
- Research methodology
- 16.5 Data procurement
- Information sources
- 16.6 Data validation
- Data validation
- 16.7 Validation techniques employed for market sizing
- Validation techniques employed for market sizing
- 16.8 Data synthesis
- Data synthesis
- 16.9 360 degree market analysis
- 360 degree market analysis
- 16.10 List of abbreviations
- List of abbreviations

