|
|
市場調査レポート
商品コード
1557429
ポリエチレン(PE)フォームの世界市場 2024年~2028年Global Polyethylene (PE) Foam Market 2024-2028 |
||||||

|
|||||||
カスタマイズ可能
|
|||||||


| ポリエチレン(PE)フォームの世界市場 2024年~2028年 |
|
出版日: 2024年08月13日
発行: TechNavio
ページ情報: 英文 174 Pages
納期: 即納可能
|

全表示
- 概要
- 図表
- 目次
ポリエチレン(PE)フォーム市場は、2023年から2028年にかけて23億130万米ドル、予測期間中のCAGRは5.44%で成長すると予測されています。
当レポートでは、ポリエチレン(PE)フォーム市場の全体的な分析、市場規模・予測、動向、成長促進要因、課題、約25のベンダーを網羅したベンダー分析などを掲載しています。
現在の市場シナリオ、最新動向と促進要因、市場環境全体に関する最新分析を提供しています。市場は、新興国の需要拡大、建設業界におけるpeフォーム断熱材の使用増加、自動車業界の旺盛な需要によって牽引されています。
| 市場範囲 | |
|---|---|
| 基準年 | 2024年 |
| 終了年 | 2028年 |
| 予測期間 | 2024年~2028年 |
| 成長モメンタム | 加速 |
| 前年比2024年 | 5.06% |
| CAGR | 5.44% |
| 増分額 | 23億130万米ドル |
本調査では、今後数年間のポリエチレン(PE)フォーム市場成長を牽引する主な要因の一つとして、人口拡大による家具産業の成長を挙げています。また、peフォームの研究開発への投資の増大と新興国市場のメーカー数の増加が市場の大きな需要につながります。
目次
第1章 エグゼクティブサマリー
- 市場概要
第2章 市場情勢
- 市場エコシステム
- 市場の特徴
- バリューチェーン分析
第3章 市場規模の評価
- 市場の定義
- 市場セグメント分析
- 市場規模 2023
- 市場の見通し 2023年~2028年
第4章 市場規模実績
- ポリエチレン(PE)フォームの世界市場 2018年~2022年
- 用途別セグメント分析 2018年~2022年
- タイプセグメント分析 2018年~2022年
- 地域別セグメント分析 2018年~2022年
- 国別セグメント分析 2018年~2022年
第5章 ファイブフォース分析
- ファイブフォースの要約
- 買い手の交渉力
- 供給企業の交渉力
- 新規参入業者の脅威
- 代替品の脅威
- 競争の脅威
- 市況
第6章 市場セグメンテーション:用途別
- 市場セグメンテーション
- 比較:用途別
- パッケージ:市場規模と予測 2023年~2028年
- 自動車:市場規模と予測 2023年~2028年
- 建築と建設:市場規模と予測 2023年~2028年
- 履物:市場規模と予測 2023年~2028年
- その他:市場規模と予測 2023年~2028年
- 市場機会:用途別
第7章 市場セグメンテーション:タイプ別
- 市場セグメンテーション
- 比較:タイプ別
- XLPEフォーム:市場規模と予測 2023年~2028年
- 非XLPEフォーム:市場規模と予測 2023年~2028年
- 市場機会:タイプ別
第8章 顧客情勢
- 顧客情勢の概要
第9章 地域別情勢
- 地域別セグメンテーション
- 地域別比較
- アジア太平洋:市場規模と予測 2023年~2028年
- 欧州:市場規模と予測 2023年~2028年
- 北米:市場規模と予測 2023年~2028年
- 中東・アフリカ:市場規模と予測 2023年~2028年
- 南米:市場規模と予測 2023年~2028年
- 中国:市場規模と予測 2023年~2028年
- 米国:市場規模と予測 2023年~2028年
- ドイツ:市場規模と予測 2023年~2028年
- インド:市場規模と予測 2023年~2028年
- アラブ首長国連邦:市場規模と予測 2023年~2028年
- 市場機会:地域情勢別
第10章 促進要因・課題・機会・抑制要因
- 市場促進要因
- 市場の課題
- 促進要因と課題の影響
- 市場の機会・抑制要因
第11章 競合情勢
- 概要
- 競合情勢
- 混乱の状況
- 業界のリスク
第12章 競合分析
- 企業プロファイル
- 企業の市場ポジショニング
- All Foam Products Co.
- Armacell International SA
- Clark Foam Products Corp.
- Dafa AS
- FoamPartner Switzerland AG
- Hira Industries LLC
- INOAC Corp.
- Johnson Foam Industry
- Mitsubishi Gas Chemical Co. Inc.
- Mitsui Chemicals Inc.
- Orlando Products Inc.
- Palziv Inc.
- Pregis LLC
- Wisconsin Foam Products
- Zotefoams plc
第13章 付録
Exhibits:
- Exhibits1: Executive Summary - Chart on Market Overview
- Exhibits2: Executive Summary - Data Table on Market Overview
- Exhibits3: Executive Summary - Chart on Global Market Characteristics
- Exhibits4: Executive Summary - Chart on Market By Geographical Landscape
- Exhibits5: Executive Summary - Chart on Market Segmentation by Application
- Exhibits6: Executive Summary - Chart on Market Segmentation by Type
- Exhibits7: Executive Summary - Chart on Incremental Growth
- Exhibits8: Executive Summary - Data Table on Incremental Growth
- Exhibits9: Executive Summary - Chart on Company Market Positioning
- Exhibits10: Parent Market
- Exhibits11: Data Table on - Parent Market
- Exhibits12: Market characteristics analysis
- Exhibits13: Value Chain Analysis
- Exhibits14: Offerings of companies included in the market definition
- Exhibits15: Market segments
- Exhibits16: Chart on Global - Market size and forecast 2023-2028 ($ million)
- Exhibits17: Data Table on Global - Market size and forecast 2023-2028 ($ million)
- Exhibits18: Chart on Global Market: Year-over-year growth 2023-2028 (%)
- Exhibits19: Data Table on Global Market: Year-over-year growth 2023-2028 (%)
- Exhibits20: Historic Market Size - Data Table on Global Polyethylene (PE) Foam Market 2018 - 2022 ($ million)
- Exhibits21: Historic Market Size - Application Segment 2018 - 2022 ($ million)
- Exhibits22: Historic Market Size - Type Segment 2018 - 2022 ($ million)
- Exhibits23: Historic Market Size - Geography Segment 2018 - 2022 ($ million)
- Exhibits24: Historic Market Size - Country Segment 2018 - 2022 ($ million)
- Exhibits25: Five forces analysis - Comparison between 2023 and 2028
- Exhibits26: Bargaining power of buyers - Impact of key factors 2023 and 2028
- Exhibits27: Bargaining power of suppliers - Impact of key factors in 2023 and 2028
- Exhibits28: Threat of new entrants - Impact of key factors in 2023 and 2028
- Exhibits29: Threat of substitutes - Impact of key factors in 2023 and 2028
- Exhibits30: Threat of rivalry - Impact of key factors in 2023 and 2028
- Exhibits31: Chart on Market condition - Five forces 2023 and 2028
- Exhibits32: Chart on Application - Market share 2023-2028 (%)
- Exhibits33: Data Table on Application - Market share 2023-2028 (%)
- Exhibits34: Chart on Comparison by Application
- Exhibits35: Data Table on Comparison by Application
- Exhibits36: Chart on Packaging - Market size and forecast 2023-2028 ($ million)
- Exhibits37: Data Table on Packaging - Market size and forecast 2023-2028 ($ million)
- Exhibits38: Chart on Packaging - Year-over-year growth 2023-2028 (%)
- Exhibits39: Data Table on Packaging - Year-over-year growth 2023-2028 (%)
- Exhibits40: Chart on Automotive - Market size and forecast 2023-2028 ($ million)
- Exhibits41: Data Table on Automotive - Market size and forecast 2023-2028 ($ million)
- Exhibits42: Chart on Automotive - Year-over-year growth 2023-2028 (%)
- Exhibits43: Data Table on Automotive - Year-over-year growth 2023-2028 (%)
- Exhibits44: Chart on Building and construction - Market size and forecast 2023-2028 ($ million)
- Exhibits45: Data Table on Building and construction - Market size and forecast 2023-2028 ($ million)
- Exhibits46: Chart on Building and construction - Year-over-year growth 2023-2028 (%)
- Exhibits47: Data Table on Building and construction - Year-over-year growth 2023-2028 (%)
- Exhibits48: Chart on Footwear - Market size and forecast 2023-2028 ($ million)
- Exhibits49: Data Table on Footwear - Market size and forecast 2023-2028 ($ million)
- Exhibits50: Chart on Footwear - Year-over-year growth 2023-2028 (%)
- Exhibits51: Data Table on Footwear - Year-over-year growth 2023-2028 (%)
- Exhibits52: Chart on Others - Market size and forecast 2023-2028 ($ million)
- Exhibits53: Data Table on Others - Market size and forecast 2023-2028 ($ million)
- Exhibits54: Chart on Others - Year-over-year growth 2023-2028 (%)
- Exhibits55: Data Table on Others - Year-over-year growth 2023-2028 (%)
- Exhibits56: Market opportunity by Application ($ million)
- Exhibits57: Data Table on Market opportunity by Application ($ million)
- Exhibits58: Chart on Type - Market share 2023-2028 (%)
- Exhibits59: Data Table on Type - Market share 2023-2028 (%)
- Exhibits60: Chart on Comparison by Type
- Exhibits61: Data Table on Comparison by Type
- Exhibits62: Chart on XLPE foam - Market size and forecast 2023-2028 ($ million)
- Exhibits63: Data Table on XLPE foam - Market size and forecast 2023-2028 ($ million)
- Exhibits64: Chart on XLPE foam - Year-over-year growth 2023-2028 (%)
- Exhibits65: Data Table on XLPE foam - Year-over-year growth 2023-2028 (%)
- Exhibits66: Chart on Non-XLPE foam - Market size and forecast 2023-2028 ($ million)
- Exhibits67: Data Table on Non-XLPE foam - Market size and forecast 2023-2028 ($ million)
- Exhibits68: Chart on Non-XLPE foam - Year-over-year growth 2023-2028 (%)
- Exhibits69: Data Table on Non-XLPE foam - Year-over-year growth 2023-2028 (%)
- Exhibits70: Market opportunity by Type ($ million)
- Exhibits71: Data Table on Market opportunity by Type ($ million)
- Exhibits72: Analysis of price sensitivity, lifecycle, customer purchase basket, adoption rates, and purchase criteria
- Exhibits73: Chart on Market share By Geographical Landscape 2023-2028 (%)
- Exhibits74: Data Table on Market share By Geographical Landscape 2023-2028 (%)
- Exhibits75: Chart on Geographic comparison
- Exhibits76: Data Table on Geographic comparison
- Exhibits77: Chart on APAC - Market size and forecast 2023-2028 ($ million)
- Exhibits78: Data Table on APAC - Market size and forecast 2023-2028 ($ million)
- Exhibits79: Chart on APAC - Year-over-year growth 2023-2028 (%)
- Exhibits80: Data Table on APAC - Year-over-year growth 2023-2028 (%)
- Exhibits81: Chart on Europe - Market size and forecast 2023-2028 ($ million)
- Exhibits82: Data Table on Europe - Market size and forecast 2023-2028 ($ million)
- Exhibits83: Chart on Europe - Year-over-year growth 2023-2028 (%)
- Exhibits84: Data Table on Europe - Year-over-year growth 2023-2028 (%)
- Exhibits85: Chart on North America - Market size and forecast 2023-2028 ($ million)
- Exhibits86: Data Table on North America - Market size and forecast 2023-2028 ($ million)
- Exhibits87: Chart on North America - Year-over-year growth 2023-2028 (%)
- Exhibits88: Data Table on North America - Year-over-year growth 2023-2028 (%)
- Exhibits89: Chart on Middle East and Africa - Market size and forecast 2023-2028 ($ million)
- Exhibits90: Data Table on Middle East and Africa - Market size and forecast 2023-2028 ($ million)
- Exhibits91: Chart on Middle East and Africa - Year-over-year growth 2023-2028 (%)
- Exhibits92: Data Table on Middle East and Africa - Year-over-year growth 2023-2028 (%)
- Exhibits93: Chart on South America - Market size and forecast 2023-2028 ($ million)
- Exhibits94: Data Table on South America - Market size and forecast 2023-2028 ($ million)
- Exhibits95: Chart on South America - Year-over-year growth 2023-2028 (%)
- Exhibits96: Data Table on South America - Year-over-year growth 2023-2028 (%)
- Exhibits97: Chart on China - Market size and forecast 2023-2028 ($ million)
- Exhibits98: Data Table on China - Market size and forecast 2023-2028 ($ million)
- Exhibits99: Chart on China - Year-over-year growth 2023-2028 (%)
- Exhibits100: Data Table on China - Year-over-year growth 2023-2028 (%)
- Exhibits101: Chart on US - Market size and forecast 2023-2028 ($ million)
- Exhibits102: Data Table on US - Market size and forecast 2023-2028 ($ million)
- Exhibits103: Chart on US - Year-over-year growth 2023-2028 (%)
- Exhibits104: Data Table on US - Year-over-year growth 2023-2028 (%)
- Exhibits105: Chart on Germany - Market size and forecast 2023-2028 ($ million)
- Exhibits106: Data Table on Germany - Market size and forecast 2023-2028 ($ million)
- Exhibits107: Chart on Germany - Year-over-year growth 2023-2028 (%)
- Exhibits108: Data Table on Germany - Year-over-year growth 2023-2028 (%)
- Exhibits109: Chart on India - Market size and forecast 2023-2028 ($ million)
- Exhibits110: Data Table on India - Market size and forecast 2023-2028 ($ million)
- Exhibits111: Chart on India - Year-over-year growth 2023-2028 (%)
- Exhibits112: Data Table on India - Year-over-year growth 2023-2028 (%)
- Exhibits113: Chart on UAE - Market size and forecast 2023-2028 ($ million)
- Exhibits114: Data Table on UAE - Market size and forecast 2023-2028 ($ million)
- Exhibits115: Chart on UAE - Year-over-year growth 2023-2028 (%)
- Exhibits116: Data Table on UAE - Year-over-year growth 2023-2028 (%)
- Exhibits117: Market opportunity By Geographical Landscape ($ million)
- Exhibits118: Data Tables on Market opportunity By Geographical Landscape ($ million)
- Exhibits119: Impact of drivers and challenges in 2023 and 2028
- Exhibits120: Overview on criticality of inputs and factors of differentiation
- Exhibits121: Overview on factors of disruption
- Exhibits122: Impact of key risks on business
- Exhibits123: Companies covered
- Exhibits124: Matrix on companies position and classification
- Exhibits125: All Foam Products Co. - Overview
- Exhibits126: All Foam Products Co. - Product / Service
- Exhibits127: All Foam Products Co. - Key offerings
- Exhibits128: Armacell International SA - Overview
- Exhibits129: Armacell International SA - Product / Service
- Exhibits130: Armacell International SA - Key offerings
- Exhibits131: Clark Foam Products Corp. - Overview
- Exhibits132: Clark Foam Products Corp. - Product / Service
- Exhibits133: Clark Foam Products Corp. - Key offerings
- Exhibits134: Dafa AS - Overview
- Exhibits135: Dafa AS - Product / Service
- Exhibits136: Dafa AS - Key offerings
- Exhibits137: FoamPartner Switzerland AG - Overview
- Exhibits138: FoamPartner Switzerland AG - Product / Service
- Exhibits139: FoamPartner Switzerland AG - Key offerings
- Exhibits140: Hira Industries LLC - Overview
- Exhibits141: Hira Industries LLC - Product / Service
- Exhibits142: Hira Industries LLC - Key offerings
- Exhibits143: INOAC Corp. - Overview
- Exhibits144: INOAC Corp. - Product / Service
- Exhibits145: INOAC Corp. - Key offerings
- Exhibits146: Johnson Foam Industry - Overview
- Exhibits147: Johnson Foam Industry - Product / Service
- Exhibits148: Johnson Foam Industry - Key offerings
- Exhibits149: Mitsubishi Gas Chemical Co. Inc. - Overview
- Exhibits150: Mitsubishi Gas Chemical Co. Inc. - Business segments
- Exhibits151: Mitsubishi Gas Chemical Co. Inc. - Key news
- Exhibits152: Mitsubishi Gas Chemical Co. Inc. - Key offerings
- Exhibits153: Mitsubishi Gas Chemical Co. Inc. - Segment focus
- Exhibits154: Mitsui Chemicals Inc. - Overview
- Exhibits155: Mitsui Chemicals Inc. - Business segments
- Exhibits156: Mitsui Chemicals Inc. - Key offerings
- Exhibits157: Mitsui Chemicals Inc. - Segment focus
- Exhibits158: Orlando Products Inc. - Overview
- Exhibits159: Orlando Products Inc. - Product / Service
- Exhibits160: Orlando Products Inc. - Key offerings
- Exhibits161: Palziv Inc. - Overview
- Exhibits162: Palziv Inc. - Product / Service
- Exhibits163: Palziv Inc. - Key offerings
- Exhibits164: Pregis LLC - Overview
- Exhibits165: Pregis LLC - Product / Service
- Exhibits166: Pregis LLC - Key offerings
- Exhibits167: Wisconsin Foam Products - Overview
- Exhibits168: Wisconsin Foam Products - Product / Service
- Exhibits169: Wisconsin Foam Products - Key offerings
- Exhibits170: Zotefoams plc - Overview
- Exhibits171: Zotefoams plc - Business segments
- Exhibits172: Zotefoams plc - Key offerings
- Exhibits173: Zotefoams plc - Segment focus
- Exhibits174: Inclusions checklist
- Exhibits175: Exclusions checklist
- Exhibits176: Currency conversion rates for US$
- Exhibits177: Research methodology
- Exhibits178: Information sources
- Exhibits179: Data validation
- Exhibits180: Validation techniques employed for market sizing
- Exhibits181: Data synthesis
- Exhibits182: 360 degree market analysis
- Exhibits183: List of abbreviations
The polyethylene (pe) foam market is forecasted to grow by USD 2301.3 mn during 2023-2028, accelerating at a CAGR of 5.44% during the forecast period. The report on the polyethylene (pe) foam market provides a holistic analysis, market size and forecast, trends, growth drivers, and challenges, as well as vendor analysis covering around 25 vendors.
The report offers an up-to-date analysis regarding the current market scenario, the latest trends and drivers, and the overall market environment. The market is driven by growing demand from emerging economies, increasing use of pe foam insulation in construction industry, and strong demand from automotive industry.
Technavio's polyethylene (pe) foam market is segmented as below:
| Market Scope | |
|---|---|
| Base Year | 2024 |
| End Year | 2028 |
| Series Year | 2024-2028 |
| Growth Momentum | Accelerate |
| YOY 2024 | 5.06% |
| CAGR | 5.44% |
| Incremental Value | $2301.3 mn |
By Application
- Packaging
- Automotive
- Building and construction
- Footwear
- Others
By Type
- XLPE foam
- Non-XLPE foam
By Geographical Landscape
- APAC
- Europe
- North America
- Middle East and Africa
- South America
This study identifies the growth in furniture industry driven by expanding population as one of the prime reasons driving the polyethylene (pe) foam market growth during the next few years. Also, augmented investment in research and development of pe foams and increasing number of manufacturers in apac will lead to sizable demand in the market.
The report on the polyethylene (pe) foam market covers the following areas:
- Polyethylene (pe) foam market sizing
- Polyethylene (pe) foam market forecast
- Polyethylene (pe) foam market industry analysis
The robust vendor analysis is designed to help clients improve their market position, and in line with this, this report provides a detailed analysis of several leading polyethylene (pe) foam market vendors that include All Foam Products Co., Armacell International SA, Clark Foam Products Corp., Dafa AS, FoamPartner Switzerland AG, Hira Industries LLC, INOAC Corp., Johnson Foam Industry, Mitsubishi Gas Chemical Co. Inc., Mitsui Chemicals Inc., Orlando Products Inc., Palziv Inc., PAR Group Ltd., Pregis LLC, PTI Rubber and Gaskets Inc., Rogers Foam Corp., Sanwa Kako Co. Ltd., Sealed Air Corp., Wisconsin Foam Products, and Zotefoams plc. Also, the polyethylene (pe) foam market analysis report includes information on upcoming trends and challenges that will influence market growth. This is to help companies strategize and leverage all forthcoming growth opportunities.
The study was conducted using an objective combination of primary and secondary information including inputs from key participants in the industry. The report contains a comprehensive market and vendor landscape in addition to an analysis of the key vendors.
The publisher presents a detailed picture of the market by the way of study, synthesis, and summation of data from multiple sources by an analysis of key parameters such as profit, pricing, competition, and promotions. It presents various market facets by identifying the key industry influencers. The data presented is comprehensive, reliable, and a result of extensive research - both primary and secondary. The market research reports provide a complete competitive landscape and an in-depth vendor selection methodology and analysis using qualitative and quantitative research to forecast the accurate market growth.
Table of Contents
1 Executive Summary
- 1.1 Market overview
- Executive Summary - Chart on Market Overview
- Executive Summary - Data Table on Market Overview
- Executive Summary - Chart on Global Market Characteristics
- Executive Summary - Chart on Market By Geographical Landscape
- Executive Summary - Chart on Market Segmentation by Application
- Executive Summary - Chart on Market Segmentation by Type
- Executive Summary - Chart on Incremental Growth
- Executive Summary - Data Table on Incremental Growth
- Executive Summary - Chart on Company Market Positioning
2 Market Landscape
- 2.1 Market ecosystem
- Parent Market
- Data Table on - Parent Market
- 2.2 Market characteristics
- Market characteristics analysis
- 2.3 Value chain analysis
- Value Chain Analysis
3 Market Sizing
- 3.1 Market definition
- Offerings of companies included in the market definition
- 3.2 Market segment analysis
- Market segments
- 3.3 Market size 2023
- 3.4 Market outlook: Forecast for 2023-2028
- Chart on Global - Market size and forecast 2023-2028 ($ million)
- Data Table on Global - Market size and forecast 2023-2028 ($ million)
- Chart on Global Market: Year-over-year growth 2023-2028 (%)
- Data Table on Global Market: Year-over-year growth 2023-2028 (%)
4 Historic Market Size
- 4.1 Global Polyethylene (PE) Foam Market 2018 - 2022
- Historic Market Size - Data Table on Global Polyethylene (PE) Foam Market 2018 - 2022 ($ million)
- 4.2 Application segment analysis 2018 - 2022
- Historic Market Size - Application Segment 2018 - 2022 ($ million)
- 4.3 Type segment analysis 2018 - 2022
- Historic Market Size - Type Segment 2018 - 2022 ($ million)
- 4.4 Geography segment analysis 2018 - 2022
- Historic Market Size - Geography Segment 2018 - 2022 ($ million)
- 4.5 Country segment analysis 2018 - 2022
- Historic Market Size - Country Segment 2018 - 2022 ($ million)
5 Five Forces Analysis
- 5.1 Five forces summary
- Five forces analysis - Comparison between 2023 and 2028
- 5.2 Bargaining power of buyers
- Bargaining power of buyers - Impact of key factors 2023 and 2028
- 5.3 Bargaining power of suppliers
- Bargaining power of suppliers - Impact of key factors in 2023 and 2028
- 5.4 Threat of new entrants
- Threat of new entrants - Impact of key factors in 2023 and 2028
- 5.5 Threat of substitutes
- Threat of substitutes - Impact of key factors in 2023 and 2028
- 5.6 Threat of rivalry
- Threat of rivalry - Impact of key factors in 2023 and 2028
- 5.7 Market condition
- Chart on Market condition - Five forces 2023 and 2028
6 Market Segmentation by Application
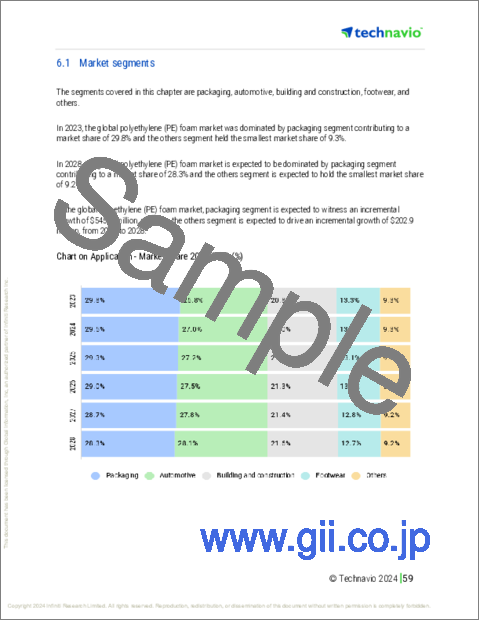
- 6.1 Market segments
- Chart on Application - Market share 2023-2028 (%)
- Data Table on Application - Market share 2023-2028 (%)
- 6.2 Comparison by Application
- Chart on Comparison by Application
- Data Table on Comparison by Application
- 6.3 Packaging - Market size and forecast 2023-2028
- Chart on Packaging - Market size and forecast 2023-2028 ($ million)
- Data Table on Packaging - Market size and forecast 2023-2028 ($ million)
- Chart on Packaging - Year-over-year growth 2023-2028 (%)
- Data Table on Packaging - Year-over-year growth 2023-2028 (%)
- 6.4 Automotive - Market size and forecast 2023-2028
- Chart on Automotive - Market size and forecast 2023-2028 ($ million)
- Data Table on Automotive - Market size and forecast 2023-2028 ($ million)
- Chart on Automotive - Year-over-year growth 2023-2028 (%)
- Data Table on Automotive - Year-over-year growth 2023-2028 (%)
- 6.5 Building and construction - Market size and forecast 2023-2028
- Chart on Building and construction - Market size and forecast 2023-2028 ($ million)
- Data Table on Building and construction - Market size and forecast 2023-2028 ($ million)
- Chart on Building and construction - Year-over-year growth 2023-2028 (%)
- Data Table on Building and construction - Year-over-year growth 2023-2028 (%)
- 6.6 Footwear - Market size and forecast 2023-2028
- Chart on Footwear - Market size and forecast 2023-2028 ($ million)
- Data Table on Footwear - Market size and forecast 2023-2028 ($ million)
- Chart on Footwear - Year-over-year growth 2023-2028 (%)
- Data Table on Footwear - Year-over-year growth 2023-2028 (%)
- 6.7 Others - Market size and forecast 2023-2028
- Chart on Others - Market size and forecast 2023-2028 ($ million)
- Data Table on Others - Market size and forecast 2023-2028 ($ million)
- Chart on Others - Year-over-year growth 2023-2028 (%)
- Data Table on Others - Year-over-year growth 2023-2028 (%)
- 6.8 Market opportunity by Application
- Market opportunity by Application ($ million)
- Data Table on Market opportunity by Application ($ million)
7 Market Segmentation by Type
- 7.1 Market segments
- Chart on Type - Market share 2023-2028 (%)
- Data Table on Type - Market share 2023-2028 (%)
- 7.2 Comparison by Type
- Chart on Comparison by Type
- Data Table on Comparison by Type
- 7.3 XLPE foam - Market size and forecast 2023-2028
- Chart on XLPE foam - Market size and forecast 2023-2028 ($ million)
- Data Table on XLPE foam - Market size and forecast 2023-2028 ($ million)
- Chart on XLPE foam - Year-over-year growth 2023-2028 (%)
- Data Table on XLPE foam - Year-over-year growth 2023-2028 (%)
- 7.4 Non-XLPE foam - Market size and forecast 2023-2028
- Chart on Non-XLPE foam - Market size and forecast 2023-2028 ($ million)
- Data Table on Non-XLPE foam - Market size and forecast 2023-2028 ($ million)
- Chart on Non-XLPE foam - Year-over-year growth 2023-2028 (%)
- Data Table on Non-XLPE foam - Year-over-year growth 2023-2028 (%)
- 7.5 Market opportunity by Type
- Market opportunity by Type ($ million)
- Data Table on Market opportunity by Type ($ million)
8 Customer Landscape
- 8.1 Customer landscape overview
- Analysis of price sensitivity, lifecycle, customer purchase basket, adoption rates, and purchase criteria
9 Geographic Landscape
- 9.1 Geographic segmentation
- Chart on Market share By Geographical Landscape 2023-2028 (%)
- Data Table on Market share By Geographical Landscape 2023-2028 (%)
- 9.2 Geographic comparison
- Chart on Geographic comparison
- Data Table on Geographic comparison
- 9.3 APAC - Market size and forecast 2023-2028
- Chart on APAC - Market size and forecast 2023-2028 ($ million)
- Data Table on APAC - Market size and forecast 2023-2028 ($ million)
- Chart on APAC - Year-over-year growth 2023-2028 (%)
- Data Table on APAC - Year-over-year growth 2023-2028 (%)
- 9.4 Europe - Market size and forecast 2023-2028
- Chart on Europe - Market size and forecast 2023-2028 ($ million)
- Data Table on Europe - Market size and forecast 2023-2028 ($ million)
- Chart on Europe - Year-over-year growth 2023-2028 (%)
- Data Table on Europe - Year-over-year growth 2023-2028 (%)
- 9.5 North America - Market size and forecast 2023-2028
- Chart on North America - Market size and forecast 2023-2028 ($ million)
- Data Table on North America - Market size and forecast 2023-2028 ($ million)
- Chart on North America - Year-over-year growth 2023-2028 (%)
- Data Table on North America - Year-over-year growth 2023-2028 (%)
- 9.6 Middle East and Africa - Market size and forecast 2023-2028
- Chart on Middle East and Africa - Market size and forecast 2023-2028 ($ million)
- Data Table on Middle East and Africa - Market size and forecast 2023-2028 ($ million)
- Chart on Middle East and Africa - Year-over-year growth 2023-2028 (%)
- Data Table on Middle East and Africa - Year-over-year growth 2023-2028 (%)
- 9.7 South America - Market size and forecast 2023-2028
- Chart on South America - Market size and forecast 2023-2028 ($ million)
- Data Table on South America - Market size and forecast 2023-2028 ($ million)
- Chart on South America - Year-over-year growth 2023-2028 (%)
- Data Table on South America - Year-over-year growth 2023-2028 (%)
- 9.8 China - Market size and forecast 2023-2028
- Chart on China - Market size and forecast 2023-2028 ($ million)
- Data Table on China - Market size and forecast 2023-2028 ($ million)
- Chart on China - Year-over-year growth 2023-2028 (%)
- Data Table on China - Year-over-year growth 2023-2028 (%)
- 9.9 US - Market size and forecast 2023-2028
- Chart on US - Market size and forecast 2023-2028 ($ million)
- Data Table on US - Market size and forecast 2023-2028 ($ million)
- Chart on US - Year-over-year growth 2023-2028 (%)
- Data Table on US - Year-over-year growth 2023-2028 (%)
- 9.10 Germany - Market size and forecast 2023-2028
- Chart on Germany - Market size and forecast 2023-2028 ($ million)
- Data Table on Germany - Market size and forecast 2023-2028 ($ million)
- Chart on Germany - Year-over-year growth 2023-2028 (%)
- Data Table on Germany - Year-over-year growth 2023-2028 (%)
- 9.11 India - Market size and forecast 2023-2028
- Chart on India - Market size and forecast 2023-2028 ($ million)
- Data Table on India - Market size and forecast 2023-2028 ($ million)
- Chart on India - Year-over-year growth 2023-2028 (%)
- Data Table on India - Year-over-year growth 2023-2028 (%)
- 9.12 UAE - Market size and forecast 2023-2028
- Chart on UAE - Market size and forecast 2023-2028 ($ million)
- Data Table on UAE - Market size and forecast 2023-2028 ($ million)
- Chart on UAE - Year-over-year growth 2023-2028 (%)
- Data Table on UAE - Year-over-year growth 2023-2028 (%)
- 9.13 Market opportunity By Geographical Landscape
- Market opportunity By Geographical Landscape ($ million)
- Data Tables on Market opportunity By Geographical Landscape ($ million)
10 Drivers, Challenges, and Opportunity/Restraints
- 10.1 Market drivers
- 10.2 Market challenges
- 10.3 Impact of drivers and challenges
- Impact of drivers and challenges in 2023 and 2028
- 10.4 Market opportunities/restraints
11 Competitive Landscape
- 11.1 Overview
- 11.2 Competitive Landscape
- Overview on criticality of inputs and factors of differentiation
- 11.3 Landscape disruption
- Overview on factors of disruption
- 11.4 Industry risks
- Impact of key risks on business
12 Competitive Analysis
- 12.1 Companies profiled
- Companies covered
- 12.2 Market positioning of companies
- Matrix on companies position and classification
- 12.3 All Foam Products Co.
- All Foam Products Co. - Overview
- All Foam Products Co. - Product / Service
- All Foam Products Co. - Key offerings
- 12.4 Armacell International SA
- Armacell International SA - Overview
- Armacell International SA - Product / Service
- Armacell International SA - Key offerings
- 12.5 Clark Foam Products Corp.
- Clark Foam Products Corp. - Overview
- Clark Foam Products Corp. - Product / Service
- Clark Foam Products Corp. - Key offerings
- 12.6 Dafa AS
- Dafa AS - Overview
- Dafa AS - Product / Service
- Dafa AS - Key offerings
- 12.7 FoamPartner Switzerland AG
- FoamPartner Switzerland AG - Overview
- FoamPartner Switzerland AG - Product / Service
- FoamPartner Switzerland AG - Key offerings
- 12.8 Hira Industries LLC
- Hira Industries LLC - Overview
- Hira Industries LLC - Product / Service
- Hira Industries LLC - Key offerings
- 12.9 INOAC Corp.
- INOAC Corp. - Overview
- INOAC Corp. - Product / Service
- INOAC Corp. - Key offerings
- 12.10 Johnson Foam Industry
- Johnson Foam Industry - Overview
- Johnson Foam Industry - Product / Service
- Johnson Foam Industry - Key offerings
- 12.11 Mitsubishi Gas Chemical Co. Inc.
- Mitsubishi Gas Chemical Co. Inc. - Overview
- Mitsubishi Gas Chemical Co. Inc. - Business segments
- Mitsubishi Gas Chemical Co. Inc. - Key news
- Mitsubishi Gas Chemical Co. Inc. - Key offerings
- Mitsubishi Gas Chemical Co. Inc. - Segment focus
- 12.12 Mitsui Chemicals Inc.
- Mitsui Chemicals Inc. - Overview
- Mitsui Chemicals Inc. - Business segments
- Mitsui Chemicals Inc. - Key offerings
- Mitsui Chemicals Inc. - Segment focus
- 12.13 Orlando Products Inc.
- Orlando Products Inc. - Overview
- Orlando Products Inc. - Product / Service
- Orlando Products Inc. - Key offerings
- 12.14 Palziv Inc.
- Palziv Inc. - Overview
- Palziv Inc. - Product / Service
- Palziv Inc. - Key offerings
- 12.15 Pregis LLC
- Pregis LLC - Overview
- Pregis LLC - Product / Service
- Pregis LLC - Key offerings
- 12.16 Wisconsin Foam Products
- Wisconsin Foam Products - Overview
- Wisconsin Foam Products - Product / Service
- Wisconsin Foam Products - Key offerings
- 12.17 Zotefoams plc
- Zotefoams plc - Overview
- Zotefoams plc - Business segments
- Zotefoams plc - Key offerings
- Zotefoams plc - Segment focus
13 Appendix
- 13.1 Scope of the report
- 13.2 Inclusions and exclusions checklist
- Inclusions checklist
- Exclusions checklist
- 13.3 Currency conversion rates for US$
- Currency conversion rates for US$
- 13.4 Research methodology
- Research methodology
- 13.5 Data procurement
- Information sources
- 13.6 Data validation
- Data validation
- 13.7 Validation techniques employed for market sizing
- Validation techniques employed for market sizing
- 13.8 Data synthesis
- Data synthesis
- 13.9 360 degree market analysis
- 360 degree market analysis
- 13.10 List of abbreviations
- List of abbreviations
