|
|
市場調査レポート
商品コード
1723074
ニューロフィードバックシステムの世界市場 2025-2029Global Neurofeedback Systems Market 2025-2029 |
||||||

|
|||||||
カスタマイズ可能
|
|||||||


| ニューロフィードバックシステムの世界市場 2025-2029 |
|
出版日: 2025年04月29日
発行: TechNavio
ページ情報: 英文 204 Pages
納期: 即納可能
|

全表示
- 概要
- 図表
- 目次
ニューロフィードバックシステム市場は2024-2029年に8億5,960万米ドル、予測期間中のCAGRは10.7%で成長すると予測されます。
当レポートでは、ニューロフィードバックシステム市場の全体的な分析、市場規模・予測、動向、成長促進要因、課題、約25のベンダーを網羅したベンダー分析などを掲載しています。
現在の市場シナリオ、最新動向と促進要因、市場環境全体に関する最新分析を提供しています。市場は、神経疾患の有病率の増加、医療療法への非遵守や抵抗を示す患者におけるeegシステムの採用拡大、研究開発活動や臨床研究の拡大によって牽引されています。
| 市場範囲 | |
|---|---|
| 基準年 | 2025 |
| 終了年 | 2029 |
| 予測期間 | 2025-2029 |
| 成長モメンタム | 加速 |
| 前年比2025年 | 9.4% |
| CAGR | 10.7% |
| 増分額 | 8億5,960万米ドル |
本調査は、業界の主要参加者からのインプットを含め、一次情報と二次情報を客観的に組み合わせて実施しました。レポートには、主要企業の分析に加え、包括的な市場規模データ、地域分析によるセグメント、ベンダー情勢が含まれています。レポートには過去データと予測データがあります。
本調査では、今後数年間のニューロフィードバックシステム市場の成長を促進する主な要因の一つとして、市場企業による戦略的イニシアチブを挙げています。また、脳モニタリングにおける技術的進歩の増加や、非侵襲的な治療プロトコルに対する需要の高まりは、市場の大きな需要につながります。
目次
第1章 エグゼクティブサマリー
- 市場概要
第2章 Technavio分析
- 価格・ライフサイクル・顧客購入バスケット・採用率・購入基準の分析
- インプットの重要性と差別化の要因
- 混乱の要因
- 促進要因と課題の影響
第3章 市場情勢
- 市場エコシステム
- 市場の特徴
- バリューチェーン分析
第4章 市場規模
- 市場の定義
- 市場セグメント分析
- 市場規模 2024
- 市場の見通し 2024-2029
第5章 市場規模実績
- ニューロフィードバックシステムの世界市場 2019-2023
- 用途別セグメント分析 2019-2023
- 製品セグメント分析 2019-2023
- エンドユーザーセグメント分析 2019-2023
- 地域別セグメント分析 2019-2023
- 国別セグメント分析 2019-2023
第6章 定性分析
- AIの影響:ニューロフィードバックシステムの世界市場
第7章 ファイブフォース分析
- ファイブフォースの要約
- 買い手の交渉力
- 供給企業の交渉力
- 新規参入業者の脅威
- 代替品の脅威
- 競争の脅威
- 市況
第8章 市場セグメンテーション:用途別
- 市場セグメント
- 比較:用途別
- 注意欠陥多動性障害(ADHD):市場規模と予測 2024-2029
- 疼痛管理:市場規模と予測 2024-2029
- 不眠症:市場規模と予測 2024-2029
- 不安障害:市場規模と予測 2024-2029
- その他:市場規模と予測 2024-2029
- 市場機会:用途別
第9章 市場セグメンテーション:製品別
- 市場セグメント
- 比較:製品別
- 電極またはセンサー:市場規模と予測 2024-2029
- コンピュータソフトウェア:市場規模と予測 2024-2029
- アンプ:市場規模と予測 2024-2029
- 市場機会:製品別
第10章 市場セグメンテーション:エンドユーザー別
- 市場セグメント
- 比較:エンドユーザー別
- 病院:市場規模と予測 2024-2029
- 外来手術センター:市場規模と予測 2024-2029
- クリニック:市場規模と予測 2024-2029
- その他:市場規模と予測 2024-2029
- 市場機会:エンドユーザー別
第11章 顧客情勢
- 顧客情勢の概要
第12章 地域別情勢
- 地域別セグメンテーション
- 地域別比較
- 北米:市場規模と予測 2024-2029
- 欧州:市場規模と予測 2024-2029
- アジア:市場規模と予測 2024-2029
- 世界のその他の地域:市場規模と予測 2024-2029
- 米国:市場規模と予測 2024-2029
- 英国:市場規模と予測 2024-2029
- 中国:市場規模と予測 2024-2029
- ドイツ:市場規模と予測 2024-2029
- フランス:市場規模と予測 2024-2029
- 日本:市場規模と予測 2024-2029
- インド:市場規模と予測 2024-2029
- カナダ:市場規模と予測 2024-2029
- イタリア:市場規模と予測 2024-2029
- ブラジル:市場規模と予測 2024-2029
- 市場機会:地域情勢別
第13章 促進要因・課題・機会・抑制要因
- 市場促進要因
- 市場の課題
- 促進要因と課題の影響
- 市場の機会・抑制要因
第14章 競合情勢
- 概要
- 競合情勢
- 混乱の状況
- 業界のリスク
第15章 競合分析
- 企業プロファイル
- 企業ランキング指数
- 企業の市場ポジショニング
- BEE Medic GmbH
- BrainMaster Technologies Inc.
- Mind Media BV
- Mitsar Co. Ltd.
- Myndlift
- Neurobit Systems
- neurocare group AG
- Thought Technology Ltd.
- Wearable Sensing
- Zengar Institute Inc.
- Zynex Inc.
第16章 付録
Exhibits:
- Exhibits1: Executive Summary - Chart on Market Overview
- Exhibits2: Executive Summary - Data Table on Market Overview
- Exhibits3: Executive Summary - Chart on Global Market Characteristics
- Exhibits4: Executive Summary - Chart on Market By Geographical Landscape
- Exhibits5: Executive Summary - Chart on Market Segmentation by Application
- Exhibits6: Executive Summary - Chart on Market Segmentation by Product
- Exhibits7: Executive Summary - Chart on Market Segmentation by End-user
- Exhibits8: Executive Summary - Chart on Incremental Growth
- Exhibits9: Executive Summary - Data Table on Incremental Growth
- Exhibits10: Executive Summary - Chart on Company Market Positioning
- Exhibits11: Analysis of price sensitivity, lifecycle, customer purchase basket, adoption rates, and purchase criteria
- Exhibits12: Overview on criticality of inputs and factors of differentiation
- Exhibits13: Overview on factors of disruption
- Exhibits14: Impact of drivers and challenges in 2024 and 2029
- Exhibits15: Parent Market
- Exhibits16: Data Table on - Parent Market
- Exhibits17: Market characteristics analysis
- Exhibits18: Value chain analysis
- Exhibits19: Offerings of companies included in the market definition
- Exhibits20: Market segments
- Exhibits21: Chart on Global - Market size and forecast 2024-2029 ($ million)
- Exhibits22: Data Table on Global - Market size and forecast 2024-2029 ($ million)
- Exhibits23: Chart on Global Market: Year-over-year growth 2024-2029 (%)
- Exhibits24: Data Table on Global Market: Year-over-year growth 2024-2029 (%)
- Exhibits25: Historic Market Size - Data Table on Global Neurofeedback Systems Market 2019 - 2023 ($ million)
- Exhibits26: Historic Market Size - Application Segment 2019 - 2023 ($ million)
- Exhibits27: Historic Market Size - Product Segment 2019 - 2023 ($ million)
- Exhibits28: Historic Market Size - End-user Segment 2019 - 2023 ($ million)
- Exhibits29: Historic Market Size - Geography Segment 2019 - 2023 ($ million)
- Exhibits30: Historic Market Size - Country Segment 2019 - 2023 ($ million)
- Exhibits31: Five forces analysis - Comparison between 2024 and 2029
- Exhibits32: Bargaining power of buyers - Impact of key factors 2024 and 2029
- Exhibits33: Bargaining power of suppliers - Impact of key factors in 2024 and 2029
- Exhibits34: Threat of new entrants - Impact of key factors in 2024 and 2029
- Exhibits35: Threat of substitutes - Impact of key factors in 2024 and 2029
- Exhibits36: Threat of rivalry - Impact of key factors in 2024 and 2029
- Exhibits37: Chart on Market condition - Five forces 2024 and 2029
- Exhibits38: Chart on Application - Market share 2024-2029 (%)
- Exhibits39: Data Table on Application - Market share 2024-2029 (%)
- Exhibits40: Chart on Comparison by Application
- Exhibits41: Data Table on Comparison by Application
- Exhibits42: Chart on Attention deficit hyperactivity disorder (ADHD) - Market size and forecast 2024-2029 ($ million)
- Exhibits43: Data Table on Attention deficit hyperactivity disorder (ADHD) - Market size and forecast 2024-2029 ($ million)
- Exhibits44: Chart on Attention deficit hyperactivity disorder (ADHD) - Year-over-year growth 2024-2029 (%)
- Exhibits45: Data Table on Attention deficit hyperactivity disorder (ADHD) - Year-over-year growth 2024-2029 (%)
- Exhibits46: Chart on Pain management - Market size and forecast 2024-2029 ($ million)
- Exhibits47: Data Table on Pain management - Market size and forecast 2024-2029 ($ million)
- Exhibits48: Chart on Pain management - Year-over-year growth 2024-2029 (%)
- Exhibits49: Data Table on Pain management - Year-over-year growth 2024-2029 (%)
- Exhibits50: Chart on Insomnia - Market size and forecast 2024-2029 ($ million)
- Exhibits51: Data Table on Insomnia - Market size and forecast 2024-2029 ($ million)
- Exhibits52: Chart on Insomnia - Year-over-year growth 2024-2029 (%)
- Exhibits53: Data Table on Insomnia - Year-over-year growth 2024-2029 (%)
- Exhibits54: Chart on Anxiety disorder - Market size and forecast 2024-2029 ($ million)
- Exhibits55: Data Table on Anxiety disorder - Market size and forecast 2024-2029 ($ million)
- Exhibits56: Chart on Anxiety disorder - Year-over-year growth 2024-2029 (%)
- Exhibits57: Data Table on Anxiety disorder - Year-over-year growth 2024-2029 (%)
- Exhibits58: Chart on Others - Market size and forecast 2024-2029 ($ million)
- Exhibits59: Data Table on Others - Market size and forecast 2024-2029 ($ million)
- Exhibits60: Chart on Others - Year-over-year growth 2024-2029 (%)
- Exhibits61: Data Table on Others - Year-over-year growth 2024-2029 (%)
- Exhibits62: Market opportunity by Application ($ million)
- Exhibits63: Data Table on Market opportunity by Application ($ million)
- Exhibits64: Chart on Product - Market share 2024-2029 (%)
- Exhibits65: Data Table on Product - Market share 2024-2029 (%)
- Exhibits66: Chart on Comparison by Product
- Exhibits67: Data Table on Comparison by Product
- Exhibits68: Chart on Electrodes or sensors - Market size and forecast 2024-2029 ($ million)
- Exhibits69: Data Table on Electrodes or sensors - Market size and forecast 2024-2029 ($ million)
- Exhibits70: Chart on Electrodes or sensors - Year-over-year growth 2024-2029 (%)
- Exhibits71: Data Table on Electrodes or sensors - Year-over-year growth 2024-2029 (%)
- Exhibits72: Chart on Computer software - Market size and forecast 2024-2029 ($ million)
- Exhibits73: Data Table on Computer software - Market size and forecast 2024-2029 ($ million)
- Exhibits74: Chart on Computer software - Year-over-year growth 2024-2029 (%)
- Exhibits75: Data Table on Computer software - Year-over-year growth 2024-2029 (%)
- Exhibits76: Chart on Amplifiers - Market size and forecast 2024-2029 ($ million)
- Exhibits77: Data Table on Amplifiers - Market size and forecast 2024-2029 ($ million)
- Exhibits78: Chart on Amplifiers - Year-over-year growth 2024-2029 (%)
- Exhibits79: Data Table on Amplifiers - Year-over-year growth 2024-2029 (%)
- Exhibits80: Market opportunity by Product ($ million)
- Exhibits81: Data Table on Market opportunity by Product ($ million)
- Exhibits82: Chart on End-user - Market share 2024-2029 (%)
- Exhibits83: Data Table on End-user - Market share 2024-2029 (%)
- Exhibits84: Chart on Comparison by End-user
- Exhibits85: Data Table on Comparison by End-user
- Exhibits86: Chart on Hospitals - Market size and forecast 2024-2029 ($ million)
- Exhibits87: Data Table on Hospitals - Market size and forecast 2024-2029 ($ million)
- Exhibits88: Chart on Hospitals - Year-over-year growth 2024-2029 (%)
- Exhibits89: Data Table on Hospitals - Year-over-year growth 2024-2029 (%)
- Exhibits90: Chart on Ambulatory surgical centers - Market size and forecast 2024-2029 ($ million)
- Exhibits91: Data Table on Ambulatory surgical centers - Market size and forecast 2024-2029 ($ million)
- Exhibits92: Chart on Ambulatory surgical centers - Year-over-year growth 2024-2029 (%)
- Exhibits93: Data Table on Ambulatory surgical centers - Year-over-year growth 2024-2029 (%)
- Exhibits94: Chart on Clinics - Market size and forecast 2024-2029 ($ million)
- Exhibits95: Data Table on Clinics - Market size and forecast 2024-2029 ($ million)
- Exhibits96: Chart on Clinics - Year-over-year growth 2024-2029 (%)
- Exhibits97: Data Table on Clinics - Year-over-year growth 2024-2029 (%)
- Exhibits98: Chart on Others - Market size and forecast 2024-2029 ($ million)
- Exhibits99: Data Table on Others - Market size and forecast 2024-2029 ($ million)
- Exhibits100: Chart on Others - Year-over-year growth 2024-2029 (%)
- Exhibits101: Data Table on Others - Year-over-year growth 2024-2029 (%)
- Exhibits102: Market opportunity by End-user ($ million)
- Exhibits103: Data Table on Market opportunity by End-user ($ million)
- Exhibits104: Analysis of price sensitivity, lifecycle, customer purchase basket, adoption rates, and purchase criteria
- Exhibits105: Chart on Market share By Geographical Landscape 2024-2029 (%)
- Exhibits106: Data Table on Market share By Geographical Landscape 2024-2029 (%)
- Exhibits107: Chart on Geographic comparison
- Exhibits108: Data Table on Geographic comparison
- Exhibits109: Chart on North America - Market size and forecast 2024-2029 ($ million)
- Exhibits110: Data Table on North America - Market size and forecast 2024-2029 ($ million)
- Exhibits111: Chart on North America - Year-over-year growth 2024-2029 (%)
- Exhibits112: Data Table on North America - Year-over-year growth 2024-2029 (%)
- Exhibits113: Chart on Europe - Market size and forecast 2024-2029 ($ million)
- Exhibits114: Data Table on Europe - Market size and forecast 2024-2029 ($ million)
- Exhibits115: Chart on Europe - Year-over-year growth 2024-2029 (%)
- Exhibits116: Data Table on Europe - Year-over-year growth 2024-2029 (%)
- Exhibits117: Chart on Asia - Market size and forecast 2024-2029 ($ million)
- Exhibits118: Data Table on Asia - Market size and forecast 2024-2029 ($ million)
- Exhibits119: Chart on Asia - Year-over-year growth 2024-2029 (%)
- Exhibits120: Data Table on Asia - Year-over-year growth 2024-2029 (%)
- Exhibits121: Chart on Rest of World (ROW) - Market size and forecast 2024-2029 ($ million)
- Exhibits122: Data Table on Rest of World (ROW) - Market size and forecast 2024-2029 ($ million)
- Exhibits123: Chart on Rest of World (ROW) - Year-over-year growth 2024-2029 (%)
- Exhibits124: Data Table on Rest of World (ROW) - Year-over-year growth 2024-2029 (%)
- Exhibits125: Chart on US - Market size and forecast 2024-2029 ($ million)
- Exhibits126: Data Table on US - Market size and forecast 2024-2029 ($ million)
- Exhibits127: Chart on US - Year-over-year growth 2024-2029 (%)
- Exhibits128: Data Table on US - Year-over-year growth 2024-2029 (%)
- Exhibits129: Chart on UK - Market size and forecast 2024-2029 ($ million)
- Exhibits130: Data Table on UK - Market size and forecast 2024-2029 ($ million)
- Exhibits131: Chart on UK - Year-over-year growth 2024-2029 (%)
- Exhibits132: Data Table on UK - Year-over-year growth 2024-2029 (%)
- Exhibits133: Chart on China - Market size and forecast 2024-2029 ($ million)
- Exhibits134: Data Table on China - Market size and forecast 2024-2029 ($ million)
- Exhibits135: Chart on China - Year-over-year growth 2024-2029 (%)
- Exhibits136: Data Table on China - Year-over-year growth 2024-2029 (%)
- Exhibits137: Chart on Germany - Market size and forecast 2024-2029 ($ million)
- Exhibits138: Data Table on Germany - Market size and forecast 2024-2029 ($ million)
- Exhibits139: Chart on Germany - Year-over-year growth 2024-2029 (%)
- Exhibits140: Data Table on Germany - Year-over-year growth 2024-2029 (%)
- Exhibits141: Chart on France - Market size and forecast 2024-2029 ($ million)
- Exhibits142: Data Table on France - Market size and forecast 2024-2029 ($ million)
- Exhibits143: Chart on France - Year-over-year growth 2024-2029 (%)
- Exhibits144: Data Table on France - Year-over-year growth 2024-2029 (%)
- Exhibits145: Chart on Japan - Market size and forecast 2024-2029 ($ million)
- Exhibits146: Data Table on Japan - Market size and forecast 2024-2029 ($ million)
- Exhibits147: Chart on Japan - Year-over-year growth 2024-2029 (%)
- Exhibits148: Data Table on Japan - Year-over-year growth 2024-2029 (%)
- Exhibits149: Chart on India - Market size and forecast 2024-2029 ($ million)
- Exhibits150: Data Table on India - Market size and forecast 2024-2029 ($ million)
- Exhibits151: Chart on India - Year-over-year growth 2024-2029 (%)
- Exhibits152: Data Table on India - Year-over-year growth 2024-2029 (%)
- Exhibits153: Chart on Canada - Market size and forecast 2024-2029 ($ million)
- Exhibits154: Data Table on Canada - Market size and forecast 2024-2029 ($ million)
- Exhibits155: Chart on Canada - Year-over-year growth 2024-2029 (%)
- Exhibits156: Data Table on Canada - Year-over-year growth 2024-2029 (%)
- Exhibits157: Chart on Italy - Market size and forecast 2024-2029 ($ million)
- Exhibits158: Data Table on Italy - Market size and forecast 2024-2029 ($ million)
- Exhibits159: Chart on Italy - Year-over-year growth 2024-2029 (%)
- Exhibits160: Data Table on Italy - Year-over-year growth 2024-2029 (%)
- Exhibits161: Chart on Brazil - Market size and forecast 2024-2029 ($ million)
- Exhibits162: Data Table on Brazil - Market size and forecast 2024-2029 ($ million)
- Exhibits163: Chart on Brazil - Year-over-year growth 2024-2029 (%)
- Exhibits164: Data Table on Brazil - Year-over-year growth 2024-2029 (%)
- Exhibits165: Market opportunity By Geographical Landscape ($ million)
- Exhibits166: Data Tables on Market opportunity By Geographical Landscape ($ million)
- Exhibits167: Impact of drivers and challenges in 2024 and 2029
- Exhibits168: Overview on criticality of inputs and factors of differentiation
- Exhibits169: Overview on factors of disruption
- Exhibits170: Impact of key risks on business
- Exhibits171: Companies covered
- Exhibits172: Company ranking index
- Exhibits173: Matrix on companies position and classification
- Exhibits174: BEE Medic GmbH - Overview
- Exhibits175: BEE Medic GmbH - Product / Service
- Exhibits176: BEE Medic GmbH - Key offerings
- Exhibits177: SWOT
- Exhibits178: BrainMaster Technologies Inc. - Overview
- Exhibits179: BrainMaster Technologies Inc. - Product / Service
- Exhibits180: BrainMaster Technologies Inc. - Key offerings
- Exhibits181: SWOT
- Exhibits182: Mind Media BV - Overview
- Exhibits183: Mind Media BV - Product / Service
- Exhibits184: Mind Media BV - Key offerings
- Exhibits185: SWOT
- Exhibits186: Mitsar Co. Ltd. - Overview
- Exhibits187: Mitsar Co. Ltd. - Product / Service
- Exhibits188: Mitsar Co. Ltd. - Key offerings
- Exhibits189: SWOT
- Exhibits190: Myndlift - Overview
- Exhibits191: Myndlift - Product / Service
- Exhibits192: Myndlift - Key offerings
- Exhibits193: SWOT
- Exhibits194: Neurobit Systems - Overview
- Exhibits195: Neurobit Systems - Product / Service
- Exhibits196: Neurobit Systems - Key offerings
- Exhibits197: SWOT
- Exhibits198: neurocare group AG - Overview
- Exhibits199: neurocare group AG - Product / Service
- Exhibits200: neurocare group AG - Key offerings
- Exhibits201: SWOT
- Exhibits202: Thought Technology Ltd. - Overview
- Exhibits203: Thought Technology Ltd. - Product / Service
- Exhibits204: Thought Technology Ltd. - Key offerings
- Exhibits205: SWOT
- Exhibits206: Wearable Sensing - Overview
- Exhibits207: Wearable Sensing - Product / Service
- Exhibits208: Wearable Sensing - Key offerings
- Exhibits209: SWOT
- Exhibits210: Zengar Institute Inc. - Overview
- Exhibits211: Zengar Institute Inc. - Product / Service
- Exhibits212: Zengar Institute Inc. - Key offerings
- Exhibits213: SWOT
- Exhibits214: Zynex Inc. - Overview
- Exhibits215: Zynex Inc. - Product / Service
- Exhibits216: Zynex Inc. - Key news
- Exhibits217: Zynex Inc. - Key offerings
- Exhibits218: SWOT
- Exhibits219: Inclusions checklist
- Exhibits220: Exclusions checklist
- Exhibits221: Currency conversion rates for US$
- Exhibits222: Research methodology
- Exhibits223: Information sources
- Exhibits224: Data validation
- Exhibits225: Validation techniques employed for market sizing
- Exhibits226: Data synthesis
- Exhibits227: 360 degree market analysis
- Exhibits228: List of abbreviations
The neurofeedback systems market is forecasted to grow by USD 859.6 mn during 2024-2029, accelerating at a CAGR of 10.7% during the forecast period. The report on the neurofeedback systems market provides a holistic analysis, market size and forecast, trends, growth drivers, and challenges, as well as vendor analysis covering around 25 vendors.
The report offers an up-to-date analysis regarding the current market scenario, the latest trends and drivers, and the overall market environment. The market is driven by growing prevalence of neurological diseases, growing adoption of eeg systems among patients showing non-compliance and resistance to medical therapy, and growing research and development activities and clinical studies.
| Market Scope | |
|---|---|
| Base Year | 2025 |
| End Year | 2029 |
| Series Year | 2025-2029 |
| Growth Momentum | Accelerate |
| YOY 2025 | 9.4% |
| CAGR | 10.7% |
| Incremental Value | $859.6 mn |
The study was conducted using an objective combination of primary and secondary information including inputs from key participants in the industry. The report contains a comprehensive market size data, segment with regional analysis and vendor landscape in addition to an analysis of the key companies. Reports have historic and forecast data.
Technavio's neurofeedback systems market is segmented as below:
By Application
- Attention deficit hyperactivity disorder (ADHD)
- Pain management
- Insomnia
- Anxiety disorder
- Others
By Product
- Electrodes or sensors
- Computer software
- Amplifiers
By End-user
- Hospitals
- Ambulatory surgical centers
- Clinics
- Others
By Geographical Landscape
- North America
- Europe
- Asia
- Rest of World (ROW)
This study identifies the strategic initiatives by market companies as one of the prime reasons driving the neurofeedback systems market growth during the next few years. Also, increasing technological advances in brain monitoring and growing demand for non-invasive treatment protocols will lead to sizable demand in the market.
The report on the neurofeedback systems market covers the following areas:
- Neurofeedback Systems Market sizing
- Neurofeedback Systems Market forecast
- Neurofeedback Systems Market industry analysis
The robust vendor analysis is designed to help clients improve their market position, and in line with this, this report provides a detailed analysis of several leading neurofeedback systems market vendors that include BEE Medic GmbH, BrainMaster Technologies Inc., Mind Media BV, Mitsar Co. Ltd., Myndlift, Neurobit Systems, neurocare group AG, Thought Technology Ltd., Wearable Sensing, Zengar Institute Inc., and Zynex Inc.. Also, the neurofeedback systems market analysis report includes information on upcoming trends and challenges that will influence market growth. This is to help companies strategize and leverage all forthcoming growth opportunities.
The publisher presents a detailed picture of the market by the way of study, synthesis, and summation of data from multiple sources by an analysis of key parameters such as profit, pricing, competition, and promotions. It presents various market facets by identifying the key industry influencers. The data presented is comprehensive, reliable, and a result of extensive primary and secondary research. The market research reports provide a complete competitive landscape and an in-depth vendor selection methodology and analysis using qualitative and quantitative research to forecast accurate market growth.
Table of Contents
1 Executive Summary
- 1.1 Market overview
- Executive Summary - Chart on Market Overview
- Executive Summary - Data Table on Market Overview
- Executive Summary - Chart on Global Market Characteristics
- Executive Summary - Chart on Market By Geographical Landscape
- Executive Summary - Chart on Market Segmentation by Application
- Executive Summary - Chart on Market Segmentation by Product
- Executive Summary - Chart on Market Segmentation by End-user
- Executive Summary - Chart on Incremental Growth
- Executive Summary - Data Table on Incremental Growth
- Executive Summary - Chart on Company Market Positioning
2 Technavio Analysis
- 2.1 Analysis of price sensitivity, lifecycle, customer purchase basket, adoption rates, and purchase criteria
- Analysis of price sensitivity, lifecycle, customer purchase basket, adoption rates, and purchase criteria
- 2.2 Criticality of inputs and Factors of differentiation
- Overview on criticality of inputs and factors of differentiation
- 2.3 Factors of disruption
- Overview on factors of disruption
- 2.4 Impact of drivers and challenges
- Impact of drivers and challenges in 2024 and 2029
3 Market Landscape
- 3.1 Market ecosystem
- Parent Market
- Data Table on - Parent Market
- 3.2 Market characteristics
- Market characteristics analysis
- 3.3 Value chain analysis
- Value chain analysis
4 Market Sizing
- 4.1 Market definition
- Offerings of companies included in the market definition
- 4.2 Market segment analysis
- Market segments
- 4.3 Market size 2024
- 4.4 Market outlook: Forecast for 2024-2029
- Chart on Global - Market size and forecast 2024-2029 ($ million)
- Data Table on Global - Market size and forecast 2024-2029 ($ million)
- Chart on Global Market: Year-over-year growth 2024-2029 (%)
- Data Table on Global Market: Year-over-year growth 2024-2029 (%)
5 Historic Market Size
- 5.1 Global Neurofeedback Systems Market 2019 - 2023
- Historic Market Size - Data Table on Global Neurofeedback Systems Market 2019 - 2023 ($ million)
- 5.2 Application segment analysis 2019 - 2023
- Historic Market Size - Application Segment 2019 - 2023 ($ million)
- 5.3 Product segment analysis 2019 - 2023
- Historic Market Size - Product Segment 2019 - 2023 ($ million)
- 5.4 End-user segment analysis 2019 - 2023
- Historic Market Size - End-user Segment 2019 - 2023 ($ million)
- 5.5 Geography segment analysis 2019 - 2023
- Historic Market Size - Geography Segment 2019 - 2023 ($ million)
- 5.6 Country segment analysis 2019 - 2023
- Historic Market Size - Country Segment 2019 - 2023 ($ million)
6 Qualitative Analysis
- 6.1 Impact of AI on Global Neurofeedback Systems Market
7 Five Forces Analysis
- 7.1 Five forces summary
- Five forces analysis - Comparison between 2024 and 2029
- 7.2 Bargaining power of buyers
- Bargaining power of buyers - Impact of key factors 2024 and 2029
- 7.3 Bargaining power of suppliers
- Bargaining power of suppliers - Impact of key factors in 2024 and 2029
- 7.4 Threat of new entrants
- Threat of new entrants - Impact of key factors in 2024 and 2029
- 7.5 Threat of substitutes
- Threat of substitutes - Impact of key factors in 2024 and 2029
- 7.6 Threat of rivalry
- Threat of rivalry - Impact of key factors in 2024 and 2029
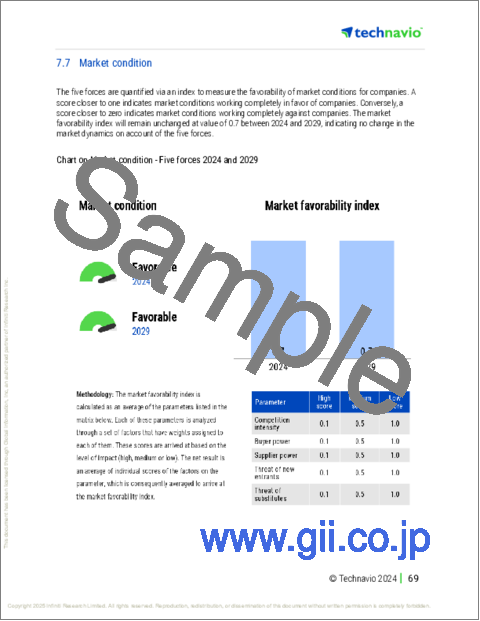
- 7.7 Market condition
- Chart on Market condition - Five forces 2024 and 2029
8 Market Segmentation by Application
- 8.1 Market segments
- Chart on Application - Market share 2024-2029 (%)
- Data Table on Application - Market share 2024-2029 (%)
- 8.2 Comparison by Application
- Chart on Comparison by Application
- Data Table on Comparison by Application
- 8.3 Attention deficit hyperactivity disorder (ADHD) - Market size and forecast 2024-2029
- Chart on Attention deficit hyperactivity disorder (ADHD) - Market size and forecast 2024-2029 ($ million)
- Data Table on Attention deficit hyperactivity disorder (ADHD) - Market size and forecast 2024-2029 ($ million)
- Chart on Attention deficit hyperactivity disorder (ADHD) - Year-over-year growth 2024-2029 (%)
- Data Table on Attention deficit hyperactivity disorder (ADHD) - Year-over-year growth 2024-2029 (%)
- 8.4 Pain management - Market size and forecast 2024-2029
- Chart on Pain management - Market size and forecast 2024-2029 ($ million)
- Data Table on Pain management - Market size and forecast 2024-2029 ($ million)
- Chart on Pain management - Year-over-year growth 2024-2029 (%)
- Data Table on Pain management - Year-over-year growth 2024-2029 (%)
- 8.5 Insomnia - Market size and forecast 2024-2029
- Chart on Insomnia - Market size and forecast 2024-2029 ($ million)
- Data Table on Insomnia - Market size and forecast 2024-2029 ($ million)
- Chart on Insomnia - Year-over-year growth 2024-2029 (%)
- Data Table on Insomnia - Year-over-year growth 2024-2029 (%)
- 8.6 Anxiety disorder - Market size and forecast 2024-2029
- Chart on Anxiety disorder - Market size and forecast 2024-2029 ($ million)
- Data Table on Anxiety disorder - Market size and forecast 2024-2029 ($ million)
- Chart on Anxiety disorder - Year-over-year growth 2024-2029 (%)
- Data Table on Anxiety disorder - Year-over-year growth 2024-2029 (%)
- 8.7 Others - Market size and forecast 2024-2029
- Chart on Others - Market size and forecast 2024-2029 ($ million)
- Data Table on Others - Market size and forecast 2024-2029 ($ million)
- Chart on Others - Year-over-year growth 2024-2029 (%)
- Data Table on Others - Year-over-year growth 2024-2029 (%)
- 8.8 Market opportunity by Application
- Market opportunity by Application ($ million)
- Data Table on Market opportunity by Application ($ million)
9 Market Segmentation by Product
- 9.1 Market segments
- Chart on Product - Market share 2024-2029 (%)
- Data Table on Product - Market share 2024-2029 (%)
- 9.2 Comparison by Product
- Chart on Comparison by Product
- Data Table on Comparison by Product
- 9.3 Electrodes or sensors - Market size and forecast 2024-2029
- Chart on Electrodes or sensors - Market size and forecast 2024-2029 ($ million)
- Data Table on Electrodes or sensors - Market size and forecast 2024-2029 ($ million)
- Chart on Electrodes or sensors - Year-over-year growth 2024-2029 (%)
- Data Table on Electrodes or sensors - Year-over-year growth 2024-2029 (%)
- 9.4 Computer software - Market size and forecast 2024-2029
- Chart on Computer software - Market size and forecast 2024-2029 ($ million)
- Data Table on Computer software - Market size and forecast 2024-2029 ($ million)
- Chart on Computer software - Year-over-year growth 2024-2029 (%)
- Data Table on Computer software - Year-over-year growth 2024-2029 (%)
- 9.5 Amplifiers - Market size and forecast 2024-2029
- Chart on Amplifiers - Market size and forecast 2024-2029 ($ million)
- Data Table on Amplifiers - Market size and forecast 2024-2029 ($ million)
- Chart on Amplifiers - Year-over-year growth 2024-2029 (%)
- Data Table on Amplifiers - Year-over-year growth 2024-2029 (%)
- 9.6 Market opportunity by Product
- Market opportunity by Product ($ million)
- Data Table on Market opportunity by Product ($ million)
10 Market Segmentation by End-user
- 10.1 Market segments
- Chart on End-user - Market share 2024-2029 (%)
- Data Table on End-user - Market share 2024-2029 (%)
- 10.2 Comparison by End-user
- Chart on Comparison by End-user
- Data Table on Comparison by End-user
- 10.3 Hospitals - Market size and forecast 2024-2029
- Chart on Hospitals - Market size and forecast 2024-2029 ($ million)
- Data Table on Hospitals - Market size and forecast 2024-2029 ($ million)
- Chart on Hospitals - Year-over-year growth 2024-2029 (%)
- Data Table on Hospitals - Year-over-year growth 2024-2029 (%)
- 10.4 Ambulatory surgical centers - Market size and forecast 2024-2029
- Chart on Ambulatory surgical centers - Market size and forecast 2024-2029 ($ million)
- Data Table on Ambulatory surgical centers - Market size and forecast 2024-2029 ($ million)
- Chart on Ambulatory surgical centers - Year-over-year growth 2024-2029 (%)
- Data Table on Ambulatory surgical centers - Year-over-year growth 2024-2029 (%)
- 10.5 Clinics - Market size and forecast 2024-2029
- Chart on Clinics - Market size and forecast 2024-2029 ($ million)
- Data Table on Clinics - Market size and forecast 2024-2029 ($ million)
- Chart on Clinics - Year-over-year growth 2024-2029 (%)
- Data Table on Clinics - Year-over-year growth 2024-2029 (%)
- 10.6 Others - Market size and forecast 2024-2029
- Chart on Others - Market size and forecast 2024-2029 ($ million)
- Data Table on Others - Market size and forecast 2024-2029 ($ million)
- Chart on Others - Year-over-year growth 2024-2029 (%)
- Data Table on Others - Year-over-year growth 2024-2029 (%)
- 10.7 Market opportunity by End-user
- Market opportunity by End-user ($ million)
- Data Table on Market opportunity by End-user ($ million)
11 Customer Landscape
- 11.1 Customer landscape overview
- Analysis of price sensitivity, lifecycle, customer purchase basket, adoption rates, and purchase criteria
12 Geographic Landscape
- 12.1 Geographic segmentation
- Chart on Market share By Geographical Landscape 2024-2029 (%)
- Data Table on Market share By Geographical Landscape 2024-2029 (%)
- 12.2 Geographic comparison
- Chart on Geographic comparison
- Data Table on Geographic comparison
- 12.3 North America - Market size and forecast 2024-2029
- Chart on North America - Market size and forecast 2024-2029 ($ million)
- Data Table on North America - Market size and forecast 2024-2029 ($ million)
- Chart on North America - Year-over-year growth 2024-2029 (%)
- Data Table on North America - Year-over-year growth 2024-2029 (%)
- 12.4 Europe - Market size and forecast 2024-2029
- Chart on Europe - Market size and forecast 2024-2029 ($ million)
- Data Table on Europe - Market size and forecast 2024-2029 ($ million)
- Chart on Europe - Year-over-year growth 2024-2029 (%)
- Data Table on Europe - Year-over-year growth 2024-2029 (%)
- 12.5 Asia - Market size and forecast 2024-2029
- Chart on Asia - Market size and forecast 2024-2029 ($ million)
- Data Table on Asia - Market size and forecast 2024-2029 ($ million)
- Chart on Asia - Year-over-year growth 2024-2029 (%)
- Data Table on Asia - Year-over-year growth 2024-2029 (%)
- 12.6 Rest of World (ROW) - Market size and forecast 2024-2029
- Chart on Rest of World (ROW) - Market size and forecast 2024-2029 ($ million)
- Data Table on Rest of World (ROW) - Market size and forecast 2024-2029 ($ million)
- Chart on Rest of World (ROW) - Year-over-year growth 2024-2029 (%)
- Data Table on Rest of World (ROW) - Year-over-year growth 2024-2029 (%)
- 12.7 US - Market size and forecast 2024-2029
- Chart on US - Market size and forecast 2024-2029 ($ million)
- Data Table on US - Market size and forecast 2024-2029 ($ million)
- Chart on US - Year-over-year growth 2024-2029 (%)
- Data Table on US - Year-over-year growth 2024-2029 (%)
- 12.8 UK - Market size and forecast 2024-2029
- Chart on UK - Market size and forecast 2024-2029 ($ million)
- Data Table on UK - Market size and forecast 2024-2029 ($ million)
- Chart on UK - Year-over-year growth 2024-2029 (%)
- Data Table on UK - Year-over-year growth 2024-2029 (%)
- 12.9 China - Market size and forecast 2024-2029
- Chart on China - Market size and forecast 2024-2029 ($ million)
- Data Table on China - Market size and forecast 2024-2029 ($ million)
- Chart on China - Year-over-year growth 2024-2029 (%)
- Data Table on China - Year-over-year growth 2024-2029 (%)
- 12.10 Germany - Market size and forecast 2024-2029
- Chart on Germany - Market size and forecast 2024-2029 ($ million)
- Data Table on Germany - Market size and forecast 2024-2029 ($ million)
- Chart on Germany - Year-over-year growth 2024-2029 (%)
- Data Table on Germany - Year-over-year growth 2024-2029 (%)
- 12.11 France - Market size and forecast 2024-2029
- Chart on France - Market size and forecast 2024-2029 ($ million)
- Data Table on France - Market size and forecast 2024-2029 ($ million)
- Chart on France - Year-over-year growth 2024-2029 (%)
- Data Table on France - Year-over-year growth 2024-2029 (%)
- 12.12 Japan - Market size and forecast 2024-2029
- Chart on Japan - Market size and forecast 2024-2029 ($ million)
- Data Table on Japan - Market size and forecast 2024-2029 ($ million)
- Chart on Japan - Year-over-year growth 2024-2029 (%)
- Data Table on Japan - Year-over-year growth 2024-2029 (%)
- 12.13 India - Market size and forecast 2024-2029
- Chart on India - Market size and forecast 2024-2029 ($ million)
- Data Table on India - Market size and forecast 2024-2029 ($ million)
- Chart on India - Year-over-year growth 2024-2029 (%)
- Data Table on India - Year-over-year growth 2024-2029 (%)
- 12.14 Canada - Market size and forecast 2024-2029
- Chart on Canada - Market size and forecast 2024-2029 ($ million)
- Data Table on Canada - Market size and forecast 2024-2029 ($ million)
- Chart on Canada - Year-over-year growth 2024-2029 (%)
- Data Table on Canada - Year-over-year growth 2024-2029 (%)
- 12.15 Italy - Market size and forecast 2024-2029
- Chart on Italy - Market size and forecast 2024-2029 ($ million)
- Data Table on Italy - Market size and forecast 2024-2029 ($ million)
- Chart on Italy - Year-over-year growth 2024-2029 (%)
- Data Table on Italy - Year-over-year growth 2024-2029 (%)
- 12.16 Brazil - Market size and forecast 2024-2029
- Chart on Brazil - Market size and forecast 2024-2029 ($ million)
- Data Table on Brazil - Market size and forecast 2024-2029 ($ million)
- Chart on Brazil - Year-over-year growth 2024-2029 (%)
- Data Table on Brazil - Year-over-year growth 2024-2029 (%)
- 12.17 Market opportunity By Geographical Landscape
- Market opportunity By Geographical Landscape ($ million)
- Data Tables on Market opportunity By Geographical Landscape ($ million)
13 Drivers, Challenges, and Opportunity/Restraints
- 13.1 Market drivers
- 13.2 Market challenges
- 13.3 Impact of drivers and challenges
- Impact of drivers and challenges in 2024 and 2029
- 13.4 Market opportunities/restraints
14 Competitive Landscape
- 14.1 Overview
- 14.2 Competitive Landscape
- Overview on criticality of inputs and factors of differentiation
- 14.3 Landscape disruption
- Overview on factors of disruption
- 14.4 Industry risks
- Impact of key risks on business
15 Competitive Analysis
- 15.1 Companies profiled
- Companies covered
- 15.2 Company ranking index
- Company ranking index
- 15.3 Market positioning of companies
- Matrix on companies position and classification
- 15.4 BEE Medic GmbH
- BEE Medic GmbH - Overview
- BEE Medic GmbH - Product / Service
- BEE Medic GmbH - Key offerings
- SWOT
- 15.5 BrainMaster Technologies Inc.
- BrainMaster Technologies Inc. - Overview
- BrainMaster Technologies Inc. - Product / Service
- BrainMaster Technologies Inc. - Key offerings
- SWOT
- 15.6 Mind Media BV
- Mind Media BV - Overview
- Mind Media BV - Product / Service
- Mind Media BV - Key offerings
- SWOT
- 15.7 Mitsar Co. Ltd.
- Mitsar Co. Ltd. - Overview
- Mitsar Co. Ltd. - Product / Service
- Mitsar Co. Ltd. - Key offerings
- SWOT
- 15.8 Myndlift
- Myndlift - Overview
- Myndlift - Product / Service
- Myndlift - Key offerings
- SWOT
- 15.9 Neurobit Systems
- Neurobit Systems - Overview
- Neurobit Systems - Product / Service
- Neurobit Systems - Key offerings
- SWOT
- 15.10 neurocare group AG
- neurocare group AG - Overview
- neurocare group AG - Product / Service
- neurocare group AG - Key offerings
- SWOT
- 15.11 Thought Technology Ltd.
- Thought Technology Ltd. - Overview
- Thought Technology Ltd. - Product / Service
- Thought Technology Ltd. - Key offerings
- SWOT
- 15.12 Wearable Sensing
- Wearable Sensing - Overview
- Wearable Sensing - Product / Service
- Wearable Sensing - Key offerings
- SWOT
- 15.13 Zengar Institute Inc.
- Zengar Institute Inc. - Overview
- Zengar Institute Inc. - Product / Service
- Zengar Institute Inc. - Key offerings
- SWOT
- 15.14 Zynex Inc.
- Zynex Inc. - Overview
- Zynex Inc. - Product / Service
- Zynex Inc. - Key news
- Zynex Inc. - Key offerings
- SWOT
16 Appendix
- 16.1 Scope of the report
- 16.2 Inclusions and exclusions checklist
- Inclusions checklist
- Exclusions checklist
- 16.3 Currency conversion rates for US$
- Currency conversion rates for US$
- 16.4 Research methodology
- Research methodology
- 16.5 Data procurement
- Information sources
- 16.6 Data validation
- Data validation
- 16.7 Validation techniques employed for market sizing
- Validation techniques employed for market sizing
- 16.8 Data synthesis
- Data synthesis
- 16.9 360 degree market analysis
- 360 degree market analysis
- 16.10 List of abbreviations
- List of abbreviations

