|
|
市場調査レポート
商品コード
1544366
RNAiドラッグデリバリーの世界市場 2024-2028Global Rnai Drug Delivery Market 2024-2028 |
||||||

|
|||||||
カスタマイズ可能
|
|||||||

| RNAiドラッグデリバリーの世界市場 2024-2028 |
|
出版日: 2024年07月12日
発行: TechNavio
ページ情報: 英文 180 Pages
納期: 即納可能
|

全表示
- 概要
- 図表
- 目次
RNAiドラッグデリバリー市場は2023-2028年に1,932億米ドル、予測期間中のCAGRは27.16%で成長すると予測されています。
当レポートでは、RNAiドラッグデリバリー市場の全体的な分析、市場規模・予測、動向、成長促進要因、課題、約25のベンダーを網羅したベンダー分析などを掲載しています。
現在の市場シナリオ、最新動向と促進要因、市場環境全体に関する最新分析を提供しています。同市場は、RNAi治療薬の高い標的親和性と特異性、製薬・バイオテクノロジー分野での研究活動の活発化、神経疾患の有病率の増加が牽引しています。
| 市場範囲 | |
|---|---|
| 基準年 | 2024 |
| 終了年 | 2028 |
| 予測期間 | 2024-2028 |
| 成長モメンタム | 加速 |
| 前年比2024年 | 20.94% |
| CAGR | 27.16% |
| 増分額 | 1,932億米ドル |
本調査では、今後数年間のRNAiドラッグデリバリー市場の成長を牽引する主な要因の一つとして、ベンダーによるRNAi療法の研究開発の増加を挙げています。また、複数の治療分野におけるRNAi治療薬への注目の高まりや、RNAiアプローチにおける科学的進歩も、市場の大きな需要につながると思われます。
目次
第1章 エグゼクティブサマリー
- 市場概要
第2章 市場情勢
- 市場エコシステム
- 市場の特徴
- バリューチェーン分析
第3章 市場規模の評価
- 市場の定義
- 市場セグメント分析
- 市場規模 2023
- 市場の見通し 2023-2028
第4章 市場規模実績
- RNAiドラッグデリバリーの世界市場 2018-2022
- 技術別セグメント分析 2018-2022
- 用途別セグメント分析 2018-2022
- 地域別セグメント分析 2018-2022
- 国別セグメント分析 2018-2022
第5章 ファイブフォース分析
- ファイブフォースの要約
- 買い手の交渉力
- 供給企業の交渉力
- 新規参入業者の脅威
- 代替品の脅威
- 競争の脅威
- 市況
第6章 市場セグメンテーション:技術別
- 市場セグメンテーション
- 比較:技術別
- ナノ粒子によるドラッグデリバリー:市場規模と予測 2023-2028
- 肺へのドラッグデリバリー:市場規模と予測 2023-2028
- 核酸ドラッグデリバリー:市場規模と予測 2023-2028
- アプタマードラッグデリバリー:市場規模と予測 2023-2028
- 市場機会:技術別
第7章 市場セグメンテーション:用途別
- 市場セグメンテーション
- 比較:用途別
- 感染症:市場規模と予測 2023-2028
- 腫瘍学:市場規模と予測 2023-2028
- 心臓病学:市場規模と予測 2023-2028
- 神経学:市場規模と予測 2023-2028
- その他:市場規模と予測 2023-2028
- 市場機会:用途別
第8章 顧客情勢
- 顧客情勢の概要
第9章 地域別情勢
- 地域別セグメンテーション
- 比較:地域別
- 北米:市場規模と予測 2023-2028
- 欧州:市場規模と予測 2023-2028
- アジア:市場規模と予測 2023-2028
- 世界のその他の地域:市場規模と予測 2023-2028
- 米国:市場規模と予測 2023-2028
- 英国:市場規模と予測 2023-2028
- ドイツ:市場規模と予測 2023-2028
- 中国:市場規模と予測 2023-2028
- カナダ:市場規模と予測 2023-2028
- 市場機会:地域別
第10章 促進要因・課題・機会・抑制要因
- 市場促進要因
- 市場の課題
- 促進要因と課題の影響
- 市場の機会・抑制要因
第11章 競合情勢
- 概要
- 競合情勢
- 混乱の状況
- 業界のリスク
第12章 競合分析
- 企業プロファイル
- 企業の市場ポジショニング
- Alnylam Pharmaceuticals Inc.
- Arbutus Biopharma Corp.
- Arrowhead Pharmaceuticals Inc.
- Bayer AG
- BioNTech SE
- Bristol Myers Squibb Co.
- F. Hoffmann La Roche Ltd.
- Novartis AG
- Novo Nordisk AS
- Phio Pharmaceuticals
- Sanofi SA
- Silence Therapeutics plc
- Sirnaomics Inc.
- Sylentis S.A.
- Thermo Fisher Scientific Inc.
第13章 付録
Exhibits:
- Exhibits1: Executive Summary - Chart on Market Overview
- Exhibits2: Executive Summary - Data Table on Market Overview
- Exhibits3: Executive Summary - Chart on Global Market Characteristics
- Exhibits4: Executive Summary - Chart on Market By Geographical Landscape
- Exhibits5: Executive Summary - Chart on Market Segmentation by Technology
- Exhibits6: Executive Summary - Chart on Market Segmentation by Application
- Exhibits7: Executive Summary - Chart on Incremental Growth
- Exhibits8: Executive Summary - Data Table on Incremental Growth
- Exhibits9: Executive Summary - Chart on Company Market Positioning
- Exhibits10: Parent Market
- Exhibits11: Data Table on - Parent Market
- Exhibits12: Market characteristics analysis
- Exhibits13: Value Chain Analysis
- Exhibits14: Offerings of companies included in the market definition
- Exhibits15: Market segments
- Exhibits16: Chart on Global - Market size and forecast 2023-2028 ($ billion)
- Exhibits17: Data Table on Global - Market size and forecast 2023-2028 ($ billion)
- Exhibits18: Chart on Global Market: Year-over-year growth 2023-2028 (%)
- Exhibits19: Data Table on Global Market: Year-over-year growth 2023-2028 (%)
- Exhibits20: Historic Market Size - Data Table on Global RNAi Drug Delivery Market 2018 - 2022 ($ billion)
- Exhibits21: Historic Market Size - Technology Segment 2018 - 2022 ($ billion)
- Exhibits22: Historic Market Size - Application Segment 2018 - 2022 ($ billion)
- Exhibits23: Historic Market Size - Geography Segment 2018 - 2022 ($ billion)
- Exhibits24: Historic Market Size - Country Segment 2018 - 2022 ($ billion)
- Exhibits25: Five forces analysis - Comparison between 2023 and 2028
- Exhibits26: Bargaining power of buyers - Impact of key factors 2023 and 2028
- Exhibits27: Bargaining power of suppliers - Impact of key factors in 2023 and 2028
- Exhibits28: Threat of new entrants - Impact of key factors in 2023 and 2028
- Exhibits29: Threat of substitutes - Impact of key factors in 2023 and 2028
- Exhibits30: Threat of rivalry - Impact of key factors in 2023 and 2028
- Exhibits31: Chart on Market condition - Five forces 2023 and 2028
- Exhibits32: Chart on Technology - Market share 2023-2028 (%)
- Exhibits33: Data Table on Technology - Market share 2023-2028 (%)
- Exhibits34: Chart on Comparison by Technology
- Exhibits35: Data Table on Comparison by Technology
- Exhibits36: Chart on Nanoparticle drug delivery - Market size and forecast 2023-2028 ($ billion)
- Exhibits37: Data Table on Nanoparticle drug delivery - Market size and forecast 2023-2028 ($ billion)
- Exhibits38: Chart on Nanoparticle drug delivery - Year-over-year growth 2023-2028 (%)
- Exhibits39: Data Table on Nanoparticle drug delivery - Year-over-year growth 2023-2028 (%)
- Exhibits40: Chart on Pulmonary drug delivery - Market size and forecast 2023-2028 ($ billion)
- Exhibits41: Data Table on Pulmonary drug delivery - Market size and forecast 2023-2028 ($ billion)
- Exhibits42: Chart on Pulmonary drug delivery - Year-over-year growth 2023-2028 (%)
- Exhibits43: Data Table on Pulmonary drug delivery - Year-over-year growth 2023-2028 (%)
- Exhibits44: Chart on Nucleic acid drug delivery - Market size and forecast 2023-2028 ($ billion)
- Exhibits45: Data Table on Nucleic acid drug delivery - Market size and forecast 2023-2028 ($ billion)
- Exhibits46: Chart on Nucleic acid drug delivery - Year-over-year growth 2023-2028 (%)
- Exhibits47: Data Table on Nucleic acid drug delivery - Year-over-year growth 2023-2028 (%)
- Exhibits48: Chart on Aptamer drug delivery - Market size and forecast 2023-2028 ($ billion)
- Exhibits49: Data Table on Aptamer drug delivery - Market size and forecast 2023-2028 ($ billion)
- Exhibits50: Chart on Aptamer drug delivery - Year-over-year growth 2023-2028 (%)
- Exhibits51: Data Table on Aptamer drug delivery - Year-over-year growth 2023-2028 (%)
- Exhibits52: Market opportunity by Technology ($ billion)
- Exhibits53: Data Table on Market opportunity by Technology ($ billion)
- Exhibits54: Chart on Application - Market share 2023-2028 (%)
- Exhibits55: Data Table on Application - Market share 2023-2028 (%)
- Exhibits56: Chart on Comparison by Application
- Exhibits57: Data Table on Comparison by Application
- Exhibits58: Chart on Infectious diseases - Market size and forecast 2023-2028 ($ billion)
- Exhibits59: Data Table on Infectious diseases - Market size and forecast 2023-2028 ($ billion)
- Exhibits60: Chart on Infectious diseases - Year-over-year growth 2023-2028 (%)
- Exhibits61: Data Table on Infectious diseases - Year-over-year growth 2023-2028 (%)
- Exhibits62: Chart on Oncology - Market size and forecast 2023-2028 ($ billion)
- Exhibits63: Data Table on Oncology - Market size and forecast 2023-2028 ($ billion)
- Exhibits64: Chart on Oncology - Year-over-year growth 2023-2028 (%)
- Exhibits65: Data Table on Oncology - Year-over-year growth 2023-2028 (%)
- Exhibits66: Chart on Cardiology - Market size and forecast 2023-2028 ($ billion)
- Exhibits67: Data Table on Cardiology - Market size and forecast 2023-2028 ($ billion)
- Exhibits68: Chart on Cardiology - Year-over-year growth 2023-2028 (%)
- Exhibits69: Data Table on Cardiology - Year-over-year growth 2023-2028 (%)
- Exhibits70: Chart on Neurology - Market size and forecast 2023-2028 ($ billion)
- Exhibits71: Data Table on Neurology - Market size and forecast 2023-2028 ($ billion)
- Exhibits72: Chart on Neurology - Year-over-year growth 2023-2028 (%)
- Exhibits73: Data Table on Neurology - Year-over-year growth 2023-2028 (%)
- Exhibits74: Chart on Others - Market size and forecast 2023-2028 ($ billion)
- Exhibits75: Data Table on Others - Market size and forecast 2023-2028 ($ billion)
- Exhibits76: Chart on Others - Year-over-year growth 2023-2028 (%)
- Exhibits77: Data Table on Others - Year-over-year growth 2023-2028 (%)
- Exhibits78: Market opportunity by Application ($ billion)
- Exhibits79: Data Table on Market opportunity by Application ($ billion)
- Exhibits80: Analysis of price sensitivity, lifecycle, customer purchase basket, adoption rates, and purchase criteria
- Exhibits81: Chart on Market share By Geographical Landscape 2023-2028 (%)
- Exhibits82: Data Table on Market share By Geographical Landscape 2023-2028 (%)
- Exhibits83: Chart on Geographic comparison
- Exhibits84: Data Table on Geographic comparison
- Exhibits85: Chart on North America - Market size and forecast 2023-2028 ($ billion)
- Exhibits86: Data Table on North America - Market size and forecast 2023-2028 ($ billion)
- Exhibits87: Chart on North America - Year-over-year growth 2023-2028 (%)
- Exhibits88: Data Table on North America - Year-over-year growth 2023-2028 (%)
- Exhibits89: Chart on Europe - Market size and forecast 2023-2028 ($ billion)
- Exhibits90: Data Table on Europe - Market size and forecast 2023-2028 ($ billion)
- Exhibits91: Chart on Europe - Year-over-year growth 2023-2028 (%)
- Exhibits92: Data Table on Europe - Year-over-year growth 2023-2028 (%)
- Exhibits93: Chart on Asia - Market size and forecast 2023-2028 ($ billion)
- Exhibits94: Data Table on Asia - Market size and forecast 2023-2028 ($ billion)
- Exhibits95: Chart on Asia - Year-over-year growth 2023-2028 (%)
- Exhibits96: Data Table on Asia - Year-over-year growth 2023-2028 (%)
- Exhibits97: Chart on Rest of World (ROW) - Market size and forecast 2023-2028 ($ billion)
- Exhibits98: Data Table on Rest of World (ROW) - Market size and forecast 2023-2028 ($ billion)
- Exhibits99: Chart on Rest of World (ROW) - Year-over-year growth 2023-2028 (%)
- Exhibits100: Data Table on Rest of World (ROW) - Year-over-year growth 2023-2028 (%)
- Exhibits101: Chart on US - Market size and forecast 2023-2028 ($ billion)
- Exhibits102: Data Table on US - Market size and forecast 2023-2028 ($ billion)
- Exhibits103: Chart on US - Year-over-year growth 2023-2028 (%)
- Exhibits104: Data Table on US - Year-over-year growth 2023-2028 (%)
- Exhibits105: Chart on UK - Market size and forecast 2023-2028 ($ billion)
- Exhibits106: Data Table on UK - Market size and forecast 2023-2028 ($ billion)
- Exhibits107: Chart on UK - Year-over-year growth 2023-2028 (%)
- Exhibits108: Data Table on UK - Year-over-year growth 2023-2028 (%)
- Exhibits109: Chart on Germany - Market size and forecast 2023-2028 ($ billion)
- Exhibits110: Data Table on Germany - Market size and forecast 2023-2028 ($ billion)
- Exhibits111: Chart on Germany - Year-over-year growth 2023-2028 (%)
- Exhibits112: Data Table on Germany - Year-over-year growth 2023-2028 (%)
- Exhibits113: Chart on China - Market size and forecast 2023-2028 ($ billion)
- Exhibits114: Data Table on China - Market size and forecast 2023-2028 ($ billion)
- Exhibits115: Chart on China - Year-over-year growth 2023-2028 (%)
- Exhibits116: Data Table on China - Year-over-year growth 2023-2028 (%)
- Exhibits117: Chart on Canada - Market size and forecast 2023-2028 ($ billion)
- Exhibits118: Data Table on Canada - Market size and forecast 2023-2028 ($ billion)
- Exhibits119: Chart on Canada - Year-over-year growth 2023-2028 (%)
- Exhibits120: Data Table on Canada - Year-over-year growth 2023-2028 (%)
- Exhibits121: Market opportunity By Geographical Landscape ($ billion)
- Exhibits122: Data Tables on Market opportunity By Geographical Landscape ($ billion)
- Exhibits123: Impact of drivers and challenges in 2023 and 2028
- Exhibits124: Overview on criticality of inputs and factors of differentiation
- Exhibits125: Overview on factors of disruption
- Exhibits126: Impact of key risks on business
- Exhibits127: Companies covered
- Exhibits128: Matrix on companies position and classification
- Exhibits129: Alnylam Pharmaceuticals Inc. - Overview
- Exhibits130: Alnylam Pharmaceuticals Inc. - Product / Service
- Exhibits131: Alnylam Pharmaceuticals Inc. - Key news
- Exhibits132: Alnylam Pharmaceuticals Inc. - Key offerings
- Exhibits133: Arbutus Biopharma Corp. - Overview
- Exhibits134: Arbutus Biopharma Corp. - Product / Service
- Exhibits135: Arbutus Biopharma Corp. - Key offerings
- Exhibits136: Arrowhead Pharmaceuticals Inc. - Overview
- Exhibits137: Arrowhead Pharmaceuticals Inc. - Business segments
- Exhibits138: Arrowhead Pharmaceuticals Inc. - Key offerings
- Exhibits139: Arrowhead Pharmaceuticals Inc. - Segment focus
- Exhibits140: Bayer AG - Overview
- Exhibits141: Bayer AG - Business segments
- Exhibits142: Bayer AG - Key news
- Exhibits143: Bayer AG - Key offerings
- Exhibits144: Bayer AG - Segment focus
- Exhibits145: BioNTech SE - Overview
- Exhibits146: BioNTech SE - Product / Service
- Exhibits147: BioNTech SE - Key offerings
- Exhibits148: Bristol Myers Squibb Co. - Overview
- Exhibits149: Bristol Myers Squibb Co. - Product / Service
- Exhibits150: Bristol Myers Squibb Co. - Key news
- Exhibits151: Bristol Myers Squibb Co. - Key offerings
- Exhibits152: F. Hoffmann La Roche Ltd. - Overview
- Exhibits153: F. Hoffmann La Roche Ltd. - Business segments
- Exhibits154: F. Hoffmann La Roche Ltd. - Key news
- Exhibits155: F. Hoffmann La Roche Ltd. - Key offerings
- Exhibits156: F. Hoffmann La Roche Ltd. - Segment focus
- Exhibits157: Novartis AG - Overview
- Exhibits158: Novartis AG - Business segments
- Exhibits159: Novartis AG - Key news
- Exhibits160: Novartis AG - Key offerings
- Exhibits161: Novartis AG - Segment focus
- Exhibits162: Novo Nordisk AS - Overview
- Exhibits163: Novo Nordisk AS - Business segments
- Exhibits164: Novo Nordisk AS - Key news
- Exhibits165: Novo Nordisk AS - Key offerings
- Exhibits166: Novo Nordisk AS - Segment focus
- Exhibits167: Phio Pharmaceuticals - Overview
- Exhibits168: Phio Pharmaceuticals - Product / Service
- Exhibits169: Phio Pharmaceuticals - Key offerings
- Exhibits170: Sanofi SA - Overview
- Exhibits171: Sanofi SA - Business segments
- Exhibits172: Sanofi SA - Key news
- Exhibits173: Sanofi SA - Key offerings
- Exhibits174: Sanofi SA - Segment focus
- Exhibits175: Silence Therapeutics plc - Overview
- Exhibits176: Silence Therapeutics plc - Product / Service
- Exhibits177: Silence Therapeutics plc - Key offerings
- Exhibits178: Sirnaomics Inc. - Overview
- Exhibits179: Sirnaomics Inc. - Product / Service
- Exhibits180: Sirnaomics Inc. - Key offerings
- Exhibits181: Sylentis S.A. - Overview
- Exhibits182: Sylentis S.A. - Product / Service
- Exhibits183: Sylentis S.A. - Key offerings
- Exhibits184: Thermo Fisher Scientific Inc. - Overview
- Exhibits185: Thermo Fisher Scientific Inc. - Business segments
- Exhibits186: Thermo Fisher Scientific Inc. - Key news
- Exhibits187: Thermo Fisher Scientific Inc. - Key offerings
- Exhibits188: Thermo Fisher Scientific Inc. - Segment focus
- Exhibits189: Inclusions checklist
- Exhibits190: Exclusions checklist
- Exhibits191: Currency conversion rates for US$
- Exhibits192: Research methodology
- Exhibits193: Information sources
- Exhibits194: Data validation
- Exhibits195: Validation techniques employed for market sizing
- Exhibits196: Data synthesis
- Exhibits197: 360 degree market analysis
- Exhibits198: List of abbreviations
The RNAi drug delivery market is forecasted to grow by USD 193.2 bn during 2023-2028, accelerating at a CAGR of 27.16% during the forecast period. The report on the RNAi drug delivery market provides a holistic analysis, market size and forecast, trends, growth drivers, and challenges, as well as vendor analysis covering around 25 vendors.
The report offers an up-to-date analysis regarding the current market scenario, the latest trends and drivers, and the overall market environment. The market is driven by high target affinity and specificity of RNAi therapeutics, increasing research activities in pharmaceutical and biotechnology sectors, and increasing prevalence of neurological disorders.
Technavio's RNAi drug delivery market is segmented as below:
| Market Scope | |
|---|---|
| Base Year | 2024 |
| End Year | 2028 |
| Series Year | 2024-2028 |
| Growth Momentum | Accelerate |
| YOY 2024 | 20.94% |
| CAGR | 27.16% |
| Incremental Value | $193.2 bn |
By Technology
- Nanoparticle drug delivery
- Pulmonary drug delivery
- Nucleic acid drug delivery
- Aptamer drug delivery
By Application
- Infectious diseases
- Oncology
- Cardiology
- Neurology
- Others
By Geographical Landscape
- North America
- Europe
- Asia
- Rest of World (ROW)
This study identifies the increasing R and D for RNAi therapy by market vendors as one of the prime reasons driving the RNAi drug delivery market growth during the next few years. Also, increasing focus on RNAi drugs for multiple therapy areas and significant scientific progress in RNAi approach will lead to sizable demand in the market.
The report on the RNAi drug delivery market covers the following areas:
- RNAi drug delivery market sizing
- RNAi drug delivery market forecast
- RNAi drug delivery market industry analysis
The robust vendor analysis is designed to help clients improve their market position, and in line with this, this report provides a detailed analysis of several leading RNAi drug delivery market vendors that include Alnylam Pharmaceuticals Inc., Arbutus Biopharma Corp., Arrowhead Pharmaceuticals Inc., Bayer AG, Benitec Biopharma Inc., BioNTech SE, Bristol Myers Squibb Co., CureVac AG, e therapeutics PLC, F. Hoffmann La Roche Ltd., Novartis AG, Novo Nordisk AS, Phio Pharmaceuticals, Sanofi SA, Silence Therapeutics PLC, Silenseed Inc., siRNAgen Therapeutics Corp., Sirnaomics Inc., Sylentis S.A., Thermo Fisher Scientific Inc., and TransCode Therapeutics Inc.. Also, the RNAi drug delivery market analysis report includes information on upcoming trends and challenges that will influence market growth. This is to help companies strategize and leverage all forthcoming growth opportunities.
The study was conducted using an objective combination of primary and secondary information including inputs from key participants in the industry. The report contains a comprehensive market and vendor landscape in addition to an analysis of the key vendors.
The publisher presents a detailed picture of the market by the way of study, synthesis, and summation of data from multiple sources by an analysis of key parameters such as profit, pricing, competition, and promotions. It presents various market facets by identifying the key industry influencers. The data presented is comprehensive, reliable, and a result of extensive research - both primary and secondary. The market research reports provide a complete competitive landscape and an in-depth vendor selection methodology and analysis using qualitative and quantitative research to forecast the accurate market growth.
Table of Contents
1 Executive Summary
- 1.1 Market overview
- Executive Summary - Chart on Market Overview
- Executive Summary - Data Table on Market Overview
- Executive Summary - Chart on Global Market Characteristics
- Executive Summary - Chart on Market By Geographical Landscape
- Executive Summary - Chart on Market Segmentation by Technology
- Executive Summary - Chart on Market Segmentation by Application
- Executive Summary - Chart on Incremental Growth
- Executive Summary - Data Table on Incremental Growth
- Executive Summary - Chart on Company Market Positioning
2 Market Landscape
- 2.1 Market ecosystem
- Parent Market
- Data Table on - Parent Market
- 2.2 Market characteristics
- Market characteristics analysis
- 2.3 Value chain analysis
- Value Chain Analysis
3 Market Sizing
- 3.1 Market definition
- Offerings of companies included in the market definition
- 3.2 Market segment analysis
- Market segments
- 3.3 Market size 2023
- 3.4 Market outlook: Forecast for 2023-2028
- Chart on Global - Market size and forecast 2023-2028 ($ billion)
- Data Table on Global - Market size and forecast 2023-2028 ($ billion)
- Chart on Global Market: Year-over-year growth 2023-2028 (%)
- Data Table on Global Market: Year-over-year growth 2023-2028 (%)
4 Historic Market Size
- 4.1 Global RNAi Drug Delivery Market 2018 - 2022
- Historic Market Size - Data Table on Global RNAi Drug Delivery Market 2018 - 2022 ($ billion)
- 4.2 Technology segment analysis 2018 - 2022
- Historic Market Size - Technology Segment 2018 - 2022 ($ billion)
- 4.3 Application segment analysis 2018 - 2022
- Historic Market Size - Application Segment 2018 - 2022 ($ billion)
- 4.4 Geography segment analysis 2018 - 2022
- Historic Market Size - Geography Segment 2018 - 2022 ($ billion)
- 4.5 Country segment analysis 2018 - 2022
- Historic Market Size - Country Segment 2018 - 2022 ($ billion)
5 Five Forces Analysis
- 5.1 Five forces summary
- Five forces analysis - Comparison between 2023 and 2028
- 5.2 Bargaining power of buyers
- Bargaining power of buyers - Impact of key factors 2023 and 2028
- 5.3 Bargaining power of suppliers
- Bargaining power of suppliers - Impact of key factors in 2023 and 2028
- 5.4 Threat of new entrants
- Threat of new entrants - Impact of key factors in 2023 and 2028
- 5.5 Threat of substitutes
- Threat of substitutes - Impact of key factors in 2023 and 2028
- 5.6 Threat of rivalry
- Threat of rivalry - Impact of key factors in 2023 and 2028
- 5.7 Market condition
- Chart on Market condition - Five forces 2023 and 2028
6 Market Segmentation by Technology
- 6.1 Market segments
- Chart on Technology - Market share 2023-2028 (%)
- Data Table on Technology - Market share 2023-2028 (%)
- 6.2 Comparison by Technology
- Chart on Comparison by Technology
- Data Table on Comparison by Technology
- 6.3 Nanoparticle drug delivery - Market size and forecast 2023-2028
- Chart on Nanoparticle drug delivery - Market size and forecast 2023-2028 ($ billion)
- Data Table on Nanoparticle drug delivery - Market size and forecast 2023-2028 ($ billion)
- Chart on Nanoparticle drug delivery - Year-over-year growth 2023-2028 (%)
- Data Table on Nanoparticle drug delivery - Year-over-year growth 2023-2028 (%)
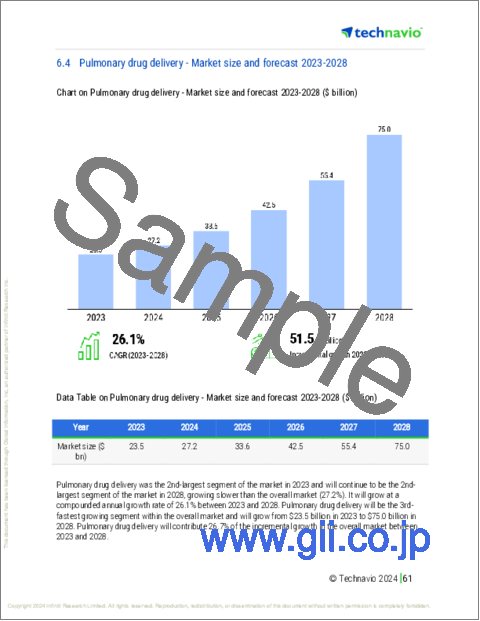
- 6.4 Pulmonary drug delivery - Market size and forecast 2023-2028
- Chart on Pulmonary drug delivery - Market size and forecast 2023-2028 ($ billion)
- Data Table on Pulmonary drug delivery - Market size and forecast 2023-2028 ($ billion)
- Chart on Pulmonary drug delivery - Year-over-year growth 2023-2028 (%)
- Data Table on Pulmonary drug delivery - Year-over-year growth 2023-2028 (%)
- 6.5 Nucleic acid drug delivery - Market size and forecast 2023-2028
- Chart on Nucleic acid drug delivery - Market size and forecast 2023-2028 ($ billion)
- Data Table on Nucleic acid drug delivery - Market size and forecast 2023-2028 ($ billion)
- Chart on Nucleic acid drug delivery - Year-over-year growth 2023-2028 (%)
- Data Table on Nucleic acid drug delivery - Year-over-year growth 2023-2028 (%)
- 6.6 Aptamer drug delivery - Market size and forecast 2023-2028
- Chart on Aptamer drug delivery - Market size and forecast 2023-2028 ($ billion)
- Data Table on Aptamer drug delivery - Market size and forecast 2023-2028 ($ billion)
- Chart on Aptamer drug delivery - Year-over-year growth 2023-2028 (%)
- Data Table on Aptamer drug delivery - Year-over-year growth 2023-2028 (%)
- 6.7 Market opportunity by Technology
- Market opportunity by Technology ($ billion)
- Data Table on Market opportunity by Technology ($ billion)
7 Market Segmentation by Application
- 7.1 Market segments
- Chart on Application - Market share 2023-2028 (%)
- Data Table on Application - Market share 2023-2028 (%)
- 7.2 Comparison by Application
- Chart on Comparison by Application
- Data Table on Comparison by Application
- 7.3 Infectious diseases - Market size and forecast 2023-2028
- Chart on Infectious diseases - Market size and forecast 2023-2028 ($ billion)
- Data Table on Infectious diseases - Market size and forecast 2023-2028 ($ billion)
- Chart on Infectious diseases - Year-over-year growth 2023-2028 (%)
- Data Table on Infectious diseases - Year-over-year growth 2023-2028 (%)
- 7.4 Oncology - Market size and forecast 2023-2028
- Chart on Oncology - Market size and forecast 2023-2028 ($ billion)
- Data Table on Oncology - Market size and forecast 2023-2028 ($ billion)
- Chart on Oncology - Year-over-year growth 2023-2028 (%)
- Data Table on Oncology - Year-over-year growth 2023-2028 (%)
- 7.5 Cardiology - Market size and forecast 2023-2028
- Chart on Cardiology - Market size and forecast 2023-2028 ($ billion)
- Data Table on Cardiology - Market size and forecast 2023-2028 ($ billion)
- Chart on Cardiology - Year-over-year growth 2023-2028 (%)
- Data Table on Cardiology - Year-over-year growth 2023-2028 (%)
- 7.6 Neurology - Market size and forecast 2023-2028
- Chart on Neurology - Market size and forecast 2023-2028 ($ billion)
- Data Table on Neurology - Market size and forecast 2023-2028 ($ billion)
- Chart on Neurology - Year-over-year growth 2023-2028 (%)
- Data Table on Neurology - Year-over-year growth 2023-2028 (%)
- 7.7 Others - Market size and forecast 2023-2028
- Chart on Others - Market size and forecast 2023-2028 ($ billion)
- Data Table on Others - Market size and forecast 2023-2028 ($ billion)
- Chart on Others - Year-over-year growth 2023-2028 (%)
- Data Table on Others - Year-over-year growth 2023-2028 (%)
- 7.8 Market opportunity by Application
- Market opportunity by Application ($ billion)
- Data Table on Market opportunity by Application ($ billion)
8 Customer Landscape
- 8.1 Customer landscape overview
- Analysis of price sensitivity, lifecycle, customer purchase basket, adoption rates, and purchase criteria
9 Geographic Landscape
- 9.1 Geographic segmentation
- Chart on Market share By Geographical Landscape 2023-2028 (%)
- Data Table on Market share By Geographical Landscape 2023-2028 (%)
- 9.2 Geographic comparison
- Chart on Geographic comparison
- Data Table on Geographic comparison
- 9.3 North America - Market size and forecast 2023-2028
- Chart on North America - Market size and forecast 2023-2028 ($ billion)
- Data Table on North America - Market size and forecast 2023-2028 ($ billion)
- Chart on North America - Year-over-year growth 2023-2028 (%)
- Data Table on North America - Year-over-year growth 2023-2028 (%)
- 9.4 Europe - Market size and forecast 2023-2028
- Chart on Europe - Market size and forecast 2023-2028 ($ billion)
- Data Table on Europe - Market size and forecast 2023-2028 ($ billion)
- Chart on Europe - Year-over-year growth 2023-2028 (%)
- Data Table on Europe - Year-over-year growth 2023-2028 (%)
- 9.5 Asia - Market size and forecast 2023-2028
- Chart on Asia - Market size and forecast 2023-2028 ($ billion)
- Data Table on Asia - Market size and forecast 2023-2028 ($ billion)
- Chart on Asia - Year-over-year growth 2023-2028 (%)
- Data Table on Asia - Year-over-year growth 2023-2028 (%)
- 9.6 Rest of World (ROW) - Market size and forecast 2023-2028
- Chart on Rest of World (ROW) - Market size and forecast 2023-2028 ($ billion)
- Data Table on Rest of World (ROW) - Market size and forecast 2023-2028 ($ billion)
- Chart on Rest of World (ROW) - Year-over-year growth 2023-2028 (%)
- Data Table on Rest of World (ROW) - Year-over-year growth 2023-2028 (%)
- 9.7 US - Market size and forecast 2023-2028
- Chart on US - Market size and forecast 2023-2028 ($ billion)
- Data Table on US - Market size and forecast 2023-2028 ($ billion)
- Chart on US - Year-over-year growth 2023-2028 (%)
- Data Table on US - Year-over-year growth 2023-2028 (%)
- 9.8 UK - Market size and forecast 2023-2028
- Chart on UK - Market size and forecast 2023-2028 ($ billion)
- Data Table on UK - Market size and forecast 2023-2028 ($ billion)
- Chart on UK - Year-over-year growth 2023-2028 (%)
- Data Table on UK - Year-over-year growth 2023-2028 (%)
- 9.9 Germany - Market size and forecast 2023-2028
- Chart on Germany - Market size and forecast 2023-2028 ($ billion)
- Data Table on Germany - Market size and forecast 2023-2028 ($ billion)
- Chart on Germany - Year-over-year growth 2023-2028 (%)
- Data Table on Germany - Year-over-year growth 2023-2028 (%)
- 9.10 China - Market size and forecast 2023-2028
- Chart on China - Market size and forecast 2023-2028 ($ billion)
- Data Table on China - Market size and forecast 2023-2028 ($ billion)
- Chart on China - Year-over-year growth 2023-2028 (%)
- Data Table on China - Year-over-year growth 2023-2028 (%)
- 9.11 Canada - Market size and forecast 2023-2028
- Chart on Canada - Market size and forecast 2023-2028 ($ billion)
- Data Table on Canada - Market size and forecast 2023-2028 ($ billion)
- Chart on Canada - Year-over-year growth 2023-2028 (%)
- Data Table on Canada - Year-over-year growth 2023-2028 (%)
- 9.12 Market opportunity By Geographical Landscape
- Market opportunity By Geographical Landscape ($ billion)
- Data Tables on Market opportunity By Geographical Landscape ($ billion)
10 Drivers, Challenges, and Opportunity/Restraints
- 10.1 Market drivers
- 10.2 Market challenges
- 10.3 Impact of drivers and challenges
- Impact of drivers and challenges in 2023 and 2028
- 10.4 Market opportunities/restraints
11 Competitive Landscape
- 11.1 Overview
- 11.2 Competitive Landscape
- Overview on criticality of inputs and factors of differentiation
- 11.3 Landscape disruption
- Overview on factors of disruption
- 11.4 Industry risks
- Impact of key risks on business
12 Competitive Analysis
- 12.1 Companies profiled
- Companies covered
- 12.2 Market positioning of companies
- Matrix on companies position and classification
- 12.3 Alnylam Pharmaceuticals Inc.
- Alnylam Pharmaceuticals Inc. - Overview
- Alnylam Pharmaceuticals Inc. - Product / Service
- Alnylam Pharmaceuticals Inc. - Key news
- Alnylam Pharmaceuticals Inc. - Key offerings
- 12.4 Arbutus Biopharma Corp.
- Arbutus Biopharma Corp. - Overview
- Arbutus Biopharma Corp. - Product / Service
- Arbutus Biopharma Corp. - Key offerings
- 12.5 Arrowhead Pharmaceuticals Inc.
- Arrowhead Pharmaceuticals Inc. - Overview
- Arrowhead Pharmaceuticals Inc. - Business segments
- Arrowhead Pharmaceuticals Inc. - Key offerings
- Arrowhead Pharmaceuticals Inc. - Segment focus
- 12.6 Bayer AG
- Bayer AG - Overview
- Bayer AG - Business segments
- Bayer AG - Key news
- Bayer AG - Key offerings
- Bayer AG - Segment focus
- 12.7 BioNTech SE
- BioNTech SE - Overview
- BioNTech SE - Product / Service
- BioNTech SE - Key offerings
- 12.8 Bristol Myers Squibb Co.
- Bristol Myers Squibb Co. - Overview
- Bristol Myers Squibb Co. - Product / Service
- Bristol Myers Squibb Co. - Key news
- Bristol Myers Squibb Co. - Key offerings
- 12.9 F. Hoffmann La Roche Ltd.
- F. Hoffmann La Roche Ltd. - Overview
- F. Hoffmann La Roche Ltd. - Business segments
- F. Hoffmann La Roche Ltd. - Key news
- F. Hoffmann La Roche Ltd. - Key offerings
- F. Hoffmann La Roche Ltd. - Segment focus
- 12.10 Novartis AG
- Novartis AG - Overview
- Novartis AG - Business segments
- Novartis AG - Key news
- Novartis AG - Key offerings
- Novartis AG - Segment focus
- 12.11 Novo Nordisk AS
- Novo Nordisk AS - Overview
- Novo Nordisk AS - Business segments
- Novo Nordisk AS - Key news
- Novo Nordisk AS - Key offerings
- Novo Nordisk AS - Segment focus
- 12.12 Phio Pharmaceuticals
- Phio Pharmaceuticals - Overview
- Phio Pharmaceuticals - Product / Service
- Phio Pharmaceuticals - Key offerings
- 12.13 Sanofi SA
- Sanofi SA - Overview
- Sanofi SA - Business segments
- Sanofi SA - Key news
- Sanofi SA - Key offerings
- Sanofi SA - Segment focus
- 12.14 Silence Therapeutics plc
- Silence Therapeutics plc - Overview
- Silence Therapeutics plc - Product / Service
- Silence Therapeutics plc - Key offerings
- 12.15 Sirnaomics Inc.
- Sirnaomics Inc. - Overview
- Sirnaomics Inc. - Product / Service
- Sirnaomics Inc. - Key offerings
- 12.16 Sylentis S.A.
- Sylentis S.A. - Overview
- Sylentis S.A. - Product / Service
- Sylentis S.A. - Key offerings
- 12.17 Thermo Fisher Scientific Inc.
- Thermo Fisher Scientific Inc. - Overview
- Thermo Fisher Scientific Inc. - Business segments
- Thermo Fisher Scientific Inc. - Key news
- Thermo Fisher Scientific Inc. - Key offerings
- Thermo Fisher Scientific Inc. - Segment focus
13 Appendix
- 13.1 Scope of the report
- 13.2 Inclusions and exclusions checklist
- Inclusions checklist
- Exclusions checklist
- 13.3 Currency conversion rates for US$
- Currency conversion rates for US$
- 13.4 Research methodology
- Research methodology
- 13.5 Data procurement
- Information sources
- 13.6 Data validation
- Data validation
- 13.7 Validation techniques employed for market sizing
- Validation techniques employed for market sizing
- 13.8 Data synthesis
- Data synthesis
- 13.9 360 degree market analysis
- 360 degree market analysis
- 13.10 List of abbreviations
- List of abbreviations

