|
|
市場調査レポート
商品コード
1544267
非黒色腫皮膚がんの世界市場 2024-2028Global Non-melanoma Skin Cancer Market 2024-2028 |
||||||

|
|||||||
カスタマイズ可能
|
|||||||

| 非黒色腫皮膚がんの世界市場 2024-2028 |
|
出版日: 2024年07月22日
発行: TechNavio
ページ情報: 英文 145 Pages
納期: 即納可能
|

全表示
- 概要
- 図表
- 目次
非黒色腫皮膚がん(NMSC)市場は2023-2028年に1億3,690万米ドル、予測期間中のCAGRは4.5%で成長すると予測されます。
当レポートでは、非黒色腫皮膚がん市場の全体的な分析、市場規模・予測、動向、成長促進要因、課題、約25のベンダーを網羅したベンダー分析などを掲載しています。
現在の市場シナリオ、最新動向と促進要因、市場環境全体に関する最新分析を提供しています。市場は、NMSCの報道と支援、皮膚がんに関する認知度の向上、組織によるイニシアチブの拡大が牽引しています。
| 市場範囲 | |
|---|---|
| 基準年 | 2024 |
| 終了年 | 2028 |
| 予測期間 | 2024-2028 |
| 成長モメンタム | 加速 |
| 前年比2024年 | 4.22% |
| CAGR | 4.5% |
| 増分額 | 1億3,690万米ドル |
本調査では、今後数年間の非黒色腫皮膚がん市場成長を牽引する主要因の1つとして、NMSCの罹患率の増加を挙げています。また、手術がNMSCの第一選択の治療法と考えられていることや、NMSCに対する局所治療の適応外使用が多いことも、市場の大きな需要につながると思われます。
目次
第1章 エグゼクティブサマリー
- 市場概要
第2章 市場情勢
- 市場エコシステム
- 市場の特徴
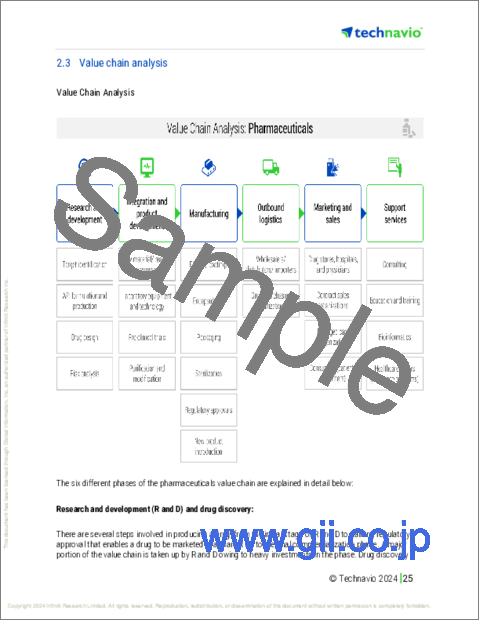
- バリューチェーン分析
第3章 市場規模の評価
- 市場の定義
- 市場セグメント分析
- 市場規模 2023
- 市場の見通し 2023-2028
第4章 市場規模実績
- 非黒色腫皮膚がんの世界市場 2018-2022
- タイプ別セグメント分析 2018-2022
- 地域別セグメント分析 2018-2022
- 国別セグメント分析 2018-2022
第5章 ファイブフォース分析
- ファイブフォースの要約
- 買い手の交渉力
- 供給企業の交渉力
- 新規参入業者の脅威
- 代替品の脅威
- 競争の脅威
- 市況
第6章 市場セグメンテーション:タイプ別
- 市場セグメンテーション
- 比較:タイプ別
- BCC(基底細胞癌):市場規模と予測 2023-2028
- SCC(有棘細胞癌):市場規模と予測 2023-2028
- 市場機会:タイプ別
第7章 顧客情勢
- 顧客情勢の概要
第8章 地域別情勢
- 地域別セグメンテーション
- 地域別比較
- 北米:市場規模と予測 2023-2028
- 欧州:市場規模と予測 2023-2028
- アジア:市場規模と予測 2023-2028
- 世界のその他の地域:市場規模と予測 2023-2028
- 米国:市場規模と予測 2023-2028
- カナダ:市場規模と予測 2023-2028
- 英国:市場規模と予測 2023-2028
- ドイツ:市場規模と予測 2023-2028
- 日本:市場規模と予測 2023-2028
- 中国:市場規模と予測 2023-2028
- 市場機会:地域情勢別
第9章 促進要因・課題・機会・抑制要因
- 市場促進要因
- 市場の課題
- 促進要因と課題の影響
- 市場の機会・抑制要因
第10章 競合情勢
- 概要
- 競合情勢
- 混乱の状況
- 業界のリスク
第11章 競合分析
- 企業プロファイル
- 企業の市場ポジショニング
- Almirall SA
- Bausch Health Companies Inc.
- Bristol Myers Squibb Co.
- Elekta AB
- F. Hoffmann La Roche Ltd.
- Sun Pharmaceutical Industries Ltd.
- Varian Medical Systems Inc.
- Viatris Inc.
- Vidac Pharma
第12章 付録
Exhibits:
- Exhibits1: Executive Summary - Chart on Market Overview
- Exhibits2: Executive Summary - Data Table on Market Overview
- Exhibits3: Executive Summary - Chart on Global Market Characteristics
- Exhibits4: Executive Summary - Chart on Market By Geographical Landscape
- Exhibits5: Executive Summary - Chart on Market Segmentation by Type
- Exhibits6: Executive Summary - Chart on Incremental Growth
- Exhibits7: Executive Summary - Data Table on Incremental Growth
- Exhibits8: Executive Summary - Chart on Company Market Positioning
- Exhibits9: Parent Market
- Exhibits10: Data Table on - Parent Market
- Exhibits11: Market characteristics analysis
- Exhibits12: Value Chain Analysis
- Exhibits13: Offerings of companies included in the market definition
- Exhibits14: Market segments
- Exhibits15: Chart on Global - Market size and forecast 2023-2028 ($ million)
- Exhibits16: Data Table on Global - Market size and forecast 2023-2028 ($ million)
- Exhibits17: Chart on Global Market: Year-over-year growth 2023-2028 (%)
- Exhibits18: Data Table on Global Market: Year-over-year growth 2023-2028 (%)
- Exhibits19: Historic Market Size - Data Table on Global Non-Melanoma Skin Cancer Market 2018 - 2022 ($ million)
- Exhibits20: Historic Market Size - Type Segment 2018 - 2022 ($ million)
- Exhibits21: Historic Market Size - Geography Segment 2018 - 2022 ($ million)
- Exhibits22: Historic Market Size - Country Segment 2018 - 2022 ($ million)
- Exhibits23: Five forces analysis - Comparison between 2023 and 2028
- Exhibits24: Bargaining power of buyers - Impact of key factors 2023 and 2028
- Exhibits25: Bargaining power of suppliers - Impact of key factors in 2023 and 2028
- Exhibits26: Threat of new entrants - Impact of key factors in 2023 and 2028
- Exhibits27: Threat of substitutes - Impact of key factors in 2023 and 2028
- Exhibits28: Threat of rivalry - Impact of key factors in 2023 and 2028
- Exhibits29: Chart on Market condition - Five forces 2023 and 2028
- Exhibits30: Chart on Type - Market share 2023-2028 (%)
- Exhibits31: Data Table on Type - Market share 2023-2028 (%)
- Exhibits32: Chart on Comparison by Type
- Exhibits33: Data Table on Comparison by Type
- Exhibits34: Chart on BCC - Market size and forecast 2023-2028 ($ million)
- Exhibits35: Data Table on BCC - Market size and forecast 2023-2028 ($ million)
- Exhibits36: Chart on BCC - Year-over-year growth 2023-2028 (%)
- Exhibits37: Data Table on BCC - Year-over-year growth 2023-2028 (%)
- Exhibits38: Chart on SCC - Market size and forecast 2023-2028 ($ million)
- Exhibits39: Data Table on SCC - Market size and forecast 2023-2028 ($ million)
- Exhibits40: Chart on SCC - Year-over-year growth 2023-2028 (%)
- Exhibits41: Data Table on SCC - Year-over-year growth 2023-2028 (%)
- Exhibits42: Market opportunity by Type ($ million)
- Exhibits43: Data Table on Market opportunity by Type ($ million)
- Exhibits44: Analysis of price sensitivity, lifecycle, customer purchase basket, adoption rates, and purchase criteria
- Exhibits45: Chart on Market share By Geographical Landscape 2023-2028 (%)
- Exhibits46: Data Table on Market share By Geographical Landscape 2023-2028 (%)
- Exhibits47: Chart on Geographic comparison
- Exhibits48: Data Table on Geographic comparison
- Exhibits49: Chart on North America - Market size and forecast 2023-2028 ($ million)
- Exhibits50: Data Table on North America - Market size and forecast 2023-2028 ($ million)
- Exhibits51: Chart on North America - Year-over-year growth 2023-2028 (%)
- Exhibits52: Data Table on North America - Year-over-year growth 2023-2028 (%)
- Exhibits53: Chart on Europe - Market size and forecast 2023-2028 ($ million)
- Exhibits54: Data Table on Europe - Market size and forecast 2023-2028 ($ million)
- Exhibits55: Chart on Europe - Year-over-year growth 2023-2028 (%)
- Exhibits56: Data Table on Europe - Year-over-year growth 2023-2028 (%)
- Exhibits57: Chart on Asia - Market size and forecast 2023-2028 ($ million)
- Exhibits58: Data Table on Asia - Market size and forecast 2023-2028 ($ million)
- Exhibits59: Chart on Asia - Year-over-year growth 2023-2028 (%)
- Exhibits60: Data Table on Asia - Year-over-year growth 2023-2028 (%)
- Exhibits61: Chart on Rest of World (ROW) - Market size and forecast 2023-2028 ($ million)
- Exhibits62: Data Table on Rest of World (ROW) - Market size and forecast 2023-2028 ($ million)
- Exhibits63: Chart on Rest of World (ROW) - Year-over-year growth 2023-2028 (%)
- Exhibits64: Data Table on Rest of World (ROW) - Year-over-year growth 2023-2028 (%)
- Exhibits65: Chart on US - Market size and forecast 2023-2028 ($ million)
- Exhibits66: Data Table on US - Market size and forecast 2023-2028 ($ million)
- Exhibits67: Chart on US - Year-over-year growth 2023-2028 (%)
- Exhibits68: Data Table on US - Year-over-year growth 2023-2028 (%)
- Exhibits69: Chart on Canada - Market size and forecast 2023-2028 ($ million)
- Exhibits70: Data Table on Canada - Market size and forecast 2023-2028 ($ million)
- Exhibits71: Chart on Canada - Year-over-year growth 2023-2028 (%)
- Exhibits72: Data Table on Canada - Year-over-year growth 2023-2028 (%)
- Exhibits73: Chart on UK - Market size and forecast 2023-2028 ($ million)
- Exhibits74: Data Table on UK - Market size and forecast 2023-2028 ($ million)
- Exhibits75: Chart on UK - Year-over-year growth 2023-2028 (%)
- Exhibits76: Data Table on UK - Year-over-year growth 2023-2028 (%)
- Exhibits77: Chart on Germany - Market size and forecast 2023-2028 ($ million)
- Exhibits78: Data Table on Germany - Market size and forecast 2023-2028 ($ million)
- Exhibits79: Chart on Germany - Year-over-year growth 2023-2028 (%)
- Exhibits80: Data Table on Germany - Year-over-year growth 2023-2028 (%)
- Exhibits81: Chart on Japan - Market size and forecast 2023-2028 ($ million)
- Exhibits82: Data Table on Japan - Market size and forecast 2023-2028 ($ million)
- Exhibits83: Chart on Japan - Year-over-year growth 2023-2028 (%)
- Exhibits84: Data Table on Japan - Year-over-year growth 2023-2028 (%)
- Exhibits85: Chart on China - Market size and forecast 2023-2028 ($ million)
- Exhibits86: Data Table on China - Market size and forecast 2023-2028 ($ million)
- Exhibits87: Chart on China - Year-over-year growth 2023-2028 (%)
- Exhibits88: Data Table on China - Year-over-year growth 2023-2028 (%)
- Exhibits89: Market opportunity By Geographical Landscape ($ million)
- Exhibits90: Data Tables on Market opportunity By Geographical Landscape ($ million)
- Exhibits91: Impact of drivers and challenges in 2023 and 2028
- Exhibits92: Overview on criticality of inputs and factors of differentiation
- Exhibits93: Overview on factors of disruption
- Exhibits94: Impact of key risks on business
- Exhibits95: Companies covered
- Exhibits96: Matrix on companies position and classification
- Exhibits97: 3M Co. - Overview
- Exhibits98: 3M Co. - Business segments
- Exhibits99: 3M Co. - Key news
- Exhibits100: 3M Co. - Key offerings
- Exhibits101: 3M Co. - Segment focus
- Exhibits102: Almirall SA - Overview
- Exhibits103: Almirall SA - Product / Service
- Exhibits104: Almirall SA - Key news
- Exhibits105: Almirall SA - Key offerings
- Exhibits106: Bausch Health Companies Inc. - Overview
- Exhibits107: Bausch Health Companies Inc. - Business segments
- Exhibits108: Bausch Health Companies Inc. - Key news
- Exhibits109: Bausch Health Companies Inc. - Key offerings
- Exhibits110: Bausch Health Companies Inc. - Segment focus
- Exhibits111: Bristol Myers Squibb Co. - Overview
- Exhibits112: Bristol Myers Squibb Co. - Product / Service
- Exhibits113: Bristol Myers Squibb Co. - Key news
- Exhibits114: Bristol Myers Squibb Co. - Key offerings
- Exhibits115: Elekta AB - Overview
- Exhibits116: Elekta AB - Business segments
- Exhibits117: Elekta AB - Key offerings
- Exhibits118: Elekta AB - Segment focus
- Exhibits119: F. Hoffmann La Roche Ltd. - Overview
- Exhibits120: F. Hoffmann La Roche Ltd. - Business segments
- Exhibits121: F. Hoffmann La Roche Ltd. - Key news
- Exhibits122: F. Hoffmann La Roche Ltd. - Key offerings
- Exhibits123: F. Hoffmann La Roche Ltd. - Segment focus
- Exhibits124: Sun Pharmaceutical Industries Ltd. - Overview
- Exhibits125: Sun Pharmaceutical Industries Ltd. - Product / Service
- Exhibits126: Sun Pharmaceutical Industries Ltd. - Key news
- Exhibits127: Sun Pharmaceutical Industries Ltd. - Key offerings
- Exhibits128: Varian Medical Systems Inc. - Overview
- Exhibits129: Varian Medical Systems Inc. - Product / Service
- Exhibits130: Varian Medical Systems Inc. - Key offerings
- Exhibits131: Viatris Inc. - Overview
- Exhibits132: Viatris Inc. - Business segments
- Exhibits133: Viatris Inc. - Key news
- Exhibits134: Viatris Inc. - Key offerings
- Exhibits135: Viatris Inc. - Segment focus
- Exhibits136: Vidac Pharma - Overview
- Exhibits137: Vidac Pharma - Product / Service
- Exhibits138: Vidac Pharma - Key offerings
- Exhibits139: Inclusions checklist
- Exhibits140: Exclusions checklist
- Exhibits141: Currency conversion rates for US$
- Exhibits142: Research methodology
- Exhibits143: Information sources
- Exhibits144: Data validation
- Exhibits145: Validation techniques employed for market sizing
- Exhibits146: Data synthesis
- Exhibits147: 360 degree market analysis
- Exhibits148: List of abbreviations
The non-melanoma skin cancer market is forecasted to grow by USD 136.9 mn during 2023-2028, accelerating at a CAGR of 4.5% during the forecast period. The report on the non-melanoma skin cancer market provides a holistic analysis, market size and forecast, trends, growth drivers, and challenges, as well as vendor analysis covering around 25 vendors.
The report offers an up-to-date analysis regarding the current market scenario, the latest trends and drivers, and the overall market environment. The market is driven by NMSC coverage and support, increase in awareness about skin cancer, and growing initiatives by organizations.
Technavio's non-melanoma skin cancer market is segmented as below:
| Market Scope | |
|---|---|
| Base Year | 2024 |
| End Year | 2028 |
| Series Year | 2024-2028 |
| Growth Momentum | Accelerate |
| YOY 2024 | 4.22% |
| CAGR | 4.5% |
| Incremental Value | $136.9 mn |
By Type
- BCC
- SCC
By Geographical Landscape
- North America
- Europe
- Asia
- Rest of World (ROW)
This study identifies the increasing incidence of NMSC as one of the prime reasons driving the non-melanoma skin cancer market growth during the next few years. Also, surgery considered as first-line curative approach for NMSC and high off-label use of topical treatments for NMSC will lead to sizable demand in the market.
The report on the non-melanoma skin cancer market covers the following areas:
- Non-melanoma skin cancer market sizing
- Non-melanoma skin cancer market forecast
- Non-melanoma skin cancer market industry analysis
The robust vendor analysis is designed to help clients improve their market position, and in line with this, this report provides a detailed analysis of several leading non-melanoma skin cancer market vendors that include 3M Co., Almirall SA, Amgen Inc., Bausch Health Companies Inc., Bristol Myers Squibb Co., Elekta AB, Eli Lilly and Co., F. Hoffmann La Roche Ltd., GlaxoSmithKline PLC, iCAD Inc., Merck and Co. Inc., Novartis AG, Pfizer Inc., Sensus Healthcare Inc., Sun Pharmaceutical Industries Ltd., Varian Medical Systems Inc., Viatris Inc., and Vidac Pharma. Also, the non-melanoma skin cancer market analysis report includes information on upcoming trends and challenges that will influence market growth. This is to help companies strategize and leverage all forthcoming growth opportunities.
The study was conducted using an objective combination of primary and secondary information including inputs from key participants in the industry. The report contains a comprehensive market and vendor landscape in addition to an analysis of the key vendors.
The publisher presents a detailed picture of the market by the way of study, synthesis, and summation of data from multiple sources by an analysis of key parameters such as profit, pricing, competition, and promotions. It presents various market facets by identifying the key industry influencers. The data presented is comprehensive, reliable, and a result of extensive research - both primary and secondary. The market research reports provide a complete competitive landscape and an in-depth vendor selection methodology and analysis using qualitative and quantitative research to forecast the accurate market growth.
Table of Contents
1 Executive Summary
- 1.1 Market overview
- Executive Summary - Chart on Market Overview
- Executive Summary - Data Table on Market Overview
- Executive Summary - Chart on Global Market Characteristics
- Executive Summary - Chart on Market By Geographical Landscape
- Executive Summary - Chart on Market Segmentation by Type
- Executive Summary - Chart on Incremental Growth
- Executive Summary - Data Table on Incremental Growth
- Executive Summary - Chart on Company Market Positioning
2 Market Landscape
- 2.1 Market ecosystem
- Parent Market
- Data Table on - Parent Market
- 2.2 Market characteristics
- Market characteristics analysis
- 2.3 Value chain analysis
- Value Chain Analysis
3 Market Sizing
- 3.1 Market definition
- Offerings of companies included in the market definition
- 3.2 Market segment analysis
- Market segments
- 3.3 Market size 2023
- 3.4 Market outlook: Forecast for 2023-2028
- Chart on Global - Market size and forecast 2023-2028 ($ million)
- Data Table on Global - Market size and forecast 2023-2028 ($ million)
- Chart on Global Market: Year-over-year growth 2023-2028 (%)
- Data Table on Global Market: Year-over-year growth 2023-2028 (%)
4 Historic Market Size
- 4.1 Global Non-Melanoma Skin Cancer Market 2018 - 2022
- Historic Market Size - Data Table on Global Non-Melanoma Skin Cancer Market 2018 - 2022 ($ million)
- 4.2 Type segment analysis 2018 - 2022
- Historic Market Size - Type Segment 2018 - 2022 ($ million)
- 4.3 Geography segment analysis 2018 - 2022
- Historic Market Size - Geography Segment 2018 - 2022 ($ million)
- 4.4 Country segment analysis 2018 - 2022
- Historic Market Size - Country Segment 2018 - 2022 ($ million)
5 Five Forces Analysis
- 5.1 Five forces summary
- Five forces analysis - Comparison between 2023 and 2028
- 5.2 Bargaining power of buyers
- Bargaining power of buyers - Impact of key factors 2023 and 2028
- 5.3 Bargaining power of suppliers
- Bargaining power of suppliers - Impact of key factors in 2023 and 2028
- 5.4 Threat of new entrants
- Threat of new entrants - Impact of key factors in 2023 and 2028
- 5.5 Threat of substitutes
- Threat of substitutes - Impact of key factors in 2023 and 2028
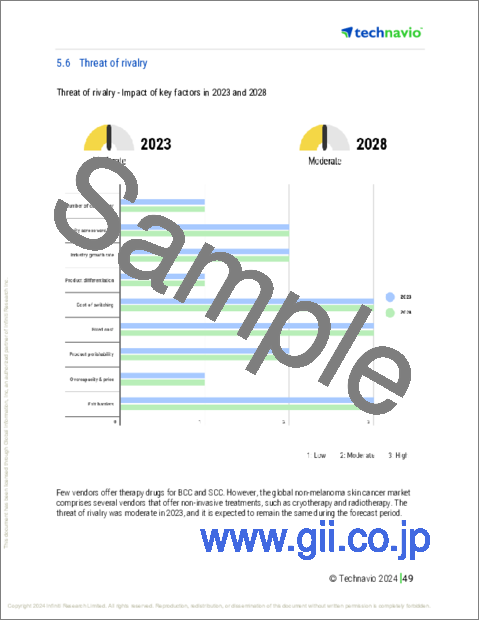
- 5.6 Threat of rivalry
- Threat of rivalry - Impact of key factors in 2023 and 2028
- 5.7 Market condition
- Chart on Market condition - Five forces 2023 and 2028
6 Market Segmentation by Type
- 6.1 Market segments
- Chart on Type - Market share 2023-2028 (%)
- Data Table on Type - Market share 2023-2028 (%)
- 6.2 Comparison by Type
- Chart on Comparison by Type
- Data Table on Comparison by Type
- 6.3 BCC - Market size and forecast 2023-2028
- Chart on BCC - Market size and forecast 2023-2028 ($ million)
- Data Table on BCC - Market size and forecast 2023-2028 ($ million)
- Chart on BCC - Year-over-year growth 2023-2028 (%)
- Data Table on BCC - Year-over-year growth 2023-2028 (%)
- 6.4 SCC - Market size and forecast 2023-2028
- Chart on SCC - Market size and forecast 2023-2028 ($ million)
- Data Table on SCC - Market size and forecast 2023-2028 ($ million)
- Chart on SCC - Year-over-year growth 2023-2028 (%)
- Data Table on SCC - Year-over-year growth 2023-2028 (%)
- 6.5 Market opportunity by Type
- Market opportunity by Type ($ million)
- Data Table on Market opportunity by Type ($ million)
7 Customer Landscape
- 7.1 Customer landscape overview
- Analysis of price sensitivity, lifecycle, customer purchase basket, adoption rates, and purchase criteria
8 Geographic Landscape
- 8.1 Geographic segmentation
- Chart on Market share By Geographical Landscape 2023-2028 (%)
- Data Table on Market share By Geographical Landscape 2023-2028 (%)
- 8.2 Geographic comparison
- Chart on Geographic comparison
- Data Table on Geographic comparison
- 8.3 North America - Market size and forecast 2023-2028
- Chart on North America - Market size and forecast 2023-2028 ($ million)
- Data Table on North America - Market size and forecast 2023-2028 ($ million)
- Chart on North America - Year-over-year growth 2023-2028 (%)
- Data Table on North America - Year-over-year growth 2023-2028 (%)
- 8.4 Europe - Market size and forecast 2023-2028
- Chart on Europe - Market size and forecast 2023-2028 ($ million)
- Data Table on Europe - Market size and forecast 2023-2028 ($ million)
- Chart on Europe - Year-over-year growth 2023-2028 (%)
- Data Table on Europe - Year-over-year growth 2023-2028 (%)
- 8.5 Asia - Market size and forecast 2023-2028
- Chart on Asia - Market size and forecast 2023-2028 ($ million)
- Data Table on Asia - Market size and forecast 2023-2028 ($ million)
- Chart on Asia - Year-over-year growth 2023-2028 (%)
- Data Table on Asia - Year-over-year growth 2023-2028 (%)
- 8.6 Rest of World (ROW) - Market size and forecast 2023-2028
- Chart on Rest of World (ROW) - Market size and forecast 2023-2028 ($ million)
- Data Table on Rest of World (ROW) - Market size and forecast 2023-2028 ($ million)
- Chart on Rest of World (ROW) - Year-over-year growth 2023-2028 (%)
- Data Table on Rest of World (ROW) - Year-over-year growth 2023-2028 (%)
- 8.7 US - Market size and forecast 2023-2028
- Chart on US - Market size and forecast 2023-2028 ($ million)
- Data Table on US - Market size and forecast 2023-2028 ($ million)
- Chart on US - Year-over-year growth 2023-2028 (%)
- Data Table on US - Year-over-year growth 2023-2028 (%)
- 8.8 Canada - Market size and forecast 2023-2028
- Chart on Canada - Market size and forecast 2023-2028 ($ million)
- Data Table on Canada - Market size and forecast 2023-2028 ($ million)
- Chart on Canada - Year-over-year growth 2023-2028 (%)
- Data Table on Canada - Year-over-year growth 2023-2028 (%)
- 8.9 UK - Market size and forecast 2023-2028
- Chart on UK - Market size and forecast 2023-2028 ($ million)
- Data Table on UK - Market size and forecast 2023-2028 ($ million)
- Chart on UK - Year-over-year growth 2023-2028 (%)
- Data Table on UK - Year-over-year growth 2023-2028 (%)
- 8.10 Germany - Market size and forecast 2023-2028
- Chart on Germany - Market size and forecast 2023-2028 ($ million)
- Data Table on Germany - Market size and forecast 2023-2028 ($ million)
- Chart on Germany - Year-over-year growth 2023-2028 (%)
- Data Table on Germany - Year-over-year growth 2023-2028 (%)
- 8.11 Japan - Market size and forecast 2023-2028
- Chart on Japan - Market size and forecast 2023-2028 ($ million)
- Data Table on Japan - Market size and forecast 2023-2028 ($ million)
- Chart on Japan - Year-over-year growth 2023-2028 (%)
- Data Table on Japan - Year-over-year growth 2023-2028 (%)
- 8.12 China - Market size and forecast 2023-2028
- Chart on China - Market size and forecast 2023-2028 ($ million)
- Data Table on China - Market size and forecast 2023-2028 ($ million)
- Chart on China - Year-over-year growth 2023-2028 (%)
- Data Table on China - Year-over-year growth 2023-2028 (%)
- 8.13 Market opportunity By Geographical Landscape
- Market opportunity By Geographical Landscape ($ million)
- Data Tables on Market opportunity By Geographical Landscape ($ million)
9 Drivers, Challenges, and Opportunity/Restraints
- 9.1 Market drivers
- 9.2 Market challenges
- 9.3 Impact of drivers and challenges
- Impact of drivers and challenges in 2023 and 2028
- 9.4 Market opportunities/restraints
10 Competitive Landscape
- 10.1 Overview
- 10.2 Competitive Landscape
- Overview on criticality of inputs and factors of differentiation
- 10.3 Landscape disruption
- Overview on factors of disruption
- 10.4 Industry risks
- Impact of key risks on business
11 Competitive Analysis
- 11.1 Companies profiled
- Companies covered
- 11.2 Market positioning of companies
- Matrix on companies position and classification
- 3M Co.
- 3M Co. - Overview
- 3M Co. - Business segments
- 3M Co. - Key news
- 3M Co. - Key offerings
- 3M Co. - Segment focus
- 11.4 Almirall SA
- Almirall SA - Overview
- Almirall SA - Product / Service
- Almirall SA - Key news
- Almirall SA - Key offerings
- 11.5 Bausch Health Companies Inc.
- Bausch Health Companies Inc. - Overview
- Bausch Health Companies Inc. - Business segments
- Bausch Health Companies Inc. - Key news
- Bausch Health Companies Inc. - Key offerings
- Bausch Health Companies Inc. - Segment focus
- 11.6 Bristol Myers Squibb Co.
- Bristol Myers Squibb Co. - Overview
- Bristol Myers Squibb Co. - Product / Service
- Bristol Myers Squibb Co. - Key news
- Bristol Myers Squibb Co. - Key offerings
- 11.7 Elekta AB
- Elekta AB - Overview
- Elekta AB - Business segments
- Elekta AB - Key offerings
- Elekta AB - Segment focus
- 11.8 F. Hoffmann La Roche Ltd.
- F. Hoffmann La Roche Ltd. - Overview
- F. Hoffmann La Roche Ltd. - Business segments
- F. Hoffmann La Roche Ltd. - Key news
- F. Hoffmann La Roche Ltd. - Key offerings
- F. Hoffmann La Roche Ltd. - Segment focus
- 11.9 Sun Pharmaceutical Industries Ltd.
- Sun Pharmaceutical Industries Ltd. - Overview
- Sun Pharmaceutical Industries Ltd. - Product / Service
- Sun Pharmaceutical Industries Ltd. - Key news
- Sun Pharmaceutical Industries Ltd. - Key offerings
- 11.10 Varian Medical Systems Inc.
- Varian Medical Systems Inc. - Overview
- Varian Medical Systems Inc. - Product / Service
- Varian Medical Systems Inc. - Key offerings
- 11.11 Viatris Inc.
- Viatris Inc. - Overview
- Viatris Inc. - Business segments
- Viatris Inc. - Key news
- Viatris Inc. - Key offerings
- Viatris Inc. - Segment focus
- 11.12 Vidac Pharma
- Vidac Pharma - Overview
- Vidac Pharma - Product / Service
- Vidac Pharma - Key offerings
12 Appendix
- 12.1 Scope of the report
- 12.2 Inclusions and exclusions checklist
- Inclusions checklist
- Exclusions checklist
- 12.3 Currency conversion rates for US$
- Currency conversion rates for US$
- 12.4 Research methodology
- Research methodology
- 12.5 Data procurement
- Information sources
- 12.6 Data validation
- Data validation
- 12.7 Validation techniques employed for market sizing
- Validation techniques employed for market sizing
- 12.8 Data synthesis
- Data synthesis
- 12.9 360 degree market analysis
- 360 degree market analysis
- 12.10 List of abbreviations
- List of abbreviations

