|
|
市場調査レポート
商品コード
1544203
養殖用ケージの世界市場、2024~2028年Global Aquaculture Cages Market 2024-2028 |
||||||
|
|||||||
カスタマイズ可能
|
|||||||

| 養殖用ケージの世界市場、2024~2028年 |
|
出版日: 2024年07月22日
発行: TechNavio
ページ情報: 英文 170 Pages
納期: 即納可能
|

全表示
- 概要
- 図表
- 目次
養殖用ケージ市場は2023~2028年に9,200万米ドル、予測期間中のCAGRは6.03%で成長すると予測されます。
当レポートでは、養殖用ケージ市場の全体的な分析、市場規模・予測、動向、成長促進要因、課題、約25のベンダーを網羅したベンダー分析などを掲載しています。
現在の市場シナリオ、最新動向と促進要因、市場環境全体に関する最新分析を提供しています。市場は、栄養豊富な魚や魚製品に対する消費者の志向の高まり、持続不可能な漁法による魚資源の減少、認証された養殖用ケージに対するエンドユーザーの志向の高まりによって牽引されています。
| 市場範囲 | |
|---|---|
| 基準年 | 2024年 |
| 終了年 | 2028年 |
| 予測期間 | 2024~2028年 |
| 成長モメンタム | 加速 |
| 前年比[2024年] | 5.7% |
| CAGR | 6.03% |
| 増分額 | 9,200万米ドル |
本調査では、今後数年間の養殖用ケージ市場成長を促進する主要理由の一つとして、エンドユーザーの間でHDPE養殖用ケージへの傾斜が高まっていることを挙げています。また、海洋養殖の人気の高まりと耐紫外線養殖用ケージへの嗜好の高まりは、市場の大きな需要につながります。
目次
第1章 エグゼクティブサマリー
- 市場概要
第2章 市場情勢
- 市場エコシステム
- 市場の特徴
- バリューチェーン分析
第3章 市場規模の評価
- 市場の定義
- 市場セグメント分析
- 市場規模 2023年
- 市場の展望 2023~2028年
第4章 市場規模実績
- 養殖用ケージの世界市場 2018~2022年
- 用途別セグメント分析 2018~2022年
- 環境セグメント分析 2018~2022年
- 地域別セグメント分析 2018~2022年
- 国別セグメント分析 2018~2022年
第5章 ファイブフォース分析
- ファイブフォースの要約
- 買い手の交渉力
- 供給企業の交渉力
- 新規参入業者の脅威
- 代替品の脅威
- 競争の脅威
- 市況
第6章 市場セグメンテーション:用途別
- 市場セグメンテーション
- 比較:用途別
- 魚:市場規模と予測 2023~2028年
- 甲殻類:市場規模と予測 2023~2028年
- 軟体動物:市場規模と予測 2023~2028年
- その他:市場規模と予測 2023~2028年
- 市場機会:用途別
第7章 市場セグメンテーション:環境別
- 市場セグメンテーション
- 比較:環境別
- 淡水:市場規模と予測 2023~2028年
- 海水と汽水:市場規模と予測 2023~2028年
- 市場機会:環境別
第8章 顧客情勢
- 顧客情勢概要
第9章 地域別情勢
- 地域別セグメンテーション
- 比較:地域別
- アジア太平洋:市場規模と予測 2023~2028年
- 北米:市場規模と予測 2023~2028年
- 欧州:市場規模と予測 2023~2028年
- 南米:市場規模と予測 2023~2028年
- 中東・アフリカ:市場規模と予測 2023~2028年
- 中国:市場規模と予測 2023~2028年
- インド:市場規模と予測 2023~2028年
- ベトナム:市場規模と予測 2023~2028年
- 米国:市場規模と予測 2023~2028年
- タイ:市場規模と予測 2023~2028年
- 市場機会:地域情勢別
第10章 促進要因・課題・機会・抑制要因
- 市場促進要因
- 市場課題
- 促進要因と課題の影響
- 市場の機会・抑制要因
第11章 競合情勢
- 概要
- 競合情勢
- 混乱の状況
- 業界のリスク
第12章 競合分析
- 企業プロファイル
- 企業の市場ポジショニング
- AKVA group
- Asakua Su Urunleri Ltd.
- Badinotti Group SPA
- China Lesso Group Holdings Ltd.
- Das and Kumars
- Gael Force Group Ltd.
- Garware Technical Fibres Ltd.
- Guang Dong Yangfan Mesh Industry Co. LTD.
- Linde Plc
- MSD AQUACULTURE
- Pioneer Group
- Qingdao Qihang Fishing Cage Co. Ltd.
- Selstad AS
- Serge Ferrari SAS
- SRR Aqua Suppliers LLP
第13章 付録
Exhibits:
- Exhibits1: Executive Summary - Chart on Market Overview
- Exhibits2: Executive Summary - Data Table on Market Overview
- Exhibits3: Executive Summary - Chart on Global Market Characteristics
- Exhibits4: Executive Summary - Chart on Market By Geographical Landscape
- Exhibits5: Executive Summary - Chart on Market Segmentation by Application
- Exhibits6: Executive Summary - Chart on Market Segmentation by Environment
- Exhibits7: Executive Summary - Chart on Incremental Growth
- Exhibits8: Executive Summary - Data Table on Incremental Growth
- Exhibits9: Executive Summary - Chart on Company Market Positioning
- Exhibits10: Parent Market
- Exhibits11: Data Table on - Parent Market
- Exhibits12: Market characteristics analysis
- Exhibits13: Value Chain Analysis
- Exhibits14: Offerings of companies included in the market definition
- Exhibits15: Market segments
- Exhibits16: Chart on Global - Market size and forecast 2023-2028 ($ million)
- Exhibits17: Data Table on Global - Market size and forecast 2023-2028 ($ million)
- Exhibits18: Chart on Global Market: Year-over-year growth 2023-2028 (%)
- Exhibits19: Data Table on Global Market: Year-over-year growth 2023-2028 (%)
- Exhibits20: Historic Market Size - Data Table on Global Aquaculture Cages Market 2018 - 2022 ($ million)
- Exhibits21: Historic Market Size - Application Segment 2018 - 2022 ($ million)
- Exhibits22: Historic Market Size - Environment Segment 2018 - 2022 ($ million)
- Exhibits23: Historic Market Size - Geography Segment 2018 - 2022 ($ million)
- Exhibits24: Historic Market Size - Country Segment 2018 - 2022 ($ million)
- Exhibits25: Five forces analysis - Comparison between 2023 and 2028
- Exhibits26: Bargaining power of buyers - Impact of key factors 2023 and 2028
- Exhibits27: Bargaining power of suppliers - Impact of key factors in 2023 and 2028
- Exhibits28: Threat of new entrants - Impact of key factors in 2023 and 2028
- Exhibits29: Threat of substitutes - Impact of key factors in 2023 and 2028
- Exhibits30: Threat of rivalry - Impact of key factors in 2023 and 2028
- Exhibits31: Chart on Market condition - Five forces 2023 and 2028
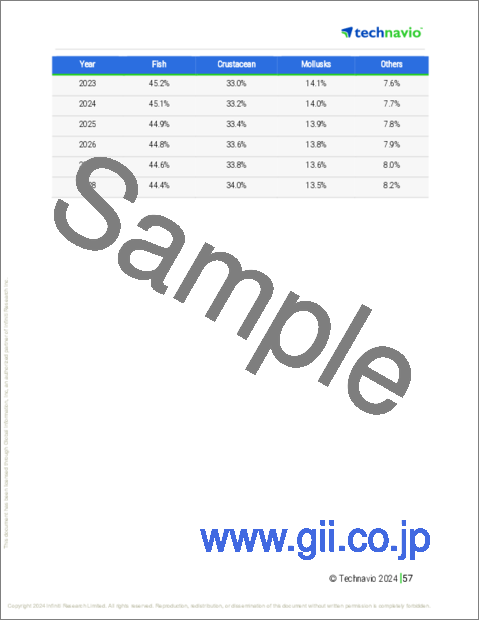
- Exhibits32: Chart on Application - Market share 2023-2028 (%)
- Exhibits33: Data Table on Application - Market share 2023-2028 (%)
- Exhibits34: Chart on Comparison by Application
- Exhibits35: Data Table on Comparison by Application
- Exhibits36: Chart on Fish - Market size and forecast 2023-2028 ($ million)
- Exhibits37: Data Table on Fish - Market size and forecast 2023-2028 ($ million)
- Exhibits38: Chart on Fish - Year-over-year growth 2023-2028 (%)
- Exhibits39: Data Table on Fish - Year-over-year growth 2023-2028 (%)
- Exhibits40: Chart on Crustacean - Market size and forecast 2023-2028 ($ million)
- Exhibits41: Data Table on Crustacean - Market size and forecast 2023-2028 ($ million)
- Exhibits42: Chart on Crustacean - Year-over-year growth 2023-2028 (%)
- Exhibits43: Data Table on Crustacean - Year-over-year growth 2023-2028 (%)
- Exhibits44: Chart on Mollusks - Market size and forecast 2023-2028 ($ million)
- Exhibits45: Data Table on Mollusks - Market size and forecast 2023-2028 ($ million)
- Exhibits46: Chart on Mollusks - Year-over-year growth 2023-2028 (%)
- Exhibits47: Data Table on Mollusks - Year-over-year growth 2023-2028 (%)
- Exhibits48: Chart on Others - Market size and forecast 2023-2028 ($ million)
- Exhibits49: Data Table on Others - Market size and forecast 2023-2028 ($ million)
- Exhibits50: Chart on Others - Year-over-year growth 2023-2028 (%)
- Exhibits51: Data Table on Others - Year-over-year growth 2023-2028 (%)
- Exhibits52: Market opportunity by Application ($ million)
- Exhibits53: Data Table on Market opportunity by Application ($ million)
- Exhibits54: Chart on Environment - Market share 2023-2028 (%)
- Exhibits55: Data Table on Environment - Market share 2023-2028 (%)
- Exhibits56: Chart on Comparison by Environment
- Exhibits57: Data Table on Comparison by Environment
- Exhibits58: Chart on Freshwater aquaculture cages - Market size and forecast 2023-2028 ($ million)
- Exhibits59: Data Table on Freshwater aquaculture cages - Market size and forecast 2023-2028 ($ million)
- Exhibits60: Chart on Freshwater aquaculture cages - Year-over-year growth 2023-2028 (%)
- Exhibits61: Data Table on Freshwater aquaculture cages - Year-over-year growth 2023-2028 (%)
- Exhibits62: Chart on Marine and brackish water aquaculture cages - Market size and forecast 2023-2028 ($ million)
- Exhibits63: Data Table on Marine and brackish water aquaculture cages - Market size and forecast 2023-2028 ($ million)
- Exhibits64: Chart on Marine and brackish water aquaculture cages - Year-over-year growth 2023-2028 (%)
- Exhibits65: Data Table on Marine and brackish water aquaculture cages - Year-over-year growth 2023-2028 (%)
- Exhibits66: Market opportunity by Environment ($ million)
- Exhibits67: Data Table on Market opportunity by Environment ($ million)
- Exhibits68: Analysis of price sensitivity, lifecycle, customer purchase basket, adoption rates, and purchase criteria
- Exhibits69: Chart on Market share By Geographical Landscape 2023-2028 (%)
- Exhibits70: Data Table on Market share By Geographical Landscape 2023-2028 (%)
- Exhibits71: Chart on Geographic comparison
- Exhibits72: Data Table on Geographic comparison
- Exhibits73: Chart on APAC - Market size and forecast 2023-2028 ($ million)
- Exhibits74: Data Table on APAC - Market size and forecast 2023-2028 ($ million)
- Exhibits75: Chart on APAC - Year-over-year growth 2023-2028 (%)
- Exhibits76: Data Table on APAC - Year-over-year growth 2023-2028 (%)
- Exhibits77: Chart on North America - Market size and forecast 2023-2028 ($ million)
- Exhibits78: Data Table on North America - Market size and forecast 2023-2028 ($ million)
- Exhibits79: Chart on North America - Year-over-year growth 2023-2028 (%)
- Exhibits80: Data Table on North America - Year-over-year growth 2023-2028 (%)
- Exhibits81: Chart on Europe - Market size and forecast 2023-2028 ($ million)
- Exhibits82: Data Table on Europe - Market size and forecast 2023-2028 ($ million)
- Exhibits83: Chart on Europe - Year-over-year growth 2023-2028 (%)
- Exhibits84: Data Table on Europe - Year-over-year growth 2023-2028 (%)
- Exhibits85: Chart on South America - Market size and forecast 2023-2028 ($ million)
- Exhibits86: Data Table on South America - Market size and forecast 2023-2028 ($ million)
- Exhibits87: Chart on South America - Year-over-year growth 2023-2028 (%)
- Exhibits88: Data Table on South America - Year-over-year growth 2023-2028 (%)
- Exhibits89: Chart on Middle East and Africa - Market size and forecast 2023-2028 ($ million)
- Exhibits90: Data Table on Middle East and Africa - Market size and forecast 2023-2028 ($ million)
- Exhibits91: Chart on Middle East and Africa - Year-over-year growth 2023-2028 (%)
- Exhibits92: Data Table on Middle East and Africa - Year-over-year growth 2023-2028 (%)
- Exhibits93: Chart on China - Market size and forecast 2023-2028 ($ million)
- Exhibits94: Data Table on China - Market size and forecast 2023-2028 ($ million)
- Exhibits95: Chart on China - Year-over-year growth 2023-2028 (%)
- Exhibits96: Data Table on China - Year-over-year growth 2023-2028 (%)
- Exhibits97: Chart on India - Market size and forecast 2023-2028 ($ million)
- Exhibits98: Data Table on India - Market size and forecast 2023-2028 ($ million)
- Exhibits99: Chart on India - Year-over-year growth 2023-2028 (%)
- Exhibits100: Data Table on India - Year-over-year growth 2023-2028 (%)
- Exhibits101: Chart on Vietnam - Market size and forecast 2023-2028 ($ million)
- Exhibits102: Data Table on Vietnam - Market size and forecast 2023-2028 ($ million)
- Exhibits103: Chart on Vietnam - Year-over-year growth 2023-2028 (%)
- Exhibits104: Data Table on Vietnam - Year-over-year growth 2023-2028 (%)
- Exhibits105: Chart on US - Market size and forecast 2023-2028 ($ million)
- Exhibits106: Data Table on US - Market size and forecast 2023-2028 ($ million)
- Exhibits107: Chart on US - Year-over-year growth 2023-2028 (%)
- Exhibits108: Data Table on US - Year-over-year growth 2023-2028 (%)
- Exhibits109: Chart on Thailand - Market size and forecast 2023-2028 ($ million)
- Exhibits110: Data Table on Thailand - Market size and forecast 2023-2028 ($ million)
- Exhibits111: Chart on Thailand - Year-over-year growth 2023-2028 (%)
- Exhibits112: Data Table on Thailand - Year-over-year growth 2023-2028 (%)
- Exhibits113: Market opportunity By Geographical Landscape ($ million)
- Exhibits114: Data Tables on Market opportunity By Geographical Landscape ($ million)
- Exhibits115: Impact of drivers and challenges in 2023 and 2028
- Exhibits116: Overview on criticality of inputs and factors of differentiation
- Exhibits117: Overview on factors of disruption
- Exhibits118: Impact of key risks on business
- Exhibits119: Companies covered
- Exhibits120: Matrix on companies position and classification
- Exhibits121: AKVA group - Overview
- Exhibits122: AKVA group - Business segments
- Exhibits123: AKVA group - Key news
- Exhibits124: AKVA group - Key offerings
- Exhibits125: AKVA group - Segment focus
- Exhibits126: Asakua Su Urunleri Ltd. - Overview
- Exhibits127: Asakua Su Urunleri Ltd. - Product / Service
- Exhibits128: Asakua Su Urunleri Ltd. - Key offerings
- Exhibits129: Badinotti Group SPA - Overview
- Exhibits130: Badinotti Group SPA - Product / Service
- Exhibits131: Badinotti Group SPA - Key offerings
- Exhibits132: China Lesso Group Holdings Ltd. - Overview
- Exhibits133: China Lesso Group Holdings Ltd. - Business segments
- Exhibits134: China Lesso Group Holdings Ltd. - Key offerings
- Exhibits135: China Lesso Group Holdings Ltd. - Segment focus
- Exhibits136: Das and Kumars - Overview
- Exhibits137: Das and Kumars - Product / Service
- Exhibits138: Das and Kumars - Key offerings
- Exhibits139: Gael Force Group Ltd. - Overview
- Exhibits140: Gael Force Group Ltd. - Product / Service
- Exhibits141: Gael Force Group Ltd. - Key offerings
- Exhibits142: Garware Technical Fibres Ltd. - Overview
- Exhibits143: Garware Technical Fibres Ltd. - Business segments
- Exhibits144: Garware Technical Fibres Ltd. - Key offerings
- Exhibits145: Garware Technical Fibres Ltd. - Segment focus
- Exhibits146: Guang Dong Yangfan Mesh Industry Co. LTD. - Overview
- Exhibits147: Guang Dong Yangfan Mesh Industry Co. LTD. - Product / Service
- Exhibits148: Guang Dong Yangfan Mesh Industry Co. LTD. - Key offerings
- Exhibits149: Linde Plc - Overview
- Exhibits150: Linde Plc - Business segments
- Exhibits151: Linde Plc - Key news
- Exhibits152: Linde Plc - Key offerings
- Exhibits153: Linde Plc - Segment focus
- Exhibits154: MSD AQUACULTURE - Overview
- Exhibits155: MSD AQUACULTURE - Product / Service
- Exhibits156: MSD AQUACULTURE - Key offerings
- Exhibits157: Pioneer Group - Overview
- Exhibits158: Pioneer Group - Product / Service
- Exhibits159: Pioneer Group - Key offerings
- Exhibits160: Qingdao Qihang Fishing Cage Co. Ltd. - Overview
- Exhibits161: Qingdao Qihang Fishing Cage Co. Ltd. - Product / Service
- Exhibits162: Qingdao Qihang Fishing Cage Co. Ltd. - Key offerings
- Exhibits163: Selstad AS - Overview
- Exhibits164: Selstad AS - Product / Service
- Exhibits165: Selstad AS - Key offerings
- Exhibits166: Serge Ferrari SAS - Overview
- Exhibits167: Serge Ferrari SAS - Product / Service
- Exhibits168: Serge Ferrari SAS - Key offerings
- Exhibits169: SRR Aqua Suppliers LLP - Overview
- Exhibits170: SRR Aqua Suppliers LLP - Product / Service
- Exhibits171: SRR Aqua Suppliers LLP - Key offerings
- Exhibits172: Inclusions checklist
- Exhibits173: Exclusions checklist
- Exhibits174: Currency conversion rates for US$
- Exhibits175: Research methodology
- Exhibits176: Information sources
- Exhibits177: Data validation
- Exhibits178: Validation techniques employed for market sizing
- Exhibits179: Data synthesis
- Exhibits180: 360 degree market analysis
- Exhibits181: List of abbreviations
The aquaculture cages market is forecasted to grow by USD 92 mn during 2023-2028, accelerating at a CAGR of 6.03% during the forecast period. The report on the aquaculture cages market provides a holistic analysis, market size and forecast, trends, growth drivers, and challenges, as well as vendor analysis covering around 25 vendors.
The report offers an up-to-date analysis regarding the current market scenario, the latest trends and drivers, and the overall market environment. The market is driven by rising consumer inclination for nutrient-rich fish and fish products, declining fish stock due to unsustainable fishing practices, and growing end-user inclination for certified aquaculture cages.
Technavio's aquaculture cages market is segmented as below:
| Market Scope | |
|---|---|
| Base Year | 2024 |
| End Year | 2028 |
| Series Year | 2024-2028 |
| Growth Momentum | Accelerate |
| YOY 2024 | 5.7% |
| CAGR | 6.03% |
| Incremental Value | $92 mn |
By Application
- Fish
- Crustacean
- Mollusks
- Others
By Environment
- Freshwater aquaculture cages
- Marine and brackish water aquaculture cages
By Geographical Landscape
- APAC
- North America
- Europe
- South America
- Middle East and Africa
This study identifies the growing inclination for hdpe aquaculture cages among end-users as one of the prime reasons driving the aquaculture cages market growth during the next few years. Also, growing popularity of offshore aquaculture and growing preference for uv-resistant aquaculture cages will lead to sizable demand in the market.
The report on the aquaculture cages market covers the following areas:
- Aquaculture cages market sizing
- Aquaculture cages market forecast
- Aquaculture cages market industry analysis
The robust vendor analysis is designed to help clients improve their market position, and in line with this, this report provides a detailed analysis of several leading aquaculture cages market vendors that include AKVA group, Alfa Laval AB, Asakua Su Urunleri Ltd., Badinotti Group SPA, China Lesso Group Holdings Ltd., Das and Kumars, Gael Force Group Ltd., Garware Technical Fibres Ltd., GiliOcean Technology Ltd., Guang Dong Yangfan Mesh Industry Co. LTD., King Chou Fish Net, KJ, Linde Plc, MSD AQUACULTURE, Pioneer Group, Qingdao Qihang Fishing Cage Co. Ltd., Selstad AS, Serge Ferrari SAS, SRR Aqua Suppliers LLP, and Zhejiang dechen plastic co. ltd.. Also, the aquaculture cages market analysis report includes information on upcoming trends and challenges that will influence market growth. This is to help companies strategize and leverage all forthcoming growth opportunities.
The study was conducted using an objective combination of primary and secondary information including inputs from key participants in the industry. The report contains a comprehensive market and vendor landscape in addition to an analysis of the key vendors.
The publisher presents a detailed picture of the market by the way of study, synthesis, and summation of data from multiple sources by an analysis of key parameters such as profit, pricing, competition, and promotions. It presents various market facets by identifying the key industry influencers. The data presented is comprehensive, reliable, and a result of extensive research - both primary and secondary. The market research reports provide a complete competitive landscape and an in-depth vendor selection methodology and analysis using qualitative and quantitative research to forecast the accurate market growth.
Table of Contents
1 Executive Summary
- 1.1 Market overview
- Executive Summary - Chart on Market Overview
- Executive Summary - Data Table on Market Overview
- Executive Summary - Chart on Global Market Characteristics
- Executive Summary - Chart on Market By Geographical Landscape
- Executive Summary - Chart on Market Segmentation by Application
- Executive Summary - Chart on Market Segmentation by Environment
- Executive Summary - Chart on Incremental Growth
- Executive Summary - Data Table on Incremental Growth
- Executive Summary - Chart on Company Market Positioning
2 Market Landscape
- 2.1 Market ecosystem
- Parent Market
- Data Table on - Parent Market
- 2.2 Market characteristics
- Market characteristics analysis
- 2.3 Value chain analysis
- Value Chain Analysis
3 Market Sizing
- 3.1 Market definition
- Offerings of companies included in the market definition
- 3.2 Market segment analysis
- Market segments
- 3.3 Market size 2023
- 3.4 Market outlook: Forecast for 2023-2028
- Chart on Global - Market size and forecast 2023-2028 ($ million)
- Data Table on Global - Market size and forecast 2023-2028 ($ million)
- Chart on Global Market: Year-over-year growth 2023-2028 (%)
- Data Table on Global Market: Year-over-year growth 2023-2028 (%)
4 Historic Market Size
- 4.1 Global Aquaculture Cages Market 2018 - 2022
- Historic Market Size - Data Table on Global Aquaculture Cages Market 2018 - 2022 ($ million)
- 4.2 Application segment analysis 2018 - 2022
- Historic Market Size - Application Segment 2018 - 2022 ($ million)
- 4.3 Environment segment analysis 2018 - 2022
- Historic Market Size - Environment Segment 2018 - 2022 ($ million)
- 4.4 Geography segment analysis 2018 - 2022
- Historic Market Size - Geography Segment 2018 - 2022 ($ million)
- 4.5 Country segment analysis 2018 - 2022
- Historic Market Size - Country Segment 2018 - 2022 ($ million)
5 Five Forces Analysis
- 5.1 Five forces summary
- Five forces analysis - Comparison between 2023 and 2028
- 5.2 Bargaining power of buyers
- Bargaining power of buyers - Impact of key factors 2023 and 2028
- 5.3 Bargaining power of suppliers
- Bargaining power of suppliers - Impact of key factors in 2023 and 2028
- 5.4 Threat of new entrants
- Threat of new entrants - Impact of key factors in 2023 and 2028
- 5.5 Threat of substitutes
- Threat of substitutes - Impact of key factors in 2023 and 2028
- 5.6 Threat of rivalry
- Threat of rivalry - Impact of key factors in 2023 and 2028
- 5.7 Market condition
- Chart on Market condition - Five forces 2023 and 2028
6 Market Segmentation by Application
- 6.1 Market segments
- Chart on Application - Market share 2023-2028 (%)
- Data Table on Application - Market share 2023-2028 (%)
- 6.2 Comparison by Application
- Chart on Comparison by Application
- Data Table on Comparison by Application
- 6.3 Fish - Market size and forecast 2023-2028
- Chart on Fish - Market size and forecast 2023-2028 ($ million)
- Data Table on Fish - Market size and forecast 2023-2028 ($ million)
- Chart on Fish - Year-over-year growth 2023-2028 (%)
- Data Table on Fish - Year-over-year growth 2023-2028 (%)
- 6.4 Crustacean - Market size and forecast 2023-2028
- Chart on Crustacean - Market size and forecast 2023-2028 ($ million)
- Data Table on Crustacean - Market size and forecast 2023-2028 ($ million)
- Chart on Crustacean - Year-over-year growth 2023-2028 (%)
- Data Table on Crustacean - Year-over-year growth 2023-2028 (%)
- 6.5 Mollusks - Market size and forecast 2023-2028
- Chart on Mollusks - Market size and forecast 2023-2028 ($ million)
- Data Table on Mollusks - Market size and forecast 2023-2028 ($ million)
- Chart on Mollusks - Year-over-year growth 2023-2028 (%)
- Data Table on Mollusks - Year-over-year growth 2023-2028 (%)
- 6.6 Others - Market size and forecast 2023-2028
- Chart on Others - Market size and forecast 2023-2028 ($ million)
- Data Table on Others - Market size and forecast 2023-2028 ($ million)
- Chart on Others - Year-over-year growth 2023-2028 (%)
- Data Table on Others - Year-over-year growth 2023-2028 (%)
- 6.7 Market opportunity by Application
- Market opportunity by Application ($ million)
- Data Table on Market opportunity by Application ($ million)
7 Market Segmentation by Environment
- 7.1 Market segments
- Chart on Environment - Market share 2023-2028 (%)
- Data Table on Environment - Market share 2023-2028 (%)
- 7.2 Comparison by Environment
- Chart on Comparison by Environment
- Data Table on Comparison by Environment
- 7.3 Freshwater aquaculture cages - Market size and forecast 2023-2028
- Chart on Freshwater aquaculture cages - Market size and forecast 2023-2028 ($ million)
- Data Table on Freshwater aquaculture cages - Market size and forecast 2023-2028 ($ million)
- Chart on Freshwater aquaculture cages - Year-over-year growth 2023-2028 (%)
- Data Table on Freshwater aquaculture cages - Year-over-year growth 2023-2028 (%)
- 7.4 Marine and brackish water aquaculture cages - Market size and forecast 2023-2028
- Chart on Marine and brackish water aquaculture cages - Market size and forecast 2023-2028 ($ million)
- Data Table on Marine and brackish water aquaculture cages - Market size and forecast 2023-2028 ($ million)
- Chart on Marine and brackish water aquaculture cages - Year-over-year growth 2023-2028 (%)
- Data Table on Marine and brackish water aquaculture cages - Year-over-year growth 2023-2028 (%)
- 7.5 Market opportunity by Environment
- Market opportunity by Environment ($ million)
- Data Table on Market opportunity by Environment ($ million)
8 Customer Landscape
- 8.1 Customer landscape overview
- Analysis of price sensitivity, lifecycle, customer purchase basket, adoption rates, and purchase criteria
9 Geographic Landscape
- 9.1 Geographic segmentation
- Chart on Market share By Geographical Landscape 2023-2028 (%)
- Data Table on Market share By Geographical Landscape 2023-2028 (%)
- 9.2 Geographic comparison
- Chart on Geographic comparison
- Data Table on Geographic comparison
- 9.3 APAC - Market size and forecast 2023-2028
- Chart on APAC - Market size and forecast 2023-2028 ($ million)
- Data Table on APAC - Market size and forecast 2023-2028 ($ million)
- Chart on APAC - Year-over-year growth 2023-2028 (%)
- Data Table on APAC - Year-over-year growth 2023-2028 (%)
- 9.4 North America - Market size and forecast 2023-2028
- Chart on North America - Market size and forecast 2023-2028 ($ million)
- Data Table on North America - Market size and forecast 2023-2028 ($ million)
- Chart on North America - Year-over-year growth 2023-2028 (%)
- Data Table on North America - Year-over-year growth 2023-2028 (%)
- 9.5 Europe - Market size and forecast 2023-2028
- Chart on Europe - Market size and forecast 2023-2028 ($ million)
- Data Table on Europe - Market size and forecast 2023-2028 ($ million)
- Chart on Europe - Year-over-year growth 2023-2028 (%)
- Data Table on Europe - Year-over-year growth 2023-2028 (%)
- 9.6 South America - Market size and forecast 2023-2028
- Chart on South America - Market size and forecast 2023-2028 ($ million)
- Data Table on South America - Market size and forecast 2023-2028 ($ million)
- Chart on South America - Year-over-year growth 2023-2028 (%)
- Data Table on South America - Year-over-year growth 2023-2028 (%)
- 9.7 Middle East and Africa - Market size and forecast 2023-2028
- Chart on Middle East and Africa - Market size and forecast 2023-2028 ($ million)
- Data Table on Middle East and Africa - Market size and forecast 2023-2028 ($ million)
- Chart on Middle East and Africa - Year-over-year growth 2023-2028 (%)
- Data Table on Middle East and Africa - Year-over-year growth 2023-2028 (%)
- 9.8 China - Market size and forecast 2023-2028
- Chart on China - Market size and forecast 2023-2028 ($ million)
- Data Table on China - Market size and forecast 2023-2028 ($ million)
- Chart on China - Year-over-year growth 2023-2028 (%)
- Data Table on China - Year-over-year growth 2023-2028 (%)
- 9.9 India - Market size and forecast 2023-2028
- Chart on India - Market size and forecast 2023-2028 ($ million)
- Data Table on India - Market size and forecast 2023-2028 ($ million)
- Chart on India - Year-over-year growth 2023-2028 (%)
- Data Table on India - Year-over-year growth 2023-2028 (%)
- 9.10 Vietnam - Market size and forecast 2023-2028
- Chart on Vietnam - Market size and forecast 2023-2028 ($ million)
- Data Table on Vietnam - Market size and forecast 2023-2028 ($ million)
- Chart on Vietnam - Year-over-year growth 2023-2028 (%)
- Data Table on Vietnam - Year-over-year growth 2023-2028 (%)
- 9.11 US - Market size and forecast 2023-2028
- Chart on US - Market size and forecast 2023-2028 ($ million)
- Data Table on US - Market size and forecast 2023-2028 ($ million)
- Chart on US - Year-over-year growth 2023-2028 (%)
- Data Table on US - Year-over-year growth 2023-2028 (%)
- 9.12 Thailand - Market size and forecast 2023-2028
- Chart on Thailand - Market size and forecast 2023-2028 ($ million)
- Data Table on Thailand - Market size and forecast 2023-2028 ($ million)
- Chart on Thailand - Year-over-year growth 2023-2028 (%)
- Data Table on Thailand - Year-over-year growth 2023-2028 (%)
- 9.13 Market opportunity By Geographical Landscape
- Market opportunity By Geographical Landscape ($ million)
- Data Tables on Market opportunity By Geographical Landscape ($ million)
10 Drivers, Challenges, and Opportunity/Restraints
- 10.1 Market drivers
- 10.2 Market challenges
- 10.3 Impact of drivers and challenges
- Impact of drivers and challenges in 2023 and 2028
- 10.4 Market opportunities/restraints
11 Competitive Landscape
- 11.1 Overview
- 11.2 Competitive Landscape
- Overview on criticality of inputs and factors of differentiation
- 11.3 Landscape disruption
- Overview on factors of disruption
- 11.4 Industry risks
- Impact of key risks on business
12 Competitive Analysis
- 12.1 Companies profiled
- Companies covered
- 12.2 Market positioning of companies
- Matrix on companies position and classification
- 12.3 AKVA group
- AKVA group - Overview
- AKVA group - Business segments
- AKVA group - Key news
- AKVA group - Key offerings
- AKVA group - Segment focus
- 12.4 Asakua Su Urunleri Ltd.
- Asakua Su Urunleri Ltd. - Overview
- Asakua Su Urunleri Ltd. - Product / Service
- Asakua Su Urunleri Ltd. - Key offerings
- 12.5 Badinotti Group SPA
- Badinotti Group SPA - Overview
- Badinotti Group SPA - Product / Service
- Badinotti Group SPA - Key offerings
- 12.6 China Lesso Group Holdings Ltd.
- China Lesso Group Holdings Ltd. - Overview
- China Lesso Group Holdings Ltd. - Business segments
- China Lesso Group Holdings Ltd. - Key offerings
- China Lesso Group Holdings Ltd. - Segment focus
- 12.7 Das and Kumars
- Das and Kumars - Overview
- Das and Kumars - Product / Service
- Das and Kumars - Key offerings
- 12.8 Gael Force Group Ltd.
- Gael Force Group Ltd. - Overview
- Gael Force Group Ltd. - Product / Service
- Gael Force Group Ltd. - Key offerings
- 12.9 Garware Technical Fibres Ltd.
- Garware Technical Fibres Ltd. - Overview
- Garware Technical Fibres Ltd. - Business segments
- Garware Technical Fibres Ltd. - Key offerings
- Garware Technical Fibres Ltd. - Segment focus
- 12.10 Guang Dong Yangfan Mesh Industry Co. LTD.
- Guang Dong Yangfan Mesh Industry Co. LTD. - Overview
- Guang Dong Yangfan Mesh Industry Co. LTD. - Product / Service
- Guang Dong Yangfan Mesh Industry Co. LTD. - Key offerings
- 12.11 Linde Plc
- Linde Plc - Overview
- Linde Plc - Business segments
- Linde Plc - Key news
- Linde Plc - Key offerings
- Linde Plc - Segment focus
- 12.12 MSD AQUACULTURE
- MSD AQUACULTURE - Overview
- MSD AQUACULTURE - Product / Service
- MSD AQUACULTURE - Key offerings
- 12.13 Pioneer Group
- Pioneer Group - Overview
- Pioneer Group - Product / Service
- Pioneer Group - Key offerings
- 12.14 Qingdao Qihang Fishing Cage Co. Ltd.
- Qingdao Qihang Fishing Cage Co. Ltd. - Overview
- Qingdao Qihang Fishing Cage Co. Ltd. - Product / Service
- Qingdao Qihang Fishing Cage Co. Ltd. - Key offerings
- 12.15 Selstad AS
- Selstad AS - Overview
- Selstad AS - Product / Service
- Selstad AS - Key offerings
- 12.16 Serge Ferrari SAS
- Serge Ferrari SAS - Overview
- Serge Ferrari SAS - Product / Service
- Serge Ferrari SAS - Key offerings
- 12.17 SRR Aqua Suppliers LLP
- SRR Aqua Suppliers LLP - Overview
- SRR Aqua Suppliers LLP - Product / Service
- SRR Aqua Suppliers LLP - Key offerings
13 Appendix
- 13.1 Scope of the report
- 13.2 Inclusions and exclusions checklist
- Inclusions checklist
- Exclusions checklist
- 13.3 Currency conversion rates for US$
- Currency conversion rates for US$
- 13.4 Research methodology
- Research methodology
- 13.5 Data procurement
- Information sources
- 13.6 Data validation
- Data validation
- 13.7 Validation techniques employed for market sizing
- Validation techniques employed for market sizing
- 13.8 Data synthesis
- Data synthesis
- 13.9 360 degree market analysis
- 360 degree market analysis
- 13.10 List of abbreviations
- List of abbreviations

