|
|
市場調査レポート
商品コード
1783883
人工骨の世界市場 2025-2029Global Artificial Bone Market 2025-2029 |
||||||
|
|||||||
カスタマイズ可能
|
|||||||


| 人工骨の世界市場 2025-2029 |
|
出版日: 2025年07月24日
発行: TechNavio
ページ情報: 英文 222 Pages
納期: 即納可能
|

全表示
- 概要
- 図表
- 目次
人工骨市場は2024-2029年に2億4,230万米ドル、予測期間中のCAGRは10%で成長すると予測されます。
当レポートでは、人工骨市場の全体的な分析、市場規模・予測、動向、成長促進要因、課題、約25のベンダーを網羅したベンダー分析などを掲載しています。
現在の市場シナリオ、最新動向と促進要因、市場環境全体に関する最新分析を提供しています。この市場は、世界の高齢者人口の増加、骨疾患や傷害の有病率の増加、先進医療に対する認識とアクセシビリティの向上が原動力となっています。
| 市場範囲 | |
|---|---|
| 基準年 | 2025 |
| 終了年 | 2029 |
| 予測期間 | 2025-2029 |
| 成長モメンタム | 加速 |
| 前年比 | 8.9% |
| CAGR | 10% |
| 増分額 | 2億4,230万米ドル |
本調査は、業界の主要参加者からのインプットを含め、一次情報と二次情報を客観的に組み合わせて実施しました。レポートには、主要企業の分析に加え、包括的な市場規模データ、地域別分析によるセグメント、ベンダー情勢が含まれています。レポートには過去データと予測データがあります。
本調査では、今後数年間の人工骨市場の成長を促進する主な理由の1つとして、骨粗鬆症の高い有病率を挙げています。また、骨インプラントにおける3Dプリンティング技術の利用拡大や、低侵襲技術の採用増加も、同市場の大きな需要につながります。
目次
第1章 エグゼクティブサマリー
- 市場概要
第2章 Technavio分析
- 価格・ライフサイクル・顧客購入バスケット・採用率・購入基準の分析
- インプットの重要性と差別化の要因
- 混乱の要因
- 促進要因と課題の影響
第3章 市場情勢
- 市場エコシステム
- 市場の特徴
- バリューチェーン分析
第4章 市場規模
- 市場の定義
- 市場セグメント分析
- 市場規模 2024
- 市場の見通し 2024-2029
第5章 市場規模実績
- 人工骨の世界市場 2019-2023
- 材料別セグメント分析 2019-2023
- エンドユーザー別セグメント分析 2019-2023
- 用途別セグメント分析 2019-2023
- 地域別セグメント分析 2019-2023
- 国別セグメント分析 2019-2023
第6章 定性分析
- AIの影響:人工骨の世界市場
第7章 ファイブフォース分析
- ファイブフォースの要約
- 買い手の交渉力
- 供給企業の交渉力
- 新規参入業者の脅威
- 代替品の脅威
- 競争の脅威
- 市況
第8章 市場セグメンテーション:材料別
- 市場セグメント
- 比較:材料別
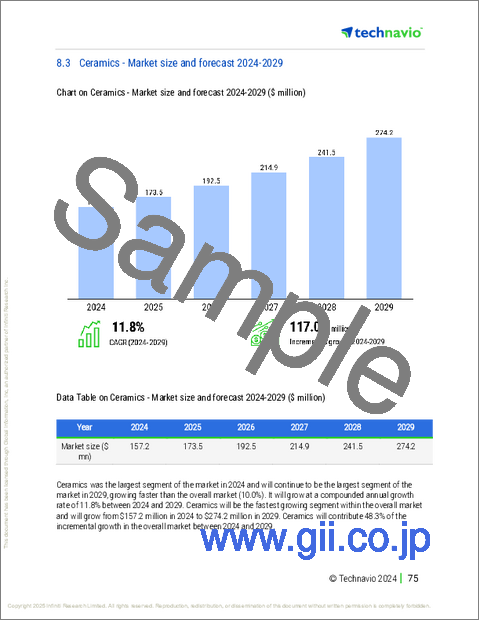
- セラミックス:市場規模と予測 2024-2029
- ハイドロキシアパタイト:市場規模と予測 2024-2029
- 複合:市場規模と予測 2024-2029
- ポリマー:市場規模と予測 2024-2029
- その他:市場規模と予測 2024-2029
- 市場機会:材料別
第9章 市場セグメンテーション:エンドユーザー別
- 市場セグメント
- 比較:エンドユーザー別
- 病院:市場規模と予測 2024-2029
- 専門クリニック:市場規模と予測 2024-2029
- 調査機関:市場規模と予測 2024-2029
- 市場機会:エンドユーザー別
第10章 市場セグメンテーション:用途別
- 市場セグメント
- 比較:用途別
- 脊椎固定術:市場規模と予測 2024-2029
- 歯科:市場規模と予測 2024-2029
- 頭蓋顎顔面:市場規模と予測 2024-2029
- 関節再建:市場規模と予測 2024-2029
- 外傷と四肢:市場規模と予測 2024-2029
- 市場機会:用途別
第11章 顧客情勢
- 顧客情勢の概要
第12章 地域別情勢
- 地域別セグメンテーション
- 地域別比較
- 北米:市場規模と予測 2024-2029
- 欧州:市場規模と予測 2024-2029
- アジア:市場規模と予測 2024-2029
- 世界のその他の地域:市場規模と予測 2024-2029
- 米国:市場規模と予測 2024-2029
- 中国:市場規模と予測 2024-2029
- ドイツ:市場規模と予測 2024-2029
- カナダ:市場規模と予測 2024-2029
- 英国:市場規模と予測 2024-2029
- フランス:市場規模と予測 2024-2029
- 日本:市場規模と予測 2024-2029
- 韓国:市場規模と予測 2024-2029
- インド:市場規模と予測 2024-2029
- イタリア:市場規模と予測 2024-2029
- 市場機会:地域情勢別
第13章 促進要因・課題・機会・抑制要因
- 市場促進要因
- 市場の課題
- 促進要因と課題の影響
- 市場の機会・抑制要因
第14章 競合情勢
- 概要
- 競合情勢
- 混乱の状況
- 業界のリスク
第15章 競合分析
- 企業プロファイル
- 企業ランキング指数
- 企業の市場ポジショニング
- AlloSource
- Baxter International Inc.
- Biomatlante SAS
- DSM-Firmenich AG
- HOYA CORP.
- Johnson and Johnson Services Inc.
- Medtronic Plc
- NuVasive Inc.
- Orthofix Medical Inc.
- Shenzhen Mindray BioMedical Electronics Co. Ltd.
- Smith and Nephew plc
- Stryker Corp.
- Xtant Medical Holdings Inc.
- Ziacom Medical S.L.
- Zimmer Biomet Holdings Inc.
第16章 付録
Exhibits:
- Exhibits1: Executive Summary - Chart on Market Overview
- Exhibits2: Executive Summary - Data Table on Market Overview
- Exhibits3: Executive Summary - Chart on Global Market Characteristics
- Exhibits4: Executive Summary - Chart on Market By Geographical Landscape
- Exhibits5: Executive Summary - Chart on Market Segmentation by Material
- Exhibits6: Executive Summary - Chart on Market Segmentation by End-user
- Exhibits7: Executive Summary - Chart on Market Segmentation by Application
- Exhibits8: Executive Summary - Chart on Incremental Growth
- Exhibits9: Executive Summary - Data Table on Incremental Growth
- Exhibits10: Executive Summary - Chart on Company Market Positioning
- Exhibits11: Analysis of price sensitivity, lifecycle, customer purchase basket, adoption rates, and purchase criteria
- Exhibits12: Overview on criticality of inputs and factors of differentiation
- Exhibits13: Overview on factors of disruption
- Exhibits14: Impact of drivers and challenges in 2024 and 2029
- Exhibits15: Parent Market
- Exhibits16: Data Table on - Parent Market
- Exhibits17: Market characteristics analysis
- Exhibits18: Value chain analysis
- Exhibits19: Offerings of companies included in the market definition
- Exhibits20: Market segments
- Exhibits21: Chart on Global - Market size and forecast 2024-2029 ($ million)
- Exhibits22: Data Table on Global - Market size and forecast 2024-2029 ($ million)
- Exhibits23: Chart on Global Market: Year-over-year growth 2024-2029 (%)
- Exhibits24: Data Table on Global Market: Year-over-year growth 2024-2029 (%)
- Exhibits25: Historic Market Size - Data Table on Global Artificial Bone Market 2019 - 2023 ($ million)
- Exhibits26: Historic Market Size - Material Segment 2019 - 2023 ($ million)
- Exhibits27: Historic Market Size - End-user Segment 2019 - 2023 ($ million)
- Exhibits28: Historic Market Size - Application Segment 2019 - 2023 ($ million)
- Exhibits29: Historic Market Size - Geography Segment 2019 - 2023 ($ million)
- Exhibits30: Historic Market Size - Country Segment 2019 - 2023 ($ million)
- Exhibits31: Five forces analysis - Comparison between 2024 and 2029
- Exhibits32: Bargaining power of buyers - Impact of key factors 2024 and 2029
- Exhibits33: Bargaining power of suppliers - Impact of key factors in 2024 and 2029
- Exhibits34: Threat of new entrants - Impact of key factors in 2024 and 2029
- Exhibits35: Threat of substitutes - Impact of key factors in 2024 and 2029
- Exhibits36: Threat of rivalry - Impact of key factors in 2024 and 2029
- Exhibits37: Chart on Market condition - Five forces 2024 and 2029
- Exhibits38: Chart on Material - Market share 2024-2029 (%)
- Exhibits39: Data Table on Material - Market share 2024-2029 (%)
- Exhibits40: Chart on Comparison by Material
- Exhibits41: Data Table on Comparison by Material
- Exhibits42: Chart on Ceramics - Market size and forecast 2024-2029 ($ million)
- Exhibits43: Data Table on Ceramics - Market size and forecast 2024-2029 ($ million)
- Exhibits44: Chart on Ceramics - Year-over-year growth 2024-2029 (%)
- Exhibits45: Data Table on Ceramics - Year-over-year growth 2024-2029 (%)
- Exhibits46: Chart on Hydroxyapatite - Market size and forecast 2024-2029 ($ million)
- Exhibits47: Data Table on Hydroxyapatite - Market size and forecast 2024-2029 ($ million)
- Exhibits48: Chart on Hydroxyapatite - Year-over-year growth 2024-2029 (%)
- Exhibits49: Data Table on Hydroxyapatite - Year-over-year growth 2024-2029 (%)
- Exhibits50: Chart on Composite - Market size and forecast 2024-2029 ($ million)
- Exhibits51: Data Table on Composite - Market size and forecast 2024-2029 ($ million)
- Exhibits52: Chart on Composite - Year-over-year growth 2024-2029 (%)
- Exhibits53: Data Table on Composite - Year-over-year growth 2024-2029 (%)
- Exhibits54: Chart on Polymer - Market size and forecast 2024-2029 ($ million)
- Exhibits55: Data Table on Polymer - Market size and forecast 2024-2029 ($ million)
- Exhibits56: Chart on Polymer - Year-over-year growth 2024-2029 (%)
- Exhibits57: Data Table on Polymer - Year-over-year growth 2024-2029 (%)
- Exhibits58: Chart on Others - Market size and forecast 2024-2029 ($ million)
- Exhibits59: Data Table on Others - Market size and forecast 2024-2029 ($ million)
- Exhibits60: Chart on Others - Year-over-year growth 2024-2029 (%)
- Exhibits61: Data Table on Others - Year-over-year growth 2024-2029 (%)
- Exhibits62: Market opportunity by Material ($ million)
- Exhibits63: Data Table on Market opportunity by Material ($ million)
- Exhibits64: Chart on End-user - Market share 2024-2029 (%)
- Exhibits65: Data Table on End-user - Market share 2024-2029 (%)
- Exhibits66: Chart on Comparison by End-user
- Exhibits67: Data Table on Comparison by End-user
- Exhibits68: Chart on Hospitals - Market size and forecast 2024-2029 ($ million)
- Exhibits69: Data Table on Hospitals - Market size and forecast 2024-2029 ($ million)
- Exhibits70: Chart on Hospitals - Year-over-year growth 2024-2029 (%)
- Exhibits71: Data Table on Hospitals - Year-over-year growth 2024-2029 (%)
- Exhibits72: Chart on Specialty clinics - Market size and forecast 2024-2029 ($ million)
- Exhibits73: Data Table on Specialty clinics - Market size and forecast 2024-2029 ($ million)
- Exhibits74: Chart on Specialty clinics - Year-over-year growth 2024-2029 (%)
- Exhibits75: Data Table on Specialty clinics - Year-over-year growth 2024-2029 (%)
- Exhibits76: Chart on Research organization - Market size and forecast 2024-2029 ($ million)
- Exhibits77: Data Table on Research organization - Market size and forecast 2024-2029 ($ million)
- Exhibits78: Chart on Research organization - Year-over-year growth 2024-2029 (%)
- Exhibits79: Data Table on Research organization - Year-over-year growth 2024-2029 (%)
- Exhibits80: Market opportunity by End-user ($ million)
- Exhibits81: Data Table on Market opportunity by End-user ($ million)
- Exhibits82: Chart on Application - Market share 2024-2029 (%)
- Exhibits83: Data Table on Application - Market share 2024-2029 (%)
- Exhibits84: Chart on Comparison by Application
- Exhibits85: Data Table on Comparison by Application
- Exhibits86: Chart on Spinal Fusion - Market size and forecast 2024-2029 ($ million)
- Exhibits87: Data Table on Spinal Fusion - Market size and forecast 2024-2029 ($ million)
- Exhibits88: Chart on Spinal Fusion - Year-over-year growth 2024-2029 (%)
- Exhibits89: Data Table on Spinal Fusion - Year-over-year growth 2024-2029 (%)
- Exhibits90: Chart on Dental - Market size and forecast 2024-2029 ($ million)
- Exhibits91: Data Table on Dental - Market size and forecast 2024-2029 ($ million)
- Exhibits92: Chart on Dental - Year-over-year growth 2024-2029 (%)
- Exhibits93: Data Table on Dental - Year-over-year growth 2024-2029 (%)
- Exhibits94: Chart on Craniomaxillofacial - Market size and forecast 2024-2029 ($ million)
- Exhibits95: Data Table on Craniomaxillofacial - Market size and forecast 2024-2029 ($ million)
- Exhibits96: Chart on Craniomaxillofacial - Year-over-year growth 2024-2029 (%)
- Exhibits97: Data Table on Craniomaxillofacial - Year-over-year growth 2024-2029 (%)
- Exhibits98: Chart on Joint Reconstruction - Market size and forecast 2024-2029 ($ million)
- Exhibits99: Data Table on Joint Reconstruction - Market size and forecast 2024-2029 ($ million)
- Exhibits100: Chart on Joint Reconstruction - Year-over-year growth 2024-2029 (%)
- Exhibits101: Data Table on Joint Reconstruction - Year-over-year growth 2024-2029 (%)
- Exhibits102: Chart on Trauma and Extremities - Market size and forecast 2024-2029 ($ million)
- Exhibits103: Data Table on Trauma and Extremities - Market size and forecast 2024-2029 ($ million)
- Exhibits104: Chart on Trauma and Extremities - Year-over-year growth 2024-2029 (%)
- Exhibits105: Data Table on Trauma and Extremities - Year-over-year growth 2024-2029 (%)
- Exhibits106: Market opportunity by Application ($ million)
- Exhibits107: Data Table on Market opportunity by Application ($ million)
- Exhibits108: Analysis of price sensitivity, lifecycle, customer purchase basket, adoption rates, and purchase criteria
- Exhibits109: Chart on Market share By Geographical Landscape 2024-2029 (%)
- Exhibits110: Data Table on Market share By Geographical Landscape 2024-2029 (%)
- Exhibits111: Chart on Geographic comparison
- Exhibits112: Data Table on Geographic comparison
- Exhibits113: Chart on North America - Market size and forecast 2024-2029 ($ million)
- Exhibits114: Data Table on North America - Market size and forecast 2024-2029 ($ million)
- Exhibits115: Chart on North America - Year-over-year growth 2024-2029 (%)
- Exhibits116: Data Table on North America - Year-over-year growth 2024-2029 (%)
- Exhibits117: Chart on Europe - Market size and forecast 2024-2029 ($ million)
- Exhibits118: Data Table on Europe - Market size and forecast 2024-2029 ($ million)
- Exhibits119: Chart on Europe - Year-over-year growth 2024-2029 (%)
- Exhibits120: Data Table on Europe - Year-over-year growth 2024-2029 (%)
- Exhibits121: Chart on Asia - Market size and forecast 2024-2029 ($ million)
- Exhibits122: Data Table on Asia - Market size and forecast 2024-2029 ($ million)
- Exhibits123: Chart on Asia - Year-over-year growth 2024-2029 (%)
- Exhibits124: Data Table on Asia - Year-over-year growth 2024-2029 (%)
- Exhibits125: Chart on Rest of World (ROW) - Market size and forecast 2024-2029 ($ million)
- Exhibits126: Data Table on Rest of World (ROW) - Market size and forecast 2024-2029 ($ million)
- Exhibits127: Chart on Rest of World (ROW) - Year-over-year growth 2024-2029 (%)
- Exhibits128: Data Table on Rest of World (ROW) - Year-over-year growth 2024-2029 (%)
- Exhibits129: Chart on US - Market size and forecast 2024-2029 ($ million)
- Exhibits130: Data Table on US - Market size and forecast 2024-2029 ($ million)
- Exhibits131: Chart on US - Year-over-year growth 2024-2029 (%)
- Exhibits132: Data Table on US - Year-over-year growth 2024-2029 (%)
- Exhibits133: Chart on China - Market size and forecast 2024-2029 ($ million)
- Exhibits134: Data Table on China - Market size and forecast 2024-2029 ($ million)
- Exhibits135: Chart on China - Year-over-year growth 2024-2029 (%)
- Exhibits136: Data Table on China - Year-over-year growth 2024-2029 (%)
- Exhibits137: Chart on Germany - Market size and forecast 2024-2029 ($ million)
- Exhibits138: Data Table on Germany - Market size and forecast 2024-2029 ($ million)
- Exhibits139: Chart on Germany - Year-over-year growth 2024-2029 (%)
- Exhibits140: Data Table on Germany - Year-over-year growth 2024-2029 (%)
- Exhibits141: Chart on Canada - Market size and forecast 2024-2029 ($ million)
- Exhibits142: Data Table on Canada - Market size and forecast 2024-2029 ($ million)
- Exhibits143: Chart on Canada - Year-over-year growth 2024-2029 (%)
- Exhibits144: Data Table on Canada - Year-over-year growth 2024-2029 (%)
- Exhibits145: Chart on UK - Market size and forecast 2024-2029 ($ million)
- Exhibits146: Data Table on UK - Market size and forecast 2024-2029 ($ million)
- Exhibits147: Chart on UK - Year-over-year growth 2024-2029 (%)
- Exhibits148: Data Table on UK - Year-over-year growth 2024-2029 (%)
- Exhibits149: Chart on France - Market size and forecast 2024-2029 ($ million)
- Exhibits150: Data Table on France - Market size and forecast 2024-2029 ($ million)
- Exhibits151: Chart on France - Year-over-year growth 2024-2029 (%)
- Exhibits152: Data Table on France - Year-over-year growth 2024-2029 (%)
- Exhibits153: Chart on Japan - Market size and forecast 2024-2029 ($ million)
- Exhibits154: Data Table on Japan - Market size and forecast 2024-2029 ($ million)
- Exhibits155: Chart on Japan - Year-over-year growth 2024-2029 (%)
- Exhibits156: Data Table on Japan - Year-over-year growth 2024-2029 (%)
- Exhibits157: Chart on South Korea - Market size and forecast 2024-2029 ($ million)
- Exhibits158: Data Table on South Korea - Market size and forecast 2024-2029 ($ million)
- Exhibits159: Chart on South Korea - Year-over-year growth 2024-2029 (%)
- Exhibits160: Data Table on South Korea - Year-over-year growth 2024-2029 (%)
- Exhibits161: Chart on India - Market size and forecast 2024-2029 ($ million)
- Exhibits162: Data Table on India - Market size and forecast 2024-2029 ($ million)
- Exhibits163: Chart on India - Year-over-year growth 2024-2029 (%)
- Exhibits164: Data Table on India - Year-over-year growth 2024-2029 (%)
- Exhibits165: Chart on Italy - Market size and forecast 2024-2029 ($ million)
- Exhibits166: Data Table on Italy - Market size and forecast 2024-2029 ($ million)
- Exhibits167: Chart on Italy - Year-over-year growth 2024-2029 (%)
- Exhibits168: Data Table on Italy - Year-over-year growth 2024-2029 (%)
- Exhibits169: Market opportunity By Geographical Landscape ($ million)
- Exhibits170: Data Tables on Market opportunity By Geographical Landscape ($ million)
- Exhibits171: Impact of drivers and challenges in 2024 and 2029
- Exhibits172: Overview on criticality of inputs and factors of differentiation
- Exhibits173: Overview on factors of disruption
- Exhibits174: Impact of key risks on business
- Exhibits175: Companies covered
- Exhibits176: Company ranking index
- Exhibits177: Matrix on companies position and classification
- Exhibits178: AlloSource - Overview
- Exhibits179: AlloSource - Product / Service
- Exhibits180: AlloSource - Key offerings
- Exhibits181: SWOT
- Exhibits182: Baxter International Inc. - Overview
- Exhibits183: Baxter International Inc. - Business segments
- Exhibits184: Baxter International Inc. - Key news
- Exhibits185: Baxter International Inc. - Key offerings
- Exhibits186: Baxter International Inc. - Segment focus
- Exhibits187: SWOT
- Exhibits188: Biomatlante SAS - Overview
- Exhibits189: Biomatlante SAS - Product / Service
- Exhibits190: Biomatlante SAS - Key news
- Exhibits191: Biomatlante SAS - Key offerings
- Exhibits192: SWOT
- Exhibits193: DSM-Firmenich AG - Overview
- Exhibits194: DSM-Firmenich AG - Business segments
- Exhibits195: DSM-Firmenich AG - Key news
- Exhibits196: DSM-Firmenich AG - Key offerings
- Exhibits197: DSM-Firmenich AG - Segment focus
- Exhibits198: SWOT
- Exhibits199: HOYA CORP. - Overview
- Exhibits200: HOYA CORP. - Business segments
- Exhibits201: HOYA CORP. - Key offerings
- Exhibits202: HOYA CORP. - Segment focus
- Exhibits203: SWOT
- Exhibits204: Johnson and Johnson Services Inc. - Overview
- Exhibits205: Johnson and Johnson Services Inc. - Business segments
- Exhibits206: Johnson and Johnson Services Inc. - Key news
- Exhibits207: Johnson and Johnson Services Inc. - Key offerings
- Exhibits208: Johnson and Johnson Services Inc. - Segment focus
- Exhibits209: SWOT
- Exhibits210: Medtronic Plc - Overview
- Exhibits211: Medtronic Plc - Business segments
- Exhibits212: Medtronic Plc - Key news
- Exhibits213: Medtronic Plc - Key offerings
- Exhibits214: Medtronic Plc - Segment focus
- Exhibits215: SWOT
- Exhibits216: NuVasive Inc. - Overview
- Exhibits217: NuVasive Inc. - Business segments
- Exhibits218: NuVasive Inc. - Key offerings
- Exhibits219: NuVasive Inc. - Segment focus
- Exhibits220: SWOT
- Exhibits221: Orthofix Medical Inc. - Overview
- Exhibits222: Orthofix Medical Inc. - Business segments
- Exhibits223: Orthofix Medical Inc. - Key offerings
- Exhibits224: Orthofix Medical Inc. - Segment focus
- Exhibits225: SWOT
- Exhibits226: Shenzhen Mindray BioMedical Electronics Co. Ltd. - Overview
- Exhibits227: Shenzhen Mindray BioMedical Electronics Co. Ltd. - Product / Service
- Exhibits228: Shenzhen Mindray BioMedical Electronics Co. Ltd. - Key news
- Exhibits229: Shenzhen Mindray BioMedical Electronics Co. Ltd. - Key offerings
- Exhibits230: SWOT
- Exhibits231: Smith and Nephew plc - Overview
- Exhibits232: Smith and Nephew plc - Business segments
- Exhibits233: Smith and Nephew plc - Key news
- Exhibits234: Smith and Nephew plc - Key offerings
- Exhibits235: Smith and Nephew plc - Segment focus
- Exhibits236: SWOT
- Exhibits237: Stryker Corp. - Overview
- Exhibits238: Stryker Corp. - Business segments
- Exhibits239: Stryker Corp. - Key news
- Exhibits240: Stryker Corp. - Key offerings
- Exhibits241: Stryker Corp. - Segment focus
- Exhibits242: SWOT
- Exhibits243: Xtant Medical Holdings Inc. - Overview
- Exhibits244: Xtant Medical Holdings Inc. - Product / Service
- Exhibits245: Xtant Medical Holdings Inc. - Key offerings
- Exhibits246: SWOT
- Exhibits247: Ziacom Medical S.L. - Overview
- Exhibits248: Ziacom Medical S.L. - Product / Service
- Exhibits249: Ziacom Medical S.L. - Key offerings
- Exhibits250: SWOT
- Exhibits251: Zimmer Biomet Holdings Inc. - Overview
- Exhibits252: Zimmer Biomet Holdings Inc. - Business segments
- Exhibits253: Zimmer Biomet Holdings Inc. - Key news
- Exhibits254: Zimmer Biomet Holdings Inc. - Key offerings
- Exhibits255: Zimmer Biomet Holdings Inc. - Segment focus
- Exhibits256: SWOT
- Exhibits257: Inclusions checklist
- Exhibits258: Exclusions checklist
- Exhibits259: Currency conversion rates for US$
- Exhibits260: Research methodology
- Exhibits261: Information sources
- Exhibits262: Data validation
- Exhibits263: Validation techniques employed for market sizing
- Exhibits264: Data synthesis
- Exhibits265: 360 degree market analysis
- Exhibits266: List of abbreviations
The artificial bone market is forecasted to grow by USD 242.3 mn during 2024-2029, accelerating at a CAGR of 10% during the forecast period. The report on the artificial bone market provides a holistic analysis, market size and forecast, trends, growth drivers, and challenges, as well as vendor analysis covering around 25 vendors.
The report offers an up-to-date analysis regarding the current market scenario, the latest trends and drivers, and the overall market environment. The market is driven by rising geriatric population globally, increasing prevalence of bone disorders and injuries, and rising awareness and accessibility to advanced medical treatments.
| Market Scope | |
|---|---|
| Base Year | 2025 |
| End Year | 2029 |
| Series Year | 2025-2029 |
| Growth Momentum | Accelerate |
| YOY 2025 | 8.9% |
| CAGR | 10% |
| Incremental Value | $242.3 mn |
The study was conducted using an objective combination of primary and secondary information including inputs from key participants in the industry. The report contains a comprehensive market size data, segment with regional analysis and vendor landscape in addition to an analysis of the key companies. Reports have historic and forecast data.
Technavio's artificial bone market is segmented as below:
By Material
- Ceramics
- Hydroxyapatite
- Composite
- Polymer
- Others
By End-user
- Hospitals
- Specialty clinics
- Research organization
By Application
- Spinal Fusion
- Dental
- Craniomaxillofacial
- Joint Reconstruction
- Trauma and Extremities
By Geographical Landscape
- North America
- Europe
- Asia
- Rest of World (ROW)
This study identifies the high prevalence of osteoporosis as one of the prime reasons driving the artificial bone market growth during the next few years. Also, growing use of 3D printing technology in bone implants and increasing adoption of minimally invasive techniques will lead to sizable demand in the market.
The report on the artificial bone market covers the following areas:
- Artificial Bone Market sizing
- Artificial Bone Market forecast
- Artificial Bone Market industry analysis
The robust vendor analysis is designed to help clients improve their market position, and in line with this, this report provides a detailed analysis of several leading artificial bone market vendors that include Aditus Medical GmbH, AlloSource, Bando Chemical Industries Ltd., Baxter International Inc., Biomatlante SAS, Curasan Inc., DSM-Firmenich AG, Graftys SA, HOYA CORP., Johnson and Johnson Services Inc., Maxigen Biotech Inc., Medtronic Plc, NuVasive Inc., Orthofix Medical Inc., Shenzhen Mindray BioMedical Electronics Co. Ltd., Smith and Nephew plc, Stryker Corp., Xtant Medical Holdings Inc., Ziacom Medical S.L., and Zimmer Biomet Holdings Inc.. Also, the artificial bone market analysis report includes information on upcoming trends and challenges that will influence market growth. This is to help companies strategize and leverage all forthcoming growth opportunities.
The publisher presents a detailed picture of the market by the way of study, synthesis, and summation of data from multiple sources by an analysis of key parameters such as profit, pricing, competition, and promotions. It presents various market facets by identifying the key industry influencers. The data presented is comprehensive, reliable, and a result of extensive primary and secondary research. The market research reports provide a complete competitive landscape and an in-depth vendor selection methodology and analysis using qualitative and quantitative research to forecast accurate market growth.
Table of Contents
1 Executive Summary
- 1.1 Market overview
- Executive Summary - Chart on Market Overview
- Executive Summary - Data Table on Market Overview
- Executive Summary - Chart on Global Market Characteristics
- Executive Summary - Chart on Market By Geographical Landscape
- Executive Summary - Chart on Market Segmentation by Material
- Executive Summary - Chart on Market Segmentation by End-user
- Executive Summary - Chart on Market Segmentation by Application
- Executive Summary - Chart on Incremental Growth
- Executive Summary - Data Table on Incremental Growth
- Executive Summary - Chart on Company Market Positioning
2 Technavio Analysis
- 2.1 Analysis of price sensitivity, lifecycle, customer purchase basket, adoption rates, and purchase criteria
- Analysis of price sensitivity, lifecycle, customer purchase basket, adoption rates, and purchase criteria
- 2.2 Criticality of inputs and Factors of differentiation
- Overview on criticality of inputs and factors of differentiation
- 2.3 Factors of disruption
- Overview on factors of disruption
- 2.4 Impact of drivers and challenges
- Impact of drivers and challenges in 2024 and 2029
3 Market Landscape
- 3.1 Market ecosystem
- Parent Market
- Data Table on - Parent Market
- 3.2 Market characteristics
- Market characteristics analysis
- 3.3 Value chain analysis
- Value chain analysis
4 Market Sizing
- 4.1 Market definition
- Offerings of companies included in the market definition
- 4.2 Market segment analysis
- Market segments
- 4.3 Market size 2024
- 4.4 Market outlook: Forecast for 2024-2029
- Chart on Global - Market size and forecast 2024-2029 ($ million)
- Data Table on Global - Market size and forecast 2024-2029 ($ million)
- Chart on Global Market: Year-over-year growth 2024-2029 (%)
- Data Table on Global Market: Year-over-year growth 2024-2029 (%)
5 Historic Market Size
- 5.1 Global Artificial Bone Market 2019 - 2023
- Historic Market Size - Data Table on Global Artificial Bone Market 2019 - 2023 ($ million)
- 5.2 Material segment analysis 2019 - 2023
- Historic Market Size - Material Segment 2019 - 2023 ($ million)
- 5.3 End-user segment analysis 2019 - 2023
- Historic Market Size - End-user Segment 2019 - 2023 ($ million)
- 5.4 Application segment analysis 2019 - 2023
- Historic Market Size - Application Segment 2019 - 2023 ($ million)
- 5.5 Geography segment analysis 2019 - 2023
- Historic Market Size - Geography Segment 2019 - 2023 ($ million)
- 5.6 Country segment analysis 2019 - 2023
- Historic Market Size - Country Segment 2019 - 2023 ($ million)
6 Qualitative Analysis
- 6.1 The impact of AI in the global artificial bone market
7 Five Forces Analysis
- 7.1 Five forces summary
- Five forces analysis - Comparison between 2024 and 2029
- 7.2 Bargaining power of buyers
- Bargaining power of buyers - Impact of key factors 2024 and 2029
- 7.3 Bargaining power of suppliers
- Bargaining power of suppliers - Impact of key factors in 2024 and 2029
- 7.4 Threat of new entrants
- Threat of new entrants - Impact of key factors in 2024 and 2029
- 7.5 Threat of substitutes
- Threat of substitutes - Impact of key factors in 2024 and 2029
- 7.6 Threat of rivalry
- Threat of rivalry - Impact of key factors in 2024 and 2029
- 7.7 Market condition
- Chart on Market condition - Five forces 2024 and 2029
8 Market Segmentation by Material
- 8.1 Market segments
- Chart on Material - Market share 2024-2029 (%)
- Data Table on Material - Market share 2024-2029 (%)
- 8.2 Comparison by Material
- Chart on Comparison by Material
- Data Table on Comparison by Material
- 8.3 Ceramics - Market size and forecast 2024-2029
- Chart on Ceramics - Market size and forecast 2024-2029 ($ million)
- Data Table on Ceramics - Market size and forecast 2024-2029 ($ million)
- Chart on Ceramics - Year-over-year growth 2024-2029 (%)
- Data Table on Ceramics - Year-over-year growth 2024-2029 (%)
- 8.4 Hydroxyapatite - Market size and forecast 2024-2029
- Chart on Hydroxyapatite - Market size and forecast 2024-2029 ($ million)
- Data Table on Hydroxyapatite - Market size and forecast 2024-2029 ($ million)
- Chart on Hydroxyapatite - Year-over-year growth 2024-2029 (%)
- Data Table on Hydroxyapatite - Year-over-year growth 2024-2029 (%)
- 8.5 Composite - Market size and forecast 2024-2029
- Chart on Composite - Market size and forecast 2024-2029 ($ million)
- Data Table on Composite - Market size and forecast 2024-2029 ($ million)
- Chart on Composite - Year-over-year growth 2024-2029 (%)
- Data Table on Composite - Year-over-year growth 2024-2029 (%)
- 8.6 Polymer - Market size and forecast 2024-2029
- Chart on Polymer - Market size and forecast 2024-2029 ($ million)
- Data Table on Polymer - Market size and forecast 2024-2029 ($ million)
- Chart on Polymer - Year-over-year growth 2024-2029 (%)
- Data Table on Polymer - Year-over-year growth 2024-2029 (%)
- 8.7 Others - Market size and forecast 2024-2029
- Chart on Others - Market size and forecast 2024-2029 ($ million)
- Data Table on Others - Market size and forecast 2024-2029 ($ million)
- Chart on Others - Year-over-year growth 2024-2029 (%)
- Data Table on Others - Year-over-year growth 2024-2029 (%)
- 8.8 Market opportunity by Material
- Market opportunity by Material ($ million)
- Data Table on Market opportunity by Material ($ million)
9 Market Segmentation by End-user
- 9.1 Market segments
- Chart on End-user - Market share 2024-2029 (%)
- Data Table on End-user - Market share 2024-2029 (%)
- 9.2 Comparison by End-user
- Chart on Comparison by End-user
- Data Table on Comparison by End-user
- 9.3 Hospitals - Market size and forecast 2024-2029
- Chart on Hospitals - Market size and forecast 2024-2029 ($ million)
- Data Table on Hospitals - Market size and forecast 2024-2029 ($ million)
- Chart on Hospitals - Year-over-year growth 2024-2029 (%)
- Data Table on Hospitals - Year-over-year growth 2024-2029 (%)
- 9.4 Specialty clinics - Market size and forecast 2024-2029
- Chart on Specialty clinics - Market size and forecast 2024-2029 ($ million)
- Data Table on Specialty clinics - Market size and forecast 2024-2029 ($ million)
- Chart on Specialty clinics - Year-over-year growth 2024-2029 (%)
- Data Table on Specialty clinics - Year-over-year growth 2024-2029 (%)
- 9.5 Research organization - Market size and forecast 2024-2029
- Chart on Research organization - Market size and forecast 2024-2029 ($ million)
- Data Table on Research organization - Market size and forecast 2024-2029 ($ million)
- Chart on Research organization - Year-over-year growth 2024-2029 (%)
- Data Table on Research organization - Year-over-year growth 2024-2029 (%)
- 9.6 Market opportunity by End-user
- Market opportunity by End-user ($ million)
- Data Table on Market opportunity by End-user ($ million)
10 Market Segmentation by Application
- 10.1 Market segments
- Chart on Application - Market share 2024-2029 (%)
- Data Table on Application - Market share 2024-2029 (%)
- 10.2 Comparison by Application
- Chart on Comparison by Application
- Data Table on Comparison by Application
- 10.3 Spinal Fusion - Market size and forecast 2024-2029
- Chart on Spinal Fusion - Market size and forecast 2024-2029 ($ million)
- Data Table on Spinal Fusion - Market size and forecast 2024-2029 ($ million)
- Chart on Spinal Fusion - Year-over-year growth 2024-2029 (%)
- Data Table on Spinal Fusion - Year-over-year growth 2024-2029 (%)
- 10.4 Dental - Market size and forecast 2024-2029
- Chart on Dental - Market size and forecast 2024-2029 ($ million)
- Data Table on Dental - Market size and forecast 2024-2029 ($ million)
- Chart on Dental - Year-over-year growth 2024-2029 (%)
- Data Table on Dental - Year-over-year growth 2024-2029 (%)
- 10.5 Craniomaxillofacial - Market size and forecast 2024-2029
- Chart on Craniomaxillofacial - Market size and forecast 2024-2029 ($ million)
- Data Table on Craniomaxillofacial - Market size and forecast 2024-2029 ($ million)
- Chart on Craniomaxillofacial - Year-over-year growth 2024-2029 (%)
- Data Table on Craniomaxillofacial - Year-over-year growth 2024-2029 (%)
- 10.6 Joint Reconstruction - Market size and forecast 2024-2029
- Chart on Joint Reconstruction - Market size and forecast 2024-2029 ($ million)
- Data Table on Joint Reconstruction - Market size and forecast 2024-2029 ($ million)
- Chart on Joint Reconstruction - Year-over-year growth 2024-2029 (%)
- Data Table on Joint Reconstruction - Year-over-year growth 2024-2029 (%)
- 10.7 Trauma and Extremities - Market size and forecast 2024-2029
- Chart on Trauma and Extremities - Market size and forecast 2024-2029 ($ million)
- Data Table on Trauma and Extremities - Market size and forecast 2024-2029 ($ million)
- Chart on Trauma and Extremities - Year-over-year growth 2024-2029 (%)
- Data Table on Trauma and Extremities - Year-over-year growth 2024-2029 (%)
- 10.8 Market opportunity by Application
- Market opportunity by Application ($ million)
- Data Table on Market opportunity by Application ($ million)
11 Customer Landscape
- 11.1 Customer landscape overview
- Analysis of price sensitivity, lifecycle, customer purchase basket, adoption rates, and purchase criteria
12 Geographic Landscape
- 12.1 Geographic segmentation
- Chart on Market share By Geographical Landscape 2024-2029 (%)
- Data Table on Market share By Geographical Landscape 2024-2029 (%)
- 12.2 Geographic comparison
- Chart on Geographic comparison
- Data Table on Geographic comparison
- 12.3 North America - Market size and forecast 2024-2029
- Chart on North America - Market size and forecast 2024-2029 ($ million)
- Data Table on North America - Market size and forecast 2024-2029 ($ million)
- Chart on North America - Year-over-year growth 2024-2029 (%)
- Data Table on North America - Year-over-year growth 2024-2029 (%)
- 12.4 Europe - Market size and forecast 2024-2029
- Chart on Europe - Market size and forecast 2024-2029 ($ million)
- Data Table on Europe - Market size and forecast 2024-2029 ($ million)
- Chart on Europe - Year-over-year growth 2024-2029 (%)
- Data Table on Europe - Year-over-year growth 2024-2029 (%)
- 12.5 Asia - Market size and forecast 2024-2029
- Chart on Asia - Market size and forecast 2024-2029 ($ million)
- Data Table on Asia - Market size and forecast 2024-2029 ($ million)
- Chart on Asia - Year-over-year growth 2024-2029 (%)
- Data Table on Asia - Year-over-year growth 2024-2029 (%)
- 12.6 Rest of World (ROW) - Market size and forecast 2024-2029
- Chart on Rest of World (ROW) - Market size and forecast 2024-2029 ($ million)
- Data Table on Rest of World (ROW) - Market size and forecast 2024-2029 ($ million)
- Chart on Rest of World (ROW) - Year-over-year growth 2024-2029 (%)
- Data Table on Rest of World (ROW) - Year-over-year growth 2024-2029 (%)
- 12.7 US - Market size and forecast 2024-2029
- Chart on US - Market size and forecast 2024-2029 ($ million)
- Data Table on US - Market size and forecast 2024-2029 ($ million)
- Chart on US - Year-over-year growth 2024-2029 (%)
- Data Table on US - Year-over-year growth 2024-2029 (%)
- 12.8 China - Market size and forecast 2024-2029
- Chart on China - Market size and forecast 2024-2029 ($ million)
- Data Table on China - Market size and forecast 2024-2029 ($ million)
- Chart on China - Year-over-year growth 2024-2029 (%)
- Data Table on China - Year-over-year growth 2024-2029 (%)
- 12.9 Germany - Market size and forecast 2024-2029
- Chart on Germany - Market size and forecast 2024-2029 ($ million)
- Data Table on Germany - Market size and forecast 2024-2029 ($ million)
- Chart on Germany - Year-over-year growth 2024-2029 (%)
- Data Table on Germany - Year-over-year growth 2024-2029 (%)
- 12.10 Canada - Market size and forecast 2024-2029
- Chart on Canada - Market size and forecast 2024-2029 ($ million)
- Data Table on Canada - Market size and forecast 2024-2029 ($ million)
- Chart on Canada - Year-over-year growth 2024-2029 (%)
- Data Table on Canada - Year-over-year growth 2024-2029 (%)
- 12.11 UK - Market size and forecast 2024-2029
- Chart on UK - Market size and forecast 2024-2029 ($ million)
- Data Table on UK - Market size and forecast 2024-2029 ($ million)
- Chart on UK - Year-over-year growth 2024-2029 (%)
- Data Table on UK - Year-over-year growth 2024-2029 (%)
- 12.12 France - Market size and forecast 2024-2029
- Chart on France - Market size and forecast 2024-2029 ($ million)
- Data Table on France - Market size and forecast 2024-2029 ($ million)
- Chart on France - Year-over-year growth 2024-2029 (%)
- Data Table on France - Year-over-year growth 2024-2029 (%)
- 12.13 Japan - Market size and forecast 2024-2029
- Chart on Japan - Market size and forecast 2024-2029 ($ million)
- Data Table on Japan - Market size and forecast 2024-2029 ($ million)
- Chart on Japan - Year-over-year growth 2024-2029 (%)
- Data Table on Japan - Year-over-year growth 2024-2029 (%)
- 12.14 South Korea - Market size and forecast 2024-2029
- Chart on South Korea - Market size and forecast 2024-2029 ($ million)
- Data Table on South Korea - Market size and forecast 2024-2029 ($ million)
- Chart on South Korea - Year-over-year growth 2024-2029 (%)
- Data Table on South Korea - Year-over-year growth 2024-2029 (%)
- 12.15 India - Market size and forecast 2024-2029
- Chart on India - Market size and forecast 2024-2029 ($ million)
- Data Table on India - Market size and forecast 2024-2029 ($ million)
- Chart on India - Year-over-year growth 2024-2029 (%)
- Data Table on India - Year-over-year growth 2024-2029 (%)
- 12.16 Italy - Market size and forecast 2024-2029
- Chart on Italy - Market size and forecast 2024-2029 ($ million)
- Data Table on Italy - Market size and forecast 2024-2029 ($ million)
- Chart on Italy - Year-over-year growth 2024-2029 (%)
- Data Table on Italy - Year-over-year growth 2024-2029 (%)
- 12.17 Market opportunity By Geographical Landscape
- Market opportunity By Geographical Landscape ($ million)
- Data Tables on Market opportunity By Geographical Landscape ($ million)
13 Drivers, Challenges, and Opportunity/Restraints
- 13.1 Market drivers
- 13.2 Market challenges
- 13.3 Impact of drivers and challenges
- Impact of drivers and challenges in 2024 and 2029
- 13.4 Market opportunities/restraints
14 Competitive Landscape
- 14.1 Overview
- 14.2 Competitive Landscape
- Overview on criticality of inputs and factors of differentiation
- 14.3 Landscape disruption
- Overview on factors of disruption
- 14.4 Industry risks
- Impact of key risks on business
15 Competitive Analysis
- 15.1 Companies profiled
- Companies covered
- 15.2 Company ranking index
- Company ranking index
- 15.3 Market positioning of companies
- Matrix on companies position and classification
- 15.4 AlloSource
- AlloSource - Overview
- AlloSource - Product / Service
- AlloSource - Key offerings
- SWOT
- 15.5 Baxter International Inc.
- Baxter International Inc. - Overview
- Baxter International Inc. - Business segments
- Baxter International Inc. - Key news
- Baxter International Inc. - Key offerings
- Baxter International Inc. - Segment focus
- SWOT
- 15.6 Biomatlante SAS
- Biomatlante SAS - Overview
- Biomatlante SAS - Product / Service
- Biomatlante SAS - Key news
- Biomatlante SAS - Key offerings
- SWOT
- 15.7 DSM-Firmenich AG
- DSM-Firmenich AG - Overview
- DSM-Firmenich AG - Business segments
- DSM-Firmenich AG - Key news
- DSM-Firmenich AG - Key offerings
- DSM-Firmenich AG - Segment focus
- SWOT
- 15.8 HOYA CORP.
- HOYA CORP. - Overview
- HOYA CORP. - Business segments
- HOYA CORP. - Key offerings
- HOYA CORP. - Segment focus
- SWOT
- 15.9 Johnson and Johnson Services Inc.
- Johnson and Johnson Services Inc. - Overview
- Johnson and Johnson Services Inc. - Business segments
- Johnson and Johnson Services Inc. - Key news
- Johnson and Johnson Services Inc. - Key offerings
- Johnson and Johnson Services Inc. - Segment focus
- SWOT
- 15.10 Medtronic Plc
- Medtronic Plc - Overview
- Medtronic Plc - Business segments
- Medtronic Plc - Key news
- Medtronic Plc - Key offerings
- Medtronic Plc - Segment focus
- SWOT
- 15.11 NuVasive Inc.
- NuVasive Inc. - Overview
- NuVasive Inc. - Business segments
- NuVasive Inc. - Key offerings
- NuVasive Inc. - Segment focus
- SWOT
- 15.12 Orthofix Medical Inc.
- Orthofix Medical Inc. - Overview
- Orthofix Medical Inc. - Business segments
- Orthofix Medical Inc. - Key offerings
- Orthofix Medical Inc. - Segment focus
- SWOT
- 15.13 Shenzhen Mindray BioMedical Electronics Co. Ltd.
- Shenzhen Mindray BioMedical Electronics Co. Ltd. - Overview
- Shenzhen Mindray BioMedical Electronics Co. Ltd. - Product / Service
- Shenzhen Mindray BioMedical Electronics Co. Ltd. - Key news
- Shenzhen Mindray BioMedical Electronics Co. Ltd. - Key offerings
- SWOT
- 15.14 Smith and Nephew plc
- Smith and Nephew plc - Overview
- Smith and Nephew plc - Business segments
- Smith and Nephew plc - Key news
- Smith and Nephew plc - Key offerings
- Smith and Nephew plc - Segment focus
- SWOT
- 15.15 Stryker Corp.
- Stryker Corp. - Overview
- Stryker Corp. - Business segments
- Stryker Corp. - Key news
- Stryker Corp. - Key offerings
- Stryker Corp. - Segment focus
- SWOT
- 15.16 Xtant Medical Holdings Inc.
- Xtant Medical Holdings Inc. - Overview
- Xtant Medical Holdings Inc. - Product / Service
- Xtant Medical Holdings Inc. - Key offerings
- SWOT
- 15.17 Ziacom Medical S.L.
- Ziacom Medical S.L. - Overview
- Ziacom Medical S.L. - Product / Service
- Ziacom Medical S.L. - Key offerings
- SWOT
- 15.18 Zimmer Biomet Holdings Inc.
- Zimmer Biomet Holdings Inc. - Overview
- Zimmer Biomet Holdings Inc. - Business segments
- Zimmer Biomet Holdings Inc. - Key news
- Zimmer Biomet Holdings Inc. - Key offerings
- Zimmer Biomet Holdings Inc. - Segment focus
- SWOT
16 Appendix
- 16.1 Scope of the report
- 16.2 Inclusions and exclusions checklist
- Inclusions checklist
- Exclusions checklist
- 16.3 Currency conversion rates for US$
- Currency conversion rates for US$
- 16.4 Research methodology
- Research methodology
- 16.5 Data procurement
- Information sources
- 16.6 Data validation
- Data validation
- 16.7 Validation techniques employed for market sizing
- Validation techniques employed for market sizing
- 16.8 Data synthesis
- Data synthesis
- 16.9 360 degree market analysis
- 360 degree market analysis
- 16.10 List of abbreviations
- List of abbreviations

