|
|
市場調査レポート
商品コード
1525120
ヒノキチオールの世界市場 2024-2028Global hinokitiol market 2024-2028 |
||||||
|
|||||||
カスタマイズ可能
|
|||||||

| ヒノキチオールの世界市場 2024-2028 |
|
出版日: 2024年05月20日
発行: TechNavio
ページ情報: 英文 158 Pages
納期: 即納可能
|

全表示
- 概要
- 図表
- 目次
ヒノキチオール市場は2023-2028年に1,394万2,200米ドル、予測期間中のCAGRは4.36%で成長すると予測されます。
当レポートでは、ヒノキチオール市場の全体的な分析、市場規模・予測、動向、成長促進要因、課題、約25のベンダーを網羅したベンダー分析などを掲載しています。
現在の市場シナリオ、最新動向と促進要因、市場環境全体に関する最新分析を提供しています。市場は、パーソナルケアおよび化粧品製品の需要増加、飲食品における防腐剤としてのヒノキチオールの使用増加、医薬品およびヘルスケア製品における用途の拡大によって牽引されています。
| 市場範囲 | |
|---|---|
| 基準年 | 2024 |
| 終了年 | 2028 |
| 予測期間 | 2024-2028 |
| 成長モメンタム | 加速 |
| 前年比2024年 | 4.11% |
| CAGR | 4.36% |
| 増分額 | 1,394万2,000米ドル |
本調査では、今後数年間のヒノキチオール市場成長を促進する主な要因の一つとして、天然素材やオーガニック製品への嗜好の高まりを挙げています。また、ヒノキチオールの抗菌特性に対する意識の高まりや、出血性ショックによる肝障害の治療にヒノキチオールが使用されるようになったことも、市場の大きな需要につながると考えられます。
目次
第1章 エグゼクティブサマリー
- 市場概要
第2章 市場情勢
- 市場エコシステム
- 市場の特徴
- バリューチェーン分析
第3章 市場規模の評価
- 市場の定義
- 市場セグメント分析
- 市場規模 2023
- 市場の見通し 2023-2028
第4章 市場規模実績
- 世界ヒノキチオール市場 2018-2022
- 用途別セグメント分析 2018-2022
- 地域別セグメント分析 2018-2022
- 国別セグメント分析 2018-2022
第5章 ファイブフォース分析
- ファイブフォースの要約
- 買い手の交渉力
- 供給企業の交渉力
- 新規参入業者の脅威
- 代替品の脅威
- 競争の脅威
- 市況
第6章 市場セグメンテーション:用途別
- 市場セグメンテーション
- 比較:用途別
- 化粧品・パーソナルケア原料:市場規模と予測 2023-2028
- 食品成分:市場規模と予測 2023-2028
- 医薬品およびライフサイエンス:市場規模と予測 2023-2028
- 市場機会:用途別
第7章 顧客情勢
- 顧客情勢の概要
第8章 地域別情勢
- 地域別セグメンテーション
- 地域別比較
- 北米:市場規模と予測 2023-2028
- アジア太平洋:市場規模と予測 2023-2028
- 欧州:市場規模と予測 2023-2028
- 南米:市場規模と予測 2023-2028
- 中東・アフリカ:市場規模と予測 2023-2028
- 米国:市場規模と予測 2023-2028
- 中国:市場規模と予測 2023-2028
- 日本:市場規模と予測 2023-2028
- カナダ:市場規模と予測 2023-2028
- 英国:市場規模と予測 2023-2028
- 市場機会:地域情勢別
第9章 促進要因・課題・機会・抑制要因
- 市場促進要因
- 市場の課題
- 促進要因と課題の影響
- 市場の機会・抑制要因
第10章 競合情勢
- 概要
- 競合情勢
- 混乱の状況
- 業界のリスク
第11章 競合分析
- 企業プロファイル
- 企業の市場ポジショニング
- AbMole BioScience
- Capot Chemical Co. Ltd.
- Cayman Chemical
- ChemScene
- Danaher Corp.
- Glentham Life Sciences Ltd.
- Glixx Laboratories Inc.
- J and K Scientific LLC
- Merck KGaA
- StressMarq Biosciences Inc.
- Tokyo Chemical Industry Co. Ltd.
- Toronto Research Chemicals Inc.
- Wuhan ChemFaces Biochemical Co. Ltd.
- Xi an Xszo Chem Co. Ltd.
- Zhejiang Multinpharma Co. Ltd.
第12章 付録
Exhibits:
- Exhibits1: Executive Summary - Chart on Market Overview
- Exhibits2: Executive Summary - Data Table on Market Overview
- Exhibits3: Executive Summary - Chart on Global Market Characteristics
- Exhibits4: Executive Summary - Chart on Market By Geographical Landscape
- Exhibits5: Executive Summary - Chart on Market Segmentation by Application
- Exhibits6: Executive Summary - Chart on Incremental Growth
- Exhibits7: Executive Summary - Data Table on Incremental Growth
- Exhibits8: Executive Summary - Chart on Company Market Positioning
- Exhibits9: Parent Market
- Exhibits10: Data Table on - Parent Market
- Exhibits11: Market characteristics analysis
- Exhibits12: Value Chain Analysis
- Exhibits13: Offerings of companies included in the market definition
- Exhibits14: Market segments
- Exhibits15: Chart on Global - Market size and forecast 2023-2028 ($ thousand)
- Exhibits16: Data Table on Global - Market size and forecast 2023-2028 ($ thousand)
- Exhibits17: Chart on Global Market: Year-over-year growth 2023-2028 (%)
- Exhibits18: Data Table on Global Market: Year-over-year growth 2023-2028 (%)
- Exhibits19: Historic Market Size - Data Table on Global Hinokitiol Market 2018 - 2022 ($ thousand)
- Exhibits20: Historic Market Size - Application Segment 2018 - 2022 ($ thousand)
- Exhibits21: Historic Market Size - Geography Segment 2018 - 2022 ($ thousand)
- Exhibits22: Historic Market Size - Country Segment 2018 - 2022 ($ thousand)
- Exhibits23: Five forces analysis - Comparison between 2023 and 2028
- Exhibits24: Bargaining power of buyers - Impact of key factors 2023 and 2028
- Exhibits25: Bargaining power of suppliers - Impact of key factors in 2023 and 2028
- Exhibits26: Threat of new entrants - Impact of key factors in 2023 and 2028
- Exhibits27: Threat of substitutes - Impact of key factors in 2023 and 2028
- Exhibits28: Threat of rivalry - Impact of key factors in 2023 and 2028
- Exhibits29: Chart on Market condition - Five forces 2023 and 2028
- Exhibits30: Chart on Application - Market share 2023-2028 (%)
- Exhibits31: Data Table on Application - Market share 2023-2028 (%)
- Exhibits32: Chart on Comparison by Application
- Exhibits33: Data Table on Comparison by Application
- Exhibits34: Chart on Cosmetic/personal care ingredient - Market size and forecast 2023-2028 ($ thousand)
- Exhibits35: Data Table on Cosmetic/personal care ingredient - Market size and forecast 2023-2028 ($ thousand)
- Exhibits36: Chart on Cosmetic/personal care ingredient - Year-over-year growth 2023-2028 (%)
- Exhibits37: Data Table on Cosmetic/personal care ingredient - Year-over-year growth 2023-2028 (%)
- Exhibits38: Chart on Food ingredient - Market size and forecast 2023-2028 ($ thousand)
- Exhibits39: Data Table on Food ingredient - Market size and forecast 2023-2028 ($ thousand)
- Exhibits40: Chart on Food ingredient - Year-over-year growth 2023-2028 (%)
- Exhibits41: Data Table on Food ingredient - Year-over-year growth 2023-2028 (%)
- Exhibits42: Chart on Pharmaceuticals and life science - Market size and forecast 2023-2028 ($ thousand)
- Exhibits43: Data Table on Pharmaceuticals and life science - Market size and forecast 2023-2028 ($ thousand)
- Exhibits44: Chart on Pharmaceuticals and life science - Year-over-year growth 2023-2028 (%)
- Exhibits45: Data Table on Pharmaceuticals and life science - Year-over-year growth 2023-2028 (%)
- Exhibits46: Market opportunity by Application ($ thousand)
- Exhibits47: Data Table on Market opportunity by Application ($ thousand)
- Exhibits48: Analysis of price sensitivity, lifecycle, customer purchase basket, adoption rates, and purchase criteria
- Exhibits49: Chart on Market share By Geographical Landscape 2023-2028 (%)
- Exhibits50: Data Table on Market share By Geographical Landscape 2023-2028 (%)
- Exhibits51: Chart on Geographic comparison
- Exhibits52: Data Table on Geographic comparison
- Exhibits53: Chart on North America - Market size and forecast 2023-2028 ($ thousand)
- Exhibits54: Data Table on North America - Market size and forecast 2023-2028 ($ thousand)
- Exhibits55: Chart on North America - Year-over-year growth 2023-2028 (%)
- Exhibits56: Data Table on North America - Year-over-year growth 2023-2028 (%)
- Exhibits57: Chart on APAC - Market size and forecast 2023-2028 ($ thousand)
- Exhibits58: Data Table on APAC - Market size and forecast 2023-2028 ($ thousand)
- Exhibits59: Chart on APAC - Year-over-year growth 2023-2028 (%)
- Exhibits60: Data Table on APAC - Year-over-year growth 2023-2028 (%)
- Exhibits61: Chart on Europe - Market size and forecast 2023-2028 ($ thousand)
- Exhibits62: Data Table on Europe - Market size and forecast 2023-2028 ($ thousand)
- Exhibits63: Chart on Europe - Year-over-year growth 2023-2028 (%)
- Exhibits64: Data Table on Europe - Year-over-year growth 2023-2028 (%)
- Exhibits65: Chart on South America - Market size and forecast 2023-2028 ($ thousand)
- Exhibits66: Data Table on South America - Market size and forecast 2023-2028 ($ thousand)
- Exhibits67: Chart on South America - Year-over-year growth 2023-2028 (%)
- Exhibits68: Data Table on South America - Year-over-year growth 2023-2028 (%)
- Exhibits69: Chart on Middle East and Africa - Market size and forecast 2023-2028 ($ thousand)
- Exhibits70: Data Table on Middle East and Africa - Market size and forecast 2023-2028 ($ thousand)
- Exhibits71: Chart on Middle East and Africa - Year-over-year growth 2023-2028 (%)
- Exhibits72: Data Table on Middle East and Africa - Year-over-year growth 2023-2028 (%)
- Exhibits73: Chart on US - Market size and forecast 2023-2028 ($ thousand)
- Exhibits74: Data Table on US - Market size and forecast 2023-2028 ($ thousand)
- Exhibits75: Chart on US - Year-over-year growth 2023-2028 (%)
- Exhibits76: Data Table on US - Year-over-year growth 2023-2028 (%)
- Exhibits77: Chart on China - Market size and forecast 2023-2028 ($ thousand)
- Exhibits78: Data Table on China - Market size and forecast 2023-2028 ($ thousand)
- Exhibits79: Chart on China - Year-over-year growth 2023-2028 (%)
- Exhibits80: Data Table on China - Year-over-year growth 2023-2028 (%)
- Exhibits81: Chart on Japan - Market size and forecast 2023-2028 ($ thousand)
- Exhibits82: Data Table on Japan - Market size and forecast 2023-2028 ($ thousand)
- Exhibits83: Chart on Japan - Year-over-year growth 2023-2028 (%)
- Exhibits84: Data Table on Japan - Year-over-year growth 2023-2028 (%)
- Exhibits85: Chart on Canada - Market size and forecast 2023-2028 ($ thousand)
- Exhibits86: Data Table on Canada - Market size and forecast 2023-2028 ($ thousand)
- Exhibits87: Chart on Canada - Year-over-year growth 2023-2028 (%)
- Exhibits88: Data Table on Canada - Year-over-year growth 2023-2028 (%)
- Exhibits89: Chart on UK - Market size and forecast 2023-2028 ($ thousand)
- Exhibits90: Data Table on UK - Market size and forecast 2023-2028 ($ thousand)
- Exhibits91: Chart on UK - Year-over-year growth 2023-2028 (%)
- Exhibits92: Data Table on UK - Year-over-year growth 2023-2028 (%)
- Exhibits93: Market opportunity By Geographical Landscape ($ thousand)
- Exhibits94: Data Tables on Market opportunity By Geographical Landscape ($ thousand)
- Exhibits95: Impact of drivers and challenges in 2023 and 2028
- Exhibits96: Overview on criticality of inputs and factors of differentiation
- Exhibits97: Overview on factors of disruption
- Exhibits98: Impact of key risks on business
- Exhibits99: Companies covered
- Exhibits100: Matrix on companies position and classification
- Exhibits101: AbMole BioScience - Overview
- Exhibits102: AbMole BioScience - Product / Service
- Exhibits103: AbMole BioScience - Key offerings
- Exhibits104: Capot Chemical Co. Ltd. - Overview
- Exhibits105: Capot Chemical Co. Ltd. - Product / Service
- Exhibits106: Capot Chemical Co. Ltd. - Key offerings
- Exhibits107: Cayman Chemical - Overview
- Exhibits108: Cayman Chemical - Product / Service
- Exhibits109: Cayman Chemical - Key offerings
- Exhibits110: ChemScene - Overview
- Exhibits111: ChemScene - Product / Service
- Exhibits112: ChemScene - Key offerings
- Exhibits113: Danaher Corp. - Overview
- Exhibits114: Danaher Corp. - Business segments
- Exhibits115: Danaher Corp. - Key news
- Exhibits116: Danaher Corp. - Key offerings
- Exhibits117: Danaher Corp. - Segment focus
- Exhibits118: Glentham Life Sciences Ltd. - Overview
- Exhibits119: Glentham Life Sciences Ltd. - Product / Service
- Exhibits120: Glentham Life Sciences Ltd. - Key offerings
- Exhibits121: Glixx Laboratories Inc. - Overview
- Exhibits122: Glixx Laboratories Inc. - Product / Service
- Exhibits123: Glixx Laboratories Inc. - Key offerings
- Exhibits124: J and K Scientific LLC - Overview
- Exhibits125: J and K Scientific LLC - Product / Service
- Exhibits126: J and K Scientific LLC - Key offerings
- Exhibits127: Merck KGaA - Overview
- Exhibits128: Merck KGaA - Business segments
- Exhibits129: Merck KGaA - Key news
- Exhibits130: Merck KGaA - Key offerings
- Exhibits131: Merck KGaA - Segment focus
- Exhibits132: StressMarq Biosciences Inc. - Overview
- Exhibits133: StressMarq Biosciences Inc. - Product / Service
- Exhibits134: StressMarq Biosciences Inc. - Key offerings
- Exhibits135: Tokyo Chemical Industry Co. Ltd. - Overview
- Exhibits136: Tokyo Chemical Industry Co. Ltd. - Product / Service
- Exhibits137: Tokyo Chemical Industry Co. Ltd. - Key offerings
- Exhibits138: Toronto Research Chemicals Inc. - Overview
- Exhibits139: Toronto Research Chemicals Inc. - Product / Service
- Exhibits140: Toronto Research Chemicals Inc. - Key offerings
- Exhibits141: Wuhan ChemFaces Biochemical Co. Ltd. - Overview
- Exhibits142: Wuhan ChemFaces Biochemical Co. Ltd. - Product / Service
- Exhibits143: Wuhan ChemFaces Biochemical Co. Ltd. - Key offerings
- Exhibits144: Xi an Xszo Chem Co. Ltd. - Overview
- Exhibits145: Xi an Xszo Chem Co. Ltd. - Product / Service
- Exhibits146: Xi an Xszo Chem Co. Ltd. - Key offerings
- Exhibits147: Zhejiang Multinpharma Co. Ltd. - Overview
- Exhibits148: Zhejiang Multinpharma Co. Ltd. - Product / Service
- Exhibits149: Zhejiang Multinpharma Co. Ltd. - Key offerings
- Exhibits150: Inclusions checklist
- Exhibits151: Exclusions checklist
- Exhibits152: Currency conversion rates for US$
- Exhibits153: Research methodology
- Exhibits154: Information sources
- Exhibits155: Data validation
- Exhibits156: Validation techniques employed for market sizing
- Exhibits157: Data synthesis
- Exhibits158: 360 degree market analysis
- Exhibits159: List of abbreviations
The hinokitiol market is forecasted to grow by USD 13942.2 th during 2023-2028, accelerating at a CAGR of 4.36% during the forecast period. The report on the hinokitiol market provides a holistic analysis, market size and forecast, trends, growth drivers, and challenges, as well as vendor analysis covering around 25 vendors.
The report offers an up-to-date analysis regarding the current market scenario, the latest trends and drivers, and the overall market environment. The market is driven by increasing demand for personal care and cosmetics products, rising use of hinokitiol as preservative in food and beverages, and expanding applications in pharmaceutical and healthcare products.
Technavio's hinokitiol market is segmented as below:
| Market Scope | |
|---|---|
| Base Year | 2024 |
| End Year | 2028 |
| Series Year | 2024-2028 |
| Growth Momentum | Accelerate |
| YOY 2024 | 4.11% |
| CAGR | 4.36% |
| Incremental Value | $ 13942.2 th |
By Application
- Cosmetic/personal care ingredient
- Food ingredient
- Pharmaceuticals and life science
By Geographical Landscape
- North America
- APAC
- Europe
- South America
- Middle East and Africa
This study identifies the growing preference for natural and organic products as one of the prime reasons driving the hinokitiol market growth during the next few years. Also, rising awareness about antimicrobial properties of hinokitiol and rise in use of hinokitiol to treat hemorrhagic shock-induced liver injury will lead to sizable demand in the market.
The report on the hinokitiol market covers the following areas:
- Hinokitiol market sizing
- Hinokitiol market forecast
- Hinokitiol market industry analysis
The robust vendor analysis is designed to help clients improve their market position, and in line with this, this report provides a detailed analysis of several leading hinokitiol market vendors that include AbMole BioScience, Alfa Chemical Co. Ltd., Capot Chemical Co. Ltd., Cayman Chemical, ChemScene, Danaher Corp., Glentham Life Sciences Ltd., Glixx Laboratories Inc., J and K Scientific LLC, Kisei Tech Co. Ltd., Kukjeon Pharmaceutical Co. Ltd., Merck KGaA, Santa Cruz Biotechnology Inc., StressMarq Biosciences Inc., Tianjin YR Chemspec Technology Co. Ltd., Tokyo Chemical Industry Co. Ltd., Toronto Research Chemicals Inc., Wuhan ChemFaces Biochemical Co. Ltd., Xi an Xszo Chem Co. Ltd., and Zhejiang Multinpharma Co. Ltd.. Also, the hinokitiol market analysis report includes information on upcoming trends and challenges that will influence market growth. This is to help companies strategize and leverage all forthcoming growth opportunities.
The study was conducted using an objective combination of primary and secondary information including inputs from key participants in the industry. The report contains a comprehensive market and vendor landscape in addition to an analysis of the key vendors.
The publisher presents a detailed picture of the market by the way of study, synthesis, and summation of data from multiple sources by an analysis of key parameters such as profit, pricing, competition, and promotions. It presents various market facets by identifying the key industry influencers. The data presented is comprehensive, reliable, and a result of extensive research - both primary and secondary. The market research reports provide a complete competitive landscape and an in-depth vendor selection methodology and analysis using qualitative and quantitative research to forecast the accurate market growth.
Table of Contents
1 Executive Summary
- 1.1 Market overview
- Executive Summary - Chart on Market Overview
- Executive Summary - Data Table on Market Overview
- Executive Summary - Chart on Global Market Characteristics
- Executive Summary - Chart on Market By Geographical Landscape
- Executive Summary - Chart on Market Segmentation by Application
- Executive Summary - Chart on Incremental Growth
- Executive Summary - Data Table on Incremental Growth
- Executive Summary - Chart on Company Market Positioning
2 Market Landscape
- 2.1 Market ecosystem
- Parent Market
- Data Table on - Parent Market
- 2.2 Market characteristics
- Market characteristics analysis
- 2.3 Value chain analysis
- Value Chain Analysis
3 Market Sizing
- 3.1 Market definition
- Offerings of companies included in the market definition
- 3.2 Market segment analysis
- Market segments
- 3.3 Market size 2023
- 3.4 Market outlook: Forecast for 2023-2028
- Chart on Global - Market size and forecast 2023-2028 ($ thousand)
- Data Table on Global - Market size and forecast 2023-2028 ($ thousand)
- Chart on Global Market: Year-over-year growth 2023-2028 (%)
- Data Table on Global Market: Year-over-year growth 2023-2028 (%)
4 Historic Market Size
- 4.1 Global Hinokitiol Market 2018 - 2022
- Historic Market Size - Data Table on Global Hinokitiol Market 2018 - 2022 ($ thousand)
- 4.2 Application segment analysis 2018 - 2022
- Historic Market Size - Application Segment 2018 - 2022 ($ thousand)
- 4.3 Geography segment analysis 2018 - 2022
- Historic Market Size - Geography Segment 2018 - 2022 ($ thousand)
- 4.4 Country segment analysis 2018 - 2022
- Historic Market Size - Country Segment 2018 - 2022 ($ thousand)
5 Five Forces Analysis
- 5.1 Five forces summary
- Five forces analysis - Comparison between 2023 and 2028
- 5.2 Bargaining power of buyers
- Bargaining power of buyers - Impact of key factors 2023 and 2028
- 5.3 Bargaining power of suppliers
- Bargaining power of suppliers - Impact of key factors in 2023 and 2028
- 5.4 Threat of new entrants
- Threat of new entrants - Impact of key factors in 2023 and 2028
- 5.5 Threat of substitutes
- Threat of substitutes - Impact of key factors in 2023 and 2028
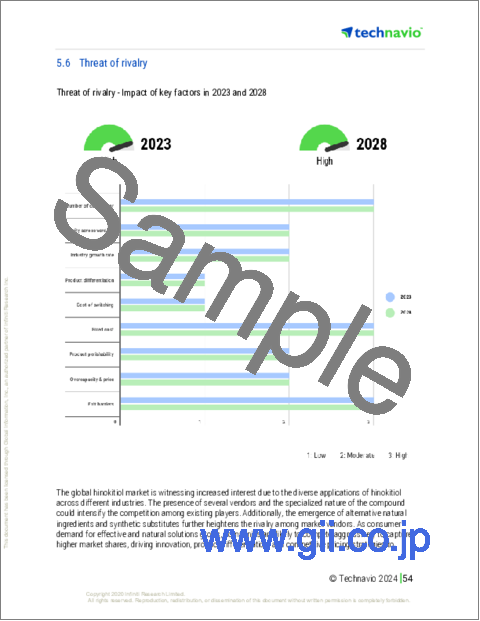
- 5.6 Threat of rivalry
- Threat of rivalry - Impact of key factors in 2023 and 2028
- 5.7 Market condition
- Chart on Market condition - Five forces 2023 and 2028
6 Market Segmentation by Application
- 6.1 Market segments
- Chart on Application - Market share 2023-2028 (%)
- Data Table on Application - Market share 2023-2028 (%)
- 6.2 Comparison by Application
- Chart on Comparison by Application
- Data Table on Comparison by Application
- 6.3 Cosmetic/personal care ingredient - Market size and forecast 2023-2028
- Chart on Cosmetic/personal care ingredient - Market size and forecast 2023-2028 ($ thousand)
- Data Table on Cosmetic/personal care ingredient - Market size and forecast 2023-2028 ($ thousand)
- Chart on Cosmetic/personal care ingredient - Year-over-year growth 2023-2028 (%)
- Data Table on Cosmetic/personal care ingredient - Year-over-year growth 2023-2028 (%)
- 6.4 Food ingredient - Market size and forecast 2023-2028
- Chart on Food ingredient - Market size and forecast 2023-2028 ($ thousand)
- Data Table on Food ingredient - Market size and forecast 2023-2028 ($ thousand)
- Chart on Food ingredient - Year-over-year growth 2023-2028 (%)
- Data Table on Food ingredient - Year-over-year growth 2023-2028 (%)
- 6.5 Pharmaceuticals and life science - Market size and forecast 2023-2028
- Chart on Pharmaceuticals and life science - Market size and forecast 2023-2028 ($ thousand)
- Data Table on Pharmaceuticals and life science - Market size and forecast 2023-2028 ($ thousand)
- Chart on Pharmaceuticals and life science - Year-over-year growth 2023-2028 (%)
- Data Table on Pharmaceuticals and life science - Year-over-year growth 2023-2028 (%)
- 6.6 Market opportunity by Application
- Market opportunity by Application ($ thousand)
- Data Table on Market opportunity by Application ($ thousand)
7 Customer Landscape
- 7.1 Customer landscape overview
- Analysis of price sensitivity, lifecycle, customer purchase basket, adoption rates, and purchase criteria
8 Geographic Landscape
- 8.1 Geographic segmentation
- Chart on Market share By Geographical Landscape 2023-2028 (%)
- Data Table on Market share By Geographical Landscape 2023-2028 (%)
- 8.2 Geographic comparison
- Chart on Geographic comparison
- Data Table on Geographic comparison
- 8.3 North America - Market size and forecast 2023-2028
- Chart on North America - Market size and forecast 2023-2028 ($ thousand)
- Data Table on North America - Market size and forecast 2023-2028 ($ thousand)
- Chart on North America - Year-over-year growth 2023-2028 (%)
- Data Table on North America - Year-over-year growth 2023-2028 (%)
- 8.4 APAC - Market size and forecast 2023-2028
- Chart on APAC - Market size and forecast 2023-2028 ($ thousand)
- Data Table on APAC - Market size and forecast 2023-2028 ($ thousand)
- Chart on APAC - Year-over-year growth 2023-2028 (%)
- Data Table on APAC - Year-over-year growth 2023-2028 (%)
- 8.5 Europe - Market size and forecast 2023-2028
- Chart on Europe - Market size and forecast 2023-2028 ($ thousand)
- Data Table on Europe - Market size and forecast 2023-2028 ($ thousand)
- Chart on Europe - Year-over-year growth 2023-2028 (%)
- Data Table on Europe - Year-over-year growth 2023-2028 (%)
- 8.6 South America - Market size and forecast 2023-2028
- Chart on South America - Market size and forecast 2023-2028 ($ thousand)
- Data Table on South America - Market size and forecast 2023-2028 ($ thousand)
- Chart on South America - Year-over-year growth 2023-2028 (%)
- Data Table on South America - Year-over-year growth 2023-2028 (%)
- 8.7 Middle East and Africa - Market size and forecast 2023-2028
- Chart on Middle East and Africa - Market size and forecast 2023-2028 ($ thousand)
- Data Table on Middle East and Africa - Market size and forecast 2023-2028 ($ thousand)
- Chart on Middle East and Africa - Year-over-year growth 2023-2028 (%)
- Data Table on Middle East and Africa - Year-over-year growth 2023-2028 (%)
- 8.8 US - Market size and forecast 2023-2028
- Chart on US - Market size and forecast 2023-2028 ($ thousand)
- Data Table on US - Market size and forecast 2023-2028 ($ thousand)
- Chart on US - Year-over-year growth 2023-2028 (%)
- Data Table on US - Year-over-year growth 2023-2028 (%)
- 8.9 China - Market size and forecast 2023-2028
- Chart on China - Market size and forecast 2023-2028 ($ thousand)
- Data Table on China - Market size and forecast 2023-2028 ($ thousand)
- Chart on China - Year-over-year growth 2023-2028 (%)
- Data Table on China - Year-over-year growth 2023-2028 (%)
- 8.10 Japan - Market size and forecast 2023-2028
- Chart on Japan - Market size and forecast 2023-2028 ($ thousand)
- Data Table on Japan - Market size and forecast 2023-2028 ($ thousand)
- Chart on Japan - Year-over-year growth 2023-2028 (%)
- Data Table on Japan - Year-over-year growth 2023-2028 (%)
- 8.11 Canada - Market size and forecast 2023-2028
- Chart on Canada - Market size and forecast 2023-2028 ($ thousand)
- Data Table on Canada - Market size and forecast 2023-2028 ($ thousand)
- Chart on Canada - Year-over-year growth 2023-2028 (%)
- Data Table on Canada - Year-over-year growth 2023-2028 (%)
- 8.12 UK - Market size and forecast 2023-2028
- Chart on UK - Market size and forecast 2023-2028 ($ thousand)
- Data Table on UK - Market size and forecast 2023-2028 ($ thousand)
- Chart on UK - Year-over-year growth 2023-2028 (%)
- Data Table on UK - Year-over-year growth 2023-2028 (%)
- 8.13 Market opportunity By Geographical Landscape
- Market opportunity By Geographical Landscape ($ thousand)
- Data Tables on Market opportunity By Geographical Landscape ($ thousand)
9 Drivers, Challenges, and Opportunity/Restraints
- 9.1 Market drivers
- 9.2 Market challenges
- 9.3 Impact of drivers and challenges
- Impact of drivers and challenges in 2023 and 2028
- 9.4 Market opportunities/restraints
10 Competitive Landscape
- 10.1 Overview
- 10.2 Competitive Landscape
- Overview on criticality of inputs and factors of differentiation
- 10.3 Landscape disruption
- Overview on factors of disruption
- 10.4 Industry risks
- Impact of key risks on business
11 Competitive Analysis
- 11.1 Companies profiled
- Companies covered
- 11.2 Market positioning of companies
- Matrix on companies position and classification
- 11.3 AbMole BioScience
- AbMole BioScience - Overview
- AbMole BioScience - Product / Service
- AbMole BioScience - Key offerings
- 11.4 Capot Chemical Co. Ltd.
- Capot Chemical Co. Ltd. - Overview
- Capot Chemical Co. Ltd. - Product / Service
- Capot Chemical Co. Ltd. - Key offerings
- 11.5 Cayman Chemical
- Cayman Chemical - Overview
- Cayman Chemical - Product / Service
- Cayman Chemical - Key offerings
- 11.6 ChemScene
- ChemScene - Overview
- ChemScene - Product / Service
- ChemScene - Key offerings
- 11.7 Danaher Corp.
- Danaher Corp. - Overview
- Danaher Corp. - Business segments
- Danaher Corp. - Key news
- Danaher Corp. - Key offerings
- Danaher Corp. - Segment focus
- 11.8 Glentham Life Sciences Ltd.
- Glentham Life Sciences Ltd. - Overview
- Glentham Life Sciences Ltd. - Product / Service
- Glentham Life Sciences Ltd. - Key offerings
- 11.9 Glixx Laboratories Inc.
- Glixx Laboratories Inc. - Overview
- Glixx Laboratories Inc. - Product / Service
- Glixx Laboratories Inc. - Key offerings
- 11.10 J and K Scientific LLC
- J and K Scientific LLC - Overview
- J and K Scientific LLC - Product / Service
- J and K Scientific LLC - Key offerings
- 11.11 Merck KGaA
- Merck KGaA - Overview
- Merck KGaA - Business segments
- Merck KGaA - Key news
- Merck KGaA - Key offerings
- Merck KGaA - Segment focus
- 11.12 StressMarq Biosciences Inc.
- StressMarq Biosciences Inc. - Overview
- StressMarq Biosciences Inc. - Product / Service
- StressMarq Biosciences Inc. - Key offerings
- 11.13 Tokyo Chemical Industry Co. Ltd.
- Tokyo Chemical Industry Co. Ltd. - Overview
- Tokyo Chemical Industry Co. Ltd. - Product / Service
- Tokyo Chemical Industry Co. Ltd. - Key offerings
- 11.14 Toronto Research Chemicals Inc.
- Toronto Research Chemicals Inc. - Overview
- Toronto Research Chemicals Inc. - Product / Service
- Toronto Research Chemicals Inc. - Key offerings
- 11.15 Wuhan ChemFaces Biochemical Co. Ltd.
- Wuhan ChemFaces Biochemical Co. Ltd. - Overview
- Wuhan ChemFaces Biochemical Co. Ltd. - Product / Service
- Wuhan ChemFaces Biochemical Co. Ltd. - Key offerings
- 11.16 Xi an Xszo Chem Co. Ltd.
- Xi an Xszo Chem Co. Ltd. - Overview
- Xi an Xszo Chem Co. Ltd. - Product / Service
- Xi an Xszo Chem Co. Ltd. - Key offerings
- 11.17 Zhejiang Multinpharma Co. Ltd.
- Zhejiang Multinpharma Co. Ltd. - Overview
- Zhejiang Multinpharma Co. Ltd. - Product / Service
- Zhejiang Multinpharma Co. Ltd. - Key offerings
12 Appendix
- 12.1 Scope of the report
- 12.2 Inclusions and exclusions checklist
- Inclusions checklist
- Exclusions checklist
- 12.3 Currency conversion rates for US$
- Currency conversion rates for US$
- 12.4 Research methodology
- Research methodology
- 12.5 Data procurement
- Information sources
- 12.6 Data validation
- Data validation
- 12.7 Validation techniques employed for market sizing
- Validation techniques employed for market sizing
- 12.8 Data synthesis
- Data synthesis
- 12.9 360 degree market analysis
- 360 degree market analysis
- 12.10 List of abbreviations
- List of abbreviations

