|
|
市場調査レポート
商品コード
1524989
グルコサミンの世界市場 2024-2028Global glucosamine market 2024-2028 |
||||||
|
|||||||
カスタマイズ可能
|
|||||||


| グルコサミンの世界市場 2024-2028 |
|
出版日: 2024年06月11日
発行: TechNavio
ページ情報: 英文 134 Pages
納期: 即納可能
|

全表示
- 概要
- 図表
- 目次
グルコサミン市場は2023-2028年に3億3,840万米ドル、予測期間中のCAGRは7.05%で成長すると予測されます。
当レポートでは、グルコサミン市場の全体的な分析、市場規模・予測、動向、成長促進要因、課題、約25のベンダーを網羅したベンダー分析などを掲載しています。
現在の市場シナリオ、最新動向と促進要因、市場環境全体に関する最新分析を提供しています。市場は、健康的な食習慣の採用の増加、菜食主義者の増加、関節と骨の健康に関する消費者の意識が牽引しています。
| 市場範囲 | |
|---|---|
| 基準年 | 2024 |
| 終了年 | 2028 |
| 予測期間 | 2024-2028 |
| 成長モメンタム | 加速 |
| 前年比2024年 | 5.66% |
| CAGR | 7.05% |
| 増分額 | 3億3,840万米ドル |
本調査では、高齢者人口の増加が今後数年間のグルコサミン市場成長を牽引する主要因の1つであるとしています。また、R&Dへの投資の増加や急成長するヘルスケア産業は、市場の大きな需要につながります。
目次
第1章 エグゼクティブサマリー
- 市場概要
第2章 市場情勢
- 市場エコシステム
- 市場の特徴
- バリューチェーン分析
第3章 市場規模の評価
- 市場の定義
- 市場セグメント分析
- 市場規模 2023
- 市場の見通し 2023-2028
第4章 市場規模実績
- 世界グルコサミン市場 2018-2022
- 用途別セグメント分析 2018-2022
- 地域別セグメント分析 2018-2022
- 国別セグメント分析 2018-2022
第5章 ファイブフォース分析
- ファイブフォースの要約
- 買い手の交渉力
- 供給企業の交渉力
- 新規参入業者の脅威
- 代替品の脅威
- 競争の脅威
- 市況
第6章 市場セグメンテーション:用途別
- 市場セグメンテーション
- 比較:用途別
- 栄養補助食品:市場規模と予測 2023-2028
- 飲食品:市場規模と予測 2023-2028
- 乳製品:市場規模と予測 2023-2028
- 市場機会:用途別
第7章 顧客情勢
- 顧客情勢の概要
第8章 地域別情勢
- 地域別セグメンテーション
- 地域別比較
- 北米:市場規模と予測 2023-2028
- 欧州:市場規模と予測 2023-2028
- アジア太平洋:市場規模と予測 2023-2028
- 南米:市場規模と予測 2023-2028
- 中東・アフリカ:市場規模と予測 2023-2028
- 米国:市場規模と予測 2023-2028
- 中国:市場規模と予測 2023-2028
- ドイツ:市場規模と予測 2023-2028
- 英国:市場規模と予測 2023-2028
- カナダ:市場規模と予測 2023-2028
- 市場機会:地域情勢別
第9章 促進要因・課題・機会・抑制要因
- 市場促進要因
- 市場の課題
- 促進要因と課題の影響
- 市場の機会・抑制要因
第10章 競合情勢
- 概要
- 競合情勢
- 混乱の状況
- 業界のリスク
第11章 競合分析
- 企業プロファイル
- 企業の市場ポジショニング
- Cargill Inc.
- Cellmark AB
- Ethical Naturals Inc.
- GoldenShell Pharmaceutical
- KOYO CHEMICAL CO., LTD.
- Panvo Organics Pvt. Ltd.
- Reckitt Benckiser Group Plc
- TSI Group Ltd.
- Viatris Inc.
- Wellable Marine Biotech Holding Ltd
第12章 付録
Exhibits:
- Exhibits1: Executive Summary - Chart on Market Overview
- Exhibits2: Executive Summary - Data Table on Market Overview
- Exhibits3: Executive Summary - Chart on Global Market Characteristics
- Exhibits4: Executive Summary - Chart on Market By Geographical Landscape
- Exhibits5: Executive Summary - Chart on Market Segmentation by Application
- Exhibits6: Executive Summary - Chart on Incremental Growth
- Exhibits7: Executive Summary - Data Table on Incremental Growth
- Exhibits8: Executive Summary - Chart on Company Market Positioning
- Exhibits9: Parent Market
- Exhibits10: Data Table on - Parent Market
- Exhibits11: Market characteristics analysis
- Exhibits12: Value Chain Analysis
- Exhibits13: Offerings of companies included in the market definition
- Exhibits14: Market segments
- Exhibits15: Chart on Global - Market size and forecast 2023-2028 ($ million)
- Exhibits16: Data Table on Global - Market size and forecast 2023-2028 ($ million)
- Exhibits17: Chart on Global Market: Year-over-year growth 2023-2028 (%)
- Exhibits18: Data Table on Global Market: Year-over-year growth 2023-2028 (%)
- Exhibits19: Historic Market Size - Data Table on Global Glucosamine Market 2018 - 2022 ($ million)
- Exhibits20: Historic Market Size - Application Segment 2018 - 2022 ($ million)
- Exhibits21: Historic Market Size - Geography Segment 2018 - 2022 ($ million)
- Exhibits22: Historic Market Size - Country Segment 2018 - 2022 ($ million)
- Exhibits23: Five forces analysis - Comparison between 2023 and 2028
- Exhibits24: Bargaining power of buyers - Impact of key factors 2023 and 2028
- Exhibits25: Bargaining power of suppliers - Impact of key factors in 2023 and 2028
- Exhibits26: Threat of new entrants - Impact of key factors in 2023 and 2028
- Exhibits27: Threat of substitutes - Impact of key factors in 2023 and 2028
- Exhibits28: Threat of rivalry - Impact of key factors in 2023 and 2028
- Exhibits29: Chart on Market condition - Five forces 2023 and 2028
- Exhibits30: Chart on Application - Market share 2023-2028 (%)
- Exhibits31: Data Table on Application - Market share 2023-2028 (%)
- Exhibits32: Chart on Comparison by Application
- Exhibits33: Data Table on Comparison by Application
- Exhibits34: Chart on Nutritional supplements - Market size and forecast 2023-2028 ($ million)
- Exhibits35: Data Table on Nutritional supplements - Market size and forecast 2023-2028 ($ million)
- Exhibits36: Chart on Nutritional supplements - Year-over-year growth 2023-2028 (%)
- Exhibits37: Data Table on Nutritional supplements - Year-over-year growth 2023-2028 (%)
- Exhibits38: Chart on Food and beverages - Market size and forecast 2023-2028 ($ million)
- Exhibits39: Data Table on Food and beverages - Market size and forecast 2023-2028 ($ million)
- Exhibits40: Chart on Food and beverages - Year-over-year growth 2023-2028 (%)
- Exhibits41: Data Table on Food and beverages - Year-over-year growth 2023-2028 (%)
- Exhibits42: Chart on Dairy products - Market size and forecast 2023-2028 ($ million)
- Exhibits43: Data Table on Dairy products - Market size and forecast 2023-2028 ($ million)
- Exhibits44: Chart on Dairy products - Year-over-year growth 2023-2028 (%)
- Exhibits45: Data Table on Dairy products - Year-over-year growth 2023-2028 (%)
- Exhibits46: Market opportunity by Application ($ million)
- Exhibits47: Data Table on Market opportunity by Application ($ million)
- Exhibits48: Analysis of price sensitivity, lifecycle, customer purchase basket, adoption rates, and purchase criteria
- Exhibits49: Chart on Market share By Geographical Landscape 2023-2028 (%)
- Exhibits50: Data Table on Market share By Geographical Landscape 2023-2028 (%)
- Exhibits51: Chart on Geographic comparison
- Exhibits52: Data Table on Geographic comparison
- Exhibits53: Chart on North America - Market size and forecast 2023-2028 ($ million)
- Exhibits54: Data Table on North America - Market size and forecast 2023-2028 ($ million)
- Exhibits55: Chart on North America - Year-over-year growth 2023-2028 (%)
- Exhibits56: Data Table on North America - Year-over-year growth 2023-2028 (%)
- Exhibits57: Chart on Europe - Market size and forecast 2023-2028 ($ million)
- Exhibits58: Data Table on Europe - Market size and forecast 2023-2028 ($ million)
- Exhibits59: Chart on Europe - Year-over-year growth 2023-2028 (%)
- Exhibits60: Data Table on Europe - Year-over-year growth 2023-2028 (%)
- Exhibits61: Chart on APAC - Market size and forecast 2023-2028 ($ million)
- Exhibits62: Data Table on APAC - Market size and forecast 2023-2028 ($ million)
- Exhibits63: Chart on APAC - Year-over-year growth 2023-2028 (%)
- Exhibits64: Data Table on APAC - Year-over-year growth 2023-2028 (%)
- Exhibits65: Chart on South America - Market size and forecast 2023-2028 ($ million)
- Exhibits66: Data Table on South America - Market size and forecast 2023-2028 ($ million)
- Exhibits67: Chart on South America - Year-over-year growth 2023-2028 (%)
- Exhibits68: Data Table on South America - Year-over-year growth 2023-2028 (%)
- Exhibits69: Chart on Middle East and Africa - Market size and forecast 2023-2028 ($ million)
- Exhibits70: Data Table on Middle East and Africa - Market size and forecast 2023-2028 ($ million)
- Exhibits71: Chart on Middle East and Africa - Year-over-year growth 2023-2028 (%)
- Exhibits72: Data Table on Middle East and Africa - Year-over-year growth 2023-2028 (%)
- Exhibits73: Chart on US - Market size and forecast 2023-2028 ($ million)
- Exhibits74: Data Table on US - Market size and forecast 2023-2028 ($ million)
- Exhibits75: Chart on US - Year-over-year growth 2023-2028 (%)
- Exhibits76: Data Table on US - Year-over-year growth 2023-2028 (%)
- Exhibits77: Chart on China - Market size and forecast 2023-2028 ($ million)
- Exhibits78: Data Table on China - Market size and forecast 2023-2028 ($ million)
- Exhibits79: Chart on China - Year-over-year growth 2023-2028 (%)
- Exhibits80: Data Table on China - Year-over-year growth 2023-2028 (%)
- Exhibits81: Chart on Germany - Market size and forecast 2023-2028 ($ million)
- Exhibits82: Data Table on Germany - Market size and forecast 2023-2028 ($ million)
- Exhibits83: Chart on Germany - Year-over-year growth 2023-2028 (%)
- Exhibits84: Data Table on Germany - Year-over-year growth 2023-2028 (%)
- Exhibits85: Chart on UK - Market size and forecast 2023-2028 ($ million)
- Exhibits86: Data Table on UK - Market size and forecast 2023-2028 ($ million)
- Exhibits87: Chart on UK - Year-over-year growth 2023-2028 (%)
- Exhibits88: Data Table on UK - Year-over-year growth 2023-2028 (%)
- Exhibits89: Chart on Canada - Market size and forecast 2023-2028 ($ million)
- Exhibits90: Data Table on Canada - Market size and forecast 2023-2028 ($ million)
- Exhibits91: Chart on Canada - Year-over-year growth 2023-2028 (%)
- Exhibits92: Data Table on Canada - Year-over-year growth 2023-2028 (%)
- Exhibits93: Market opportunity By Geographical Landscape ($ million)
- Exhibits94: Data Tables on Market opportunity By Geographical Landscape ($ million)
- Exhibits95: Impact of drivers and challenges in 2023 and 2028
- Exhibits96: Overview on criticality of inputs and factors of differentiation
- Exhibits97: Overview on factors of disruption
- Exhibits98: Impact of key risks on business
- Exhibits99: Companies covered
- Exhibits100: Matrix on companies position and classification
- Exhibits101: Cargill Inc. - Overview
- Exhibits102: Cargill Inc. - Product / Service
- Exhibits103: Cargill Inc. - Key news
- Exhibits104: Cargill Inc. - Key offerings
- Exhibits105: Cellmark AB - Overview
- Exhibits106: Cellmark AB - Product / Service
- Exhibits107: Cellmark AB - Key offerings
- Exhibits108: Ethical Naturals Inc. - Overview
- Exhibits109: Ethical Naturals Inc. - Product / Service
- Exhibits110: Ethical Naturals Inc. - Key offerings
- Exhibits111: GoldenShell Pharmaceutical - Overview
- Exhibits112: GoldenShell Pharmaceutical - Product / Service
- Exhibits113: GoldenShell Pharmaceutical - Key offerings
- Exhibits114: KOYO CHEMICAL CO., LTD. - Overview
- Exhibits115: KOYO CHEMICAL CO., LTD. - Product / Service
- Exhibits116: KOYO CHEMICAL CO., LTD. - Key offerings
- Exhibits117: Panvo Organics Pvt. Ltd. - Overview
- Exhibits118: Panvo Organics Pvt. Ltd. - Product / Service
- Exhibits119: Panvo Organics Pvt. Ltd. - Key offerings
- Exhibits120: Reckitt Benckiser Group Plc - Overview
- Exhibits121: Reckitt Benckiser Group Plc - Business segments
- Exhibits122: Reckitt Benckiser Group Plc - Key news
- Exhibits123: Reckitt Benckiser Group Plc - Key offerings
- Exhibits124: Reckitt Benckiser Group Plc - Segment focus
- Exhibits125: TSI Group Ltd. - Overview
- Exhibits126: TSI Group Ltd. - Product / Service
- Exhibits127: TSI Group Ltd. - Key offerings
- Exhibits128: Viatris Inc. - Overview
- Exhibits129: Viatris Inc. - Business segments
- Exhibits130: Viatris Inc. - Key news
- Exhibits131: Viatris Inc. - Key offerings
- Exhibits132: Viatris Inc. - Segment focus
- Exhibits133: Wellable Marine Biotech Holding Ltd - Overview
- Exhibits134: Wellable Marine Biotech Holding Ltd - Product / Service
- Exhibits135: Wellable Marine Biotech Holding Ltd - Key offerings
- Exhibits136: Inclusions checklist
- Exhibits137: Exclusions checklist
- Exhibits138: Currency conversion rates for US$
- Exhibits139: Research methodology
- Exhibits140: Information sources
- Exhibits141: Data validation
- Exhibits142: Validation techniques employed for market sizing
- Exhibits143: Data synthesis
- Exhibits144: 360 degree market analysis
- Exhibits145: List of abbreviations
The glucosamine market is forecasted to grow by USD 338.4 mn during 2023-2028, accelerating at a CAGR of 7.05% during the forecast period. The report on the glucosamine market provides a holistic analysis, market size and forecast, trends, growth drivers, and challenges, as well as vendor analysis covering around 25 vendors.
The report offers an up-to-date analysis regarding the current market scenario, the latest trends and drivers, and the overall market environment. The market is driven by increasing adoption of healthy eating habits, increasing number of vegan consumers, and consumer awareness regarding joint and bone health.
Technavio's glucosamine market is segmented as below:
| Market Scope | |
|---|---|
| Base Year | 2024 |
| End Year | 2028 |
| Series Year | 2024-2028 |
| Growth Momentum | Accelerate |
| YOY 2024 | 5.66% |
| CAGR | 7.05% |
| Incremental Value | $338.4mn |
By Application
- Nutritional supplements
- Food and beverages
- Dairy products
By Geographical Landscape
- North America
- Europe
- APAC
- South America
- Middle East and Africa
This study identifies the increase in elderly population as one of the prime reasons driving the glucosamine market growth during the next few years. Also, increasing investments in R and D and rapidly growing healthcare industry will lead to sizable demand in the market.
The report on the glucosamine market covers the following areas:
- Glucosamine market sizing
- Glucosamine market forecast
- Glucosamine market industry analysis
The robust vendor analysis is designed to help clients improve their market position, and in line with this, this report provides a detailed analysis of several leading glucosamine market vendors that include Cargill Inc., Cellmark AB, Ethical Naturals Inc., Foodchem International Corp., GoldenShell Pharmaceutical, Jiaxing Hengjie Biopharmaceutical Co., Ltd., KOYO CHEMICAL CO., LTD., NOW Health Group Inc., NutraLife, Panvo Organics Pvt. Ltd., Reckitt Benckiser Group PLC, STELLAR BIOSOL, TSI Group Ltd., Viatris Inc., Wellable Marine Biotech Holding Ltd, Yang Zhou Rixing Biotech Co Ltd, Yantai Dongcheng Pharmaceutical Group Co. Ltd, Zhejiang Aoxing Biotechnology Co. LTD., Zhejiang Kangduoli Pharmaceutical Co. Ltd, and Zhejiang Chengyi Pharmaceutical Co., Ltd. Also, the glucosamine market analysis report includes information on upcoming trends and challenges that will influence market growth. This is to help companies strategize and leverage all forthcoming growth opportunities.
The study was conducted using an objective combination of primary and secondary information including inputs from key participants in the industry. The report contains a comprehensive market and vendor landscape in addition to an analysis of the key vendors.
The publisher presents a detailed picture of the market by the way of study, synthesis, and summation of data from multiple sources by an analysis of key parameters such as profit, pricing, competition, and promotions. It presents various market facets by identifying the key industry influencers. The data presented is comprehensive, reliable, and a result of extensive research - both primary and secondary. The market research reports provide a complete competitive landscape and an in-depth vendor selection methodology and analysis using qualitative and quantitative research to forecast the accurate market growth.
Table of Contents
1 Executive Summary
- 1.1 Market overview
- Executive Summary - Chart on Market Overview
- Executive Summary - Data Table on Market Overview
- Executive Summary - Chart on Global Market Characteristics
- Executive Summary - Chart on Market By Geographical Landscape
- Executive Summary - Chart on Market Segmentation by Application
- Executive Summary - Chart on Incremental Growth
- Executive Summary - Data Table on Incremental Growth
- Executive Summary - Chart on Company Market Positioning
2 Market Landscape
- 2.1 Market ecosystem
- Parent Market
- Data Table on - Parent Market
- 2.2 Market characteristics
- Market characteristics analysis
- 2.3 Value chain analysis
- Value Chain Analysis
3 Market Sizing
- 3.1 Market definition
- Offerings of companies included in the market definition
- 3.2 Market segment analysis
- Market segments
- 3.3 Market size 2023
- 3.4 Market outlook: Forecast for 2023-2028
- Chart on Global - Market size and forecast 2023-2028 ($ million)
- Data Table on Global - Market size and forecast 2023-2028 ($ million)
- Chart on Global Market: Year-over-year growth 2023-2028 (%)
- Data Table on Global Market: Year-over-year growth 2023-2028 (%)
4 Historic Market Size
- 4.1 Global Glucosamine Market 2018 - 2022
- Historic Market Size - Data Table on Global Glucosamine Market 2018 - 2022 ($ million)
- 4.2 Application segment analysis 2018 - 2022
- Historic Market Size - Application Segment 2018 - 2022 ($ million)
- 4.3 Geography segment analysis 2018 - 2022
- Historic Market Size - Geography Segment 2018 - 2022 ($ million)
- 4.4 Country segment analysis 2018 - 2022
- Historic Market Size - Country Segment 2018 - 2022 ($ million)
5 Five Forces Analysis
- 5.1 Five forces summary
- Five forces analysis - Comparison between 2023 and 2028
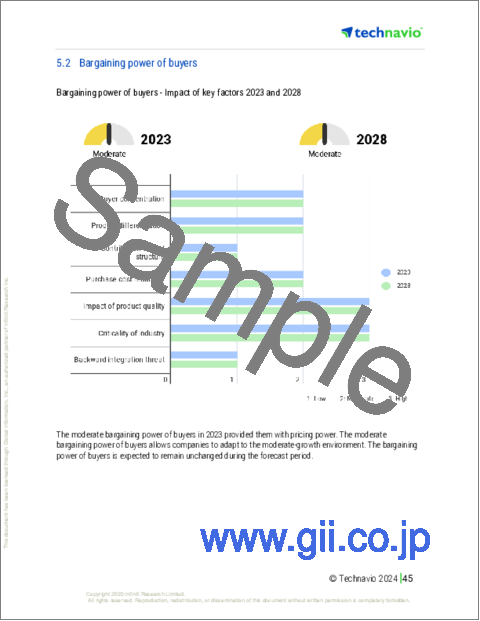
- 5.2 Bargaining power of buyers
- Bargaining power of buyers - Impact of key factors 2023 and 2028
- 5.3 Bargaining power of suppliers
- Bargaining power of suppliers - Impact of key factors in 2023 and 2028
- 5.4 Threat of new entrants
- Threat of new entrants - Impact of key factors in 2023 and 2028
- 5.5 Threat of substitutes
- Threat of substitutes - Impact of key factors in 2023 and 2028
- 5.6 Threat of rivalry
- Threat of rivalry - Impact of key factors in 2023 and 2028
- 5.7 Market condition
- Chart on Market condition - Five forces 2023 and 2028
6 Market Segmentation by Application
- 6.1 Market segments
- Chart on Application - Market share 2023-2028 (%)
- Data Table on Application - Market share 2023-2028 (%)
- 6.2 Comparison by Application
- Chart on Comparison by Application
- Data Table on Comparison by Application
- 6.3 Nutritional supplements - Market size and forecast 2023-2028
- Chart on Nutritional supplements - Market size and forecast 2023-2028 ($ million)
- Data Table on Nutritional supplements - Market size and forecast 2023-2028 ($ million)
- Chart on Nutritional supplements - Year-over-year growth 2023-2028 (%)
- Data Table on Nutritional supplements - Year-over-year growth 2023-2028 (%)
- 6.4 Food and beverages - Market size and forecast 2023-2028
- Chart on Food and beverages - Market size and forecast 2023-2028 ($ million)
- Data Table on Food and beverages - Market size and forecast 2023-2028 ($ million)
- Chart on Food and beverages - Year-over-year growth 2023-2028 (%)
- Data Table on Food and beverages - Year-over-year growth 2023-2028 (%)
- 6.5 Dairy products - Market size and forecast 2023-2028
- Chart on Dairy products - Market size and forecast 2023-2028 ($ million)
- Data Table on Dairy products - Market size and forecast 2023-2028 ($ million)
- Chart on Dairy products - Year-over-year growth 2023-2028 (%)
- Data Table on Dairy products - Year-over-year growth 2023-2028 (%)
- 6.6 Market opportunity by Application
- Market opportunity by Application ($ million)
- Data Table on Market opportunity by Application ($ million)
7 Customer Landscape
- 7.1 Customer landscape overview
- Analysis of price sensitivity, lifecycle, customer purchase basket, adoption rates, and purchase criteria
8 Geographic Landscape
- 8.1 Geographic segmentation
- Chart on Market share By Geographical Landscape 2023-2028 (%)
- Data Table on Market share By Geographical Landscape 2023-2028 (%)
- 8.2 Geographic comparison
- Chart on Geographic comparison
- Data Table on Geographic comparison
- 8.3 North America - Market size and forecast 2023-2028
- Chart on North America - Market size and forecast 2023-2028 ($ million)
- Data Table on North America - Market size and forecast 2023-2028 ($ million)
- Chart on North America - Year-over-year growth 2023-2028 (%)
- Data Table on North America - Year-over-year growth 2023-2028 (%)
- 8.4 Europe - Market size and forecast 2023-2028
- Chart on Europe - Market size and forecast 2023-2028 ($ million)
- Data Table on Europe - Market size and forecast 2023-2028 ($ million)
- Chart on Europe - Year-over-year growth 2023-2028 (%)
- Data Table on Europe - Year-over-year growth 2023-2028 (%)
- 8.5 APAC - Market size and forecast 2023-2028
- Chart on APAC - Market size and forecast 2023-2028 ($ million)
- Data Table on APAC - Market size and forecast 2023-2028 ($ million)
- Chart on APAC - Year-over-year growth 2023-2028 (%)
- Data Table on APAC - Year-over-year growth 2023-2028 (%)
- 8.6 South America - Market size and forecast 2023-2028
- Chart on South America - Market size and forecast 2023-2028 ($ million)
- Data Table on South America - Market size and forecast 2023-2028 ($ million)
- Chart on South America - Year-over-year growth 2023-2028 (%)
- Data Table on South America - Year-over-year growth 2023-2028 (%)
- 8.7 Middle East and Africa - Market size and forecast 2023-2028
- Chart on Middle East and Africa - Market size and forecast 2023-2028 ($ million)
- Data Table on Middle East and Africa - Market size and forecast 2023-2028 ($ million)
- Chart on Middle East and Africa - Year-over-year growth 2023-2028 (%)
- Data Table on Middle East and Africa - Year-over-year growth 2023-2028 (%)
- 8.8 US - Market size and forecast 2023-2028
- Chart on US - Market size and forecast 2023-2028 ($ million)
- Data Table on US - Market size and forecast 2023-2028 ($ million)
- Chart on US - Year-over-year growth 2023-2028 (%)
- Data Table on US - Year-over-year growth 2023-2028 (%)
- 8.9 China - Market size and forecast 2023-2028
- Chart on China - Market size and forecast 2023-2028 ($ million)
- Data Table on China - Market size and forecast 2023-2028 ($ million)
- Chart on China - Year-over-year growth 2023-2028 (%)
- Data Table on China - Year-over-year growth 2023-2028 (%)
- 8.10 Germany - Market size and forecast 2023-2028
- Chart on Germany - Market size and forecast 2023-2028 ($ million)
- Data Table on Germany - Market size and forecast 2023-2028 ($ million)
- Chart on Germany - Year-over-year growth 2023-2028 (%)
- Data Table on Germany - Year-over-year growth 2023-2028 (%)
- 8.11 UK - Market size and forecast 2023-2028
- Chart on UK - Market size and forecast 2023-2028 ($ million)
- Data Table on UK - Market size and forecast 2023-2028 ($ million)
- Chart on UK - Year-over-year growth 2023-2028 (%)
- Data Table on UK - Year-over-year growth 2023-2028 (%)
- 8.12 Canada - Market size and forecast 2023-2028
- Chart on Canada - Market size and forecast 2023-2028 ($ million)
- Data Table on Canada - Market size and forecast 2023-2028 ($ million)
- Chart on Canada - Year-over-year growth 2023-2028 (%)
- Data Table on Canada - Year-over-year growth 2023-2028 (%)
- 8.13 Market opportunity By Geographical Landscape
- Market opportunity By Geographical Landscape ($ million)
- Data Tables on Market opportunity By Geographical Landscape ($ million)
9 Drivers, Challenges, and Opportunity/Restraints
- 9.1 Market drivers
- 9.2 Market challenges
- 9.3 Impact of drivers and challenges
- Impact of drivers and challenges in 2023 and 2028
- 9.4 Market opportunities/restraints
10 Competitive Landscape
- 10.1 Overview
- 10.2 Competitive Landscape
- Overview on criticality of inputs and factors of differentiation
- 10.3 Landscape disruption
- Overview on factors of disruption
- 10.4 Industry risks
- Impact of key risks on business
11 Competitive Analysis
- 11.1 Companies profiled
- Companies covered
- 11.2 Market positioning of companies
- Matrix on companies position and classification
- 11.3 Cargill Inc.
- Cargill Inc. - Overview
- Cargill Inc. - Product / Service
- Cargill Inc. - Key news
- Cargill Inc. - Key offerings
- 11.4 Cellmark AB
- Cellmark AB - Overview
- Cellmark AB - Product / Service
- Cellmark AB - Key offerings
- 11.5 Ethical Naturals Inc.
- Ethical Naturals Inc. - Overview
- Ethical Naturals Inc. - Product / Service
- Ethical Naturals Inc. - Key offerings
- 11.6 GoldenShell Pharmaceutical
- GoldenShell Pharmaceutical - Overview
- GoldenShell Pharmaceutical - Product / Service
- GoldenShell Pharmaceutical - Key offerings
- 11.7 KOYO CHEMICAL CO., LTD.
- KOYO CHEMICAL CO., LTD. - Overview
- KOYO CHEMICAL CO., LTD. - Product / Service
- KOYO CHEMICAL CO., LTD. - Key offerings
- 11.8 Panvo Organics Pvt. Ltd.
- Panvo Organics Pvt. Ltd. - Overview
- Panvo Organics Pvt. Ltd. - Product / Service
- Panvo Organics Pvt. Ltd. - Key offerings
- 11.9 Reckitt Benckiser Group Plc
- Reckitt Benckiser Group Plc - Overview
- Reckitt Benckiser Group Plc - Business segments
- Reckitt Benckiser Group Plc - Key news
- Reckitt Benckiser Group Plc - Key offerings
- Reckitt Benckiser Group Plc - Segment focus
- 11.10 TSI Group Ltd.
- TSI Group Ltd. - Overview
- TSI Group Ltd. - Product / Service
- TSI Group Ltd. - Key offerings
- 11.11 Viatris Inc.
- Viatris Inc. - Overview
- Viatris Inc. - Business segments
- Viatris Inc. - Key news
- Viatris Inc. - Key offerings
- Viatris Inc. - Segment focus
- 11.12 Wellable Marine Biotech Holding Ltd
- Wellable Marine Biotech Holding Ltd - Overview
- Wellable Marine Biotech Holding Ltd - Product / Service
- Wellable Marine Biotech Holding Ltd - Key offerings
12 Appendix
- 12.1 Scope of the report
- 12.2 Inclusions and exclusions checklist
- Inclusions checklist
- Exclusions checklist
- 12.3 Currency conversion rates for US$
- Currency conversion rates for US$
- 12.4 Research methodology
- Research methodology
- 12.5 Data procurement
- Information sources
- 12.6 Data validation
- Data validation
- 12.7 Validation techniques employed for market sizing
- Validation techniques employed for market sizing
- 12.8 Data synthesis
- Data synthesis
- 12.9 360 degree market analysis
- 360 degree market analysis
- 12.10 List of abbreviations
- List of abbreviations
