|
|
市場調査レポート
商品コード
1762894
精密農業の世界市場 2025-2029Global Precision Agriculture Market 2025-2029 |
||||||
|
|||||||
カスタマイズ可能
|
|||||||

| 精密農業の世界市場 2025-2029 |
|
出版日: 2025年06月28日
発行: TechNavio
ページ情報: 英文 237 Pages
納期: 即納可能
|

全表示
- 概要
- 図表
- 目次
精密農業市場は2024-2029年に80億1,850万米ドル、予測期間中のCAGRは15.4%で成長すると予測されます。
当レポートでは、精密農業市場の全体的な分析、市場規模・予測、動向、成長促進要因、課題、約25のベンダーを網羅したベンダー分析などを掲載しています。
現在の市場シナリオ、最新動向と促進要因、市場環境全体に関する最新分析を提供しています。市場は、農業技術への投資の増加、農業生産高の増加への注力、農業農場のデータ管理ニーズの高まりによって牽引されています。
| 市場範囲 | |
|---|---|
| 基準年 | 2025 |
| 終了年 | 2029 |
| 予測期間 | 2025-2029 |
| 成長モメンタム | 加速 |
| 前年比 | 13% |
| CAGR | 15.4% |
| 増分額 | 80億1,850万米ドル |
本調査は、業界の主要参加者からのインプットを含め、一次情報と二次情報を客観的に組み合わせて実施しました。レポートには、主要企業の分析に加え、包括的な市場規模データ、地域別分析によるセグメント、ベンダー情勢が含まれています。レポートには過去データと予測データがあります。
本調査では、今後数年間の精密農業市場の成長を促進する主な要因の1つとして、精密農業の技術的進歩を挙げています。また、戦略的提携の増加や、精密農業におけるビッグデータ分析の影響力の高まりは、市場の大きな需要につながるでしょう。
目次
第1章 エグゼクティブサマリー
- 市場概要
第2章 Technavio分析
- 価格・ライフサイクル・顧客購入バスケット・採用率・購入基準の分析
- インプットの重要性と差別化の要因
- 混乱の要因
- 促進要因と課題の影響
第3章 市場情勢
- 市場エコシステム
- 市場の特徴
- バリューチェーン分析
第4章 市場規模
- 市場の定義
- 市場セグメント分析
- 市場規模 2024
- 市場の見通し 2024-2029
第5章 市場規模実績
- 精密農業の世界市場 2019-2023
- 製品セグメント分析 2019-2023
- 用途別セグメント分析 2019-2023
- 技術セグメント分析 2019-2023
- 地域別セグメント分析 2019-2023
- 国別セグメント分析 2019-2023
第6章 定性分析
- AIの影響:精密農業の世界市場
第7章 ファイブフォース分析
- ファイブフォースの要約
- 買い手の交渉力
- 供給企業の交渉力
- 新規参入業者の脅威
- 代替品の脅威
- 競争の脅威
- 市況
第8章 市場セグメンテーション:製品別
- 市場セグメント
- 比較:製品別
- ハードウェア:市場規模と予測 2024-2029
- ソフトウェアとサービス:市場規模と予測 2024-2029
- 市場機会:製品別
第9章 市場セグメンテーション:用途別
- 市場セグメント
- 比較:用途別
- 収量監視:市場規模と予測 2024-2029
- フィールドマッピング:市場規模と予測 2024-2029
- 精密灌漑:市場規模と予測 2024-2029
- 作物スカウティング:市場規模と予測 2024-2029
- その他:市場規模と予測 2024-2029
- 市場機会:用途別
第10章 市場セグメンテーション:技術別
- 市場セグメント
- 比較:技術別
- モノのインターネット(IoT):市場規模と予測 2024-2029
- 人工知能(AI):市場規模と予測 2024-2029
- ビッグデータと分析:市場規模と予測 2024-2029
- リモートセンシング:市場規模と予測 2024-2029
- ロボット工学と自動化:市場規模と予測 2024-2029
- 市場機会:技術別
第11章 顧客情勢
- 顧客情勢の概要
第12章 地域別情勢
- 地域別セグメンテーション
- 地域別比較
- 北米:市場規模と予測 2024-2029
- 欧州:市場規模と予測 2024-2029
- アジア太平洋:市場規模と予測 2024-2029
- 南米:市場規模と予測 2024-2029
- 中東・アフリカ:市場規模と予測 2024-2029
- 米国:市場規模と予測 2024-2029
- 中国:市場規模と予測 2024-2029
- ドイツ:市場規模と予測 2024-2029
- 英国:市場規模と予測 2024-2029
- カナダ:市場規模と予測 2024-2029
- フランス:市場規模と予測 2024-2029
- オーストラリア:市場規模と予測 2024-2029
- インド:市場規模と予測 2024-2029
- イタリア:市場規模と予測 2024-2029
- スペイン:市場規模と予測 2024-2029
- 市場機会:地域情勢別
第13章 促進要因・課題・機会・抑制要因
- 市場促進要因
- 市場の課題
- 促進要因と課題の影響
- 市場の機会・抑制要因
第14章 競合情勢
- 概要
- 競合情勢
- 混乱の状況
- 業界のリスク
第15章 競合分析
- 企業プロファイル
- 企業ランキング指数
- 企業の市場ポジショニング
- AAA Taranis Visual Ltd.
- Abaco Spa
- Ag Leader Technology
- AGCO Corp.
- Agribotix
- Carl Zeiss AG
- CNH Industrial NV
- CropX Technologies Ltd.
- Deere and Co.
- DICKEY john
- Kubota Corp.
- TeeJet Technologies
- The Toro Co.
- Trimble Inc.
- Yara International ASA
第16章 付録
Exhibits:
- Exhibits1: Executive Summary - Chart on Market Overview
- Exhibits2: Executive Summary - Data Table on Market Overview
- Exhibits3: Executive Summary - Chart on Global Market Characteristics
- Exhibits4: Executive Summary - Chart on Market By Geographical Landscape
- Exhibits5: Executive Summary - Chart on Market Segmentation by Product
- Exhibits6: Executive Summary - Chart on Market Segmentation by Application
- Exhibits7: Executive Summary - Chart on Market Segmentation by Technology
- Exhibits8: Executive Summary - Chart on Incremental Growth
- Exhibits9: Executive Summary - Data Table on Incremental Growth
- Exhibits10: Executive Summary - Chart on Company Market Positioning
- Exhibits11: Analysis of price sensitivity, lifecycle, customer purchase basket, adoption rates, and purchase criteria
- Exhibits12: Overview on criticality of inputs and factors of differentiation
- Exhibits13: Overview on factors of disruption
- Exhibits14: Impact of drivers and challenges in 2024 and 2029
- Exhibits15: Parent Market
- Exhibits16: Data Table on - Parent Market
- Exhibits17: Market characteristics analysis
- Exhibits18: Value chain analysis
- Exhibits19: Offerings of companies included in the market definition
- Exhibits20: Market segments
- Exhibits21: Chart on Global - Market size and forecast 2024-2029 ($ million)
- Exhibits22: Data Table on Global - Market size and forecast 2024-2029 ($ million)
- Exhibits23: Chart on Global Market: Year-over-year growth 2024-2029 (%)
- Exhibits24: Data Table on Global Market: Year-over-year growth 2024-2029 (%)
- Exhibits25: Historic Market Size - Data Table on Global Precision Agriculture Market 2019 - 2023 ($ million)
- Exhibits26: Historic Market Size - Product Segment 2019 - 2023 ($ million)
- Exhibits27: Historic Market Size - Application Segment 2019 - 2023 ($ million)
- Exhibits28: Historic Market Size - Technology Segment 2019 - 2023 ($ million)
- Exhibits29: Historic Market Size - Geography Segment 2019 - 2023 ($ million)
- Exhibits30: Historic Market Size - Country Segment 2019 - 2023 ($ million)
- Exhibits31: Five forces analysis - Comparison between 2024 and 2029
- Exhibits32: Bargaining power of buyers - Impact of key factors 2024 and 2029
- Exhibits33: Bargaining power of suppliers - Impact of key factors in 2024 and 2029
- Exhibits34: Threat of new entrants - Impact of key factors in 2024 and 2029
- Exhibits35: Threat of substitutes - Impact of key factors in 2024 and 2029
- Exhibits36: Threat of rivalry - Impact of key factors in 2024 and 2029
- Exhibits37: Chart on Market condition - Five forces 2024 and 2029
- Exhibits38: Chart on Product - Market share 2024-2029 (%)
- Exhibits39: Data Table on Product - Market share 2024-2029 (%)
- Exhibits40: Chart on Comparison by Product
- Exhibits41: Data Table on Comparison by Product
- Exhibits42: Chart on Hardware - Market size and forecast 2024-2029 ($ million)
- Exhibits43: Data Table on Hardware - Market size and forecast 2024-2029 ($ million)
- Exhibits44: Chart on Hardware - Year-over-year growth 2024-2029 (%)
- Exhibits45: Data Table on Hardware - Year-over-year growth 2024-2029 (%)
- Exhibits46: Chart on Software and services - Market size and forecast 2024-2029 ($ million)
- Exhibits47: Data Table on Software and services - Market size and forecast 2024-2029 ($ million)
- Exhibits48: Chart on Software and services - Year-over-year growth 2024-2029 (%)
- Exhibits49: Data Table on Software and services - Year-over-year growth 2024-2029 (%)
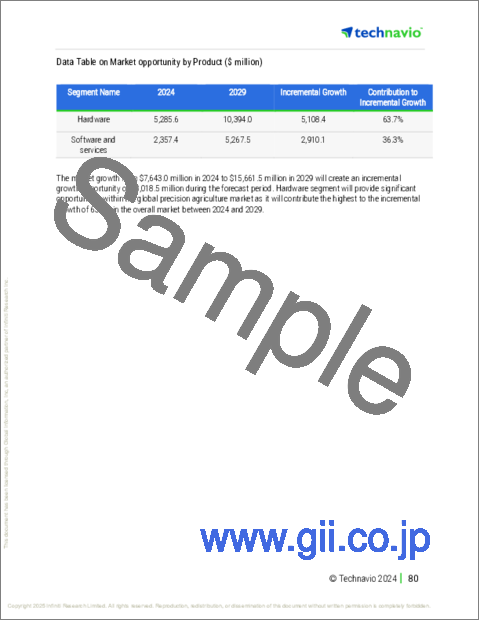
- Exhibits50: Market opportunity by Product ($ million)
- Exhibits51: Data Table on Market opportunity by Product ($ million)
- Exhibits52: Chart on Application - Market share 2024-2029 (%)
- Exhibits53: Data Table on Application - Market share 2024-2029 (%)
- Exhibits54: Chart on Comparison by Application
- Exhibits55: Data Table on Comparison by Application
- Exhibits56: Chart on Yield monitoring - Market size and forecast 2024-2029 ($ million)
- Exhibits57: Data Table on Yield monitoring - Market size and forecast 2024-2029 ($ million)
- Exhibits58: Chart on Yield monitoring - Year-over-year growth 2024-2029 (%)
- Exhibits59: Data Table on Yield monitoring - Year-over-year growth 2024-2029 (%)
- Exhibits60: Chart on Field mapping - Market size and forecast 2024-2029 ($ million)
- Exhibits61: Data Table on Field mapping - Market size and forecast 2024-2029 ($ million)
- Exhibits62: Chart on Field mapping - Year-over-year growth 2024-2029 (%)
- Exhibits63: Data Table on Field mapping - Year-over-year growth 2024-2029 (%)
- Exhibits64: Chart on Precision irrigation - Market size and forecast 2024-2029 ($ million)
- Exhibits65: Data Table on Precision irrigation - Market size and forecast 2024-2029 ($ million)
- Exhibits66: Chart on Precision irrigation - Year-over-year growth 2024-2029 (%)
- Exhibits67: Data Table on Precision irrigation - Year-over-year growth 2024-2029 (%)
- Exhibits68: Chart on Crop scouting - Market size and forecast 2024-2029 ($ million)
- Exhibits69: Data Table on Crop scouting - Market size and forecast 2024-2029 ($ million)
- Exhibits70: Chart on Crop scouting - Year-over-year growth 2024-2029 (%)
- Exhibits71: Data Table on Crop scouting - Year-over-year growth 2024-2029 (%)
- Exhibits72: Chart on Others - Market size and forecast 2024-2029 ($ million)
- Exhibits73: Data Table on Others - Market size and forecast 2024-2029 ($ million)
- Exhibits74: Chart on Others - Year-over-year growth 2024-2029 (%)
- Exhibits75: Data Table on Others - Year-over-year growth 2024-2029 (%)
- Exhibits76: Market opportunity by Application ($ million)
- Exhibits77: Data Table on Market opportunity by Application ($ million)
- Exhibits78: Chart on Technology - Market share 2024-2029 (%)
- Exhibits79: Data Table on Technology - Market share 2024-2029 (%)
- Exhibits80: Chart on Comparison by Technology
- Exhibits81: Data Table on Comparison by Technology
- Exhibits82: Chart on Internet of things (IoT) - Market size and forecast 2024-2029 ($ million)
- Exhibits83: Data Table on Internet of things (IoT) - Market size and forecast 2024-2029 ($ million)
- Exhibits84: Chart on Internet of things (IoT) - Year-over-year growth 2024-2029 (%)
- Exhibits85: Data Table on Internet of things (IoT) - Year-over-year growth 2024-2029 (%)
- Exhibits86: Chart on Artificial intelligence (AI) - Market size and forecast 2024-2029 ($ million)
- Exhibits87: Data Table on Artificial intelligence (AI) - Market size and forecast 2024-2029 ($ million)
- Exhibits88: Chart on Artificial intelligence (AI) - Year-over-year growth 2024-2029 (%)
- Exhibits89: Data Table on Artificial intelligence (AI) - Year-over-year growth 2024-2029 (%)
- Exhibits90: Chart on Big data and analytics - Market size and forecast 2024-2029 ($ million)
- Exhibits91: Data Table on Big data and analytics - Market size and forecast 2024-2029 ($ million)
- Exhibits92: Chart on Big data and analytics - Year-over-year growth 2024-2029 (%)
- Exhibits93: Data Table on Big data and analytics - Year-over-year growth 2024-2029 (%)
- Exhibits94: Chart on Remote sensing - Market size and forecast 2024-2029 ($ million)
- Exhibits95: Data Table on Remote sensing - Market size and forecast 2024-2029 ($ million)
- Exhibits96: Chart on Remote sensing - Year-over-year growth 2024-2029 (%)
- Exhibits97: Data Table on Remote sensing - Year-over-year growth 2024-2029 (%)
- Exhibits98: Chart on Robotics and automation - Market size and forecast 2024-2029 ($ million)
- Exhibits99: Data Table on Robotics and automation - Market size and forecast 2024-2029 ($ million)
- Exhibits100: Chart on Robotics and automation - Year-over-year growth 2024-2029 (%)
- Exhibits101: Data Table on Robotics and automation - Year-over-year growth 2024-2029 (%)
- Exhibits102: Market opportunity by Technology ($ million)
- Exhibits103: Data Table on Market opportunity by Technology ($ million)
- Exhibits104: Analysis of price sensitivity, lifecycle, customer purchase basket, adoption rates, and purchase criteria
- Exhibits105: Chart on Market share By Geographical Landscape 2024-2029 (%)
- Exhibits106: Data Table on Market share By Geographical Landscape 2024-2029 (%)
- Exhibits107: Chart on Geographic comparison
- Exhibits108: Data Table on Geographic comparison
- Exhibits109: Chart on North America - Market size and forecast 2024-2029 ($ million)
- Exhibits110: Data Table on North America - Market size and forecast 2024-2029 ($ million)
- Exhibits111: Chart on North America - Year-over-year growth 2024-2029 (%)
- Exhibits112: Data Table on North America - Year-over-year growth 2024-2029 (%)
- Exhibits113: Chart on Europe - Market size and forecast 2024-2029 ($ million)
- Exhibits114: Data Table on Europe - Market size and forecast 2024-2029 ($ million)
- Exhibits115: Chart on Europe - Year-over-year growth 2024-2029 (%)
- Exhibits116: Data Table on Europe - Year-over-year growth 2024-2029 (%)
- Exhibits117: Chart on APAC - Market size and forecast 2024-2029 ($ million)
- Exhibits118: Data Table on APAC - Market size and forecast 2024-2029 ($ million)
- Exhibits119: Chart on APAC - Year-over-year growth 2024-2029 (%)
- Exhibits120: Data Table on APAC - Year-over-year growth 2024-2029 (%)
- Exhibits121: Chart on South America - Market size and forecast 2024-2029 ($ million)
- Exhibits122: Data Table on South America - Market size and forecast 2024-2029 ($ million)
- Exhibits123: Chart on South America - Year-over-year growth 2024-2029 (%)
- Exhibits124: Data Table on South America - Year-over-year growth 2024-2029 (%)
- Exhibits125: Chart on Middle East and Africa - Market size and forecast 2024-2029 ($ million)
- Exhibits126: Data Table on Middle East and Africa - Market size and forecast 2024-2029 ($ million)
- Exhibits127: Chart on Middle East and Africa - Year-over-year growth 2024-2029 (%)
- Exhibits128: Data Table on Middle East and Africa - Year-over-year growth 2024-2029 (%)
- Exhibits129: Chart on US - Market size and forecast 2024-2029 ($ million)
- Exhibits130: Data Table on US - Market size and forecast 2024-2029 ($ million)
- Exhibits131: Chart on US - Year-over-year growth 2024-2029 (%)
- Exhibits132: Data Table on US - Year-over-year growth 2024-2029 (%)
- Exhibits133: Chart on China - Market size and forecast 2024-2029 ($ million)
- Exhibits134: Data Table on China - Market size and forecast 2024-2029 ($ million)
- Exhibits135: Chart on China - Year-over-year growth 2024-2029 (%)
- Exhibits136: Data Table on China - Year-over-year growth 2024-2029 (%)
- Exhibits137: Chart on Germany - Market size and forecast 2024-2029 ($ million)
- Exhibits138: Data Table on Germany - Market size and forecast 2024-2029 ($ million)
- Exhibits139: Chart on Germany - Year-over-year growth 2024-2029 (%)
- Exhibits140: Data Table on Germany - Year-over-year growth 2024-2029 (%)
- Exhibits141: Chart on UK - Market size and forecast 2024-2029 ($ million)
- Exhibits142: Data Table on UK - Market size and forecast 2024-2029 ($ million)
- Exhibits143: Chart on UK - Year-over-year growth 2024-2029 (%)
- Exhibits144: Data Table on UK - Year-over-year growth 2024-2029 (%)
- Exhibits145: Chart on Canada - Market size and forecast 2024-2029 ($ million)
- Exhibits146: Data Table on Canada - Market size and forecast 2024-2029 ($ million)
- Exhibits147: Chart on Canada - Year-over-year growth 2024-2029 (%)
- Exhibits148: Data Table on Canada - Year-over-year growth 2024-2029 (%)
- Exhibits149: Chart on France - Market size and forecast 2024-2029 ($ million)
- Exhibits150: Data Table on France - Market size and forecast 2024-2029 ($ million)
- Exhibits151: Chart on France - Year-over-year growth 2024-2029 (%)
- Exhibits152: Data Table on France - Year-over-year growth 2024-2029 (%)
- Exhibits153: Chart on Australia - Market size and forecast 2024-2029 ($ million)
- Exhibits154: Data Table on Australia - Market size and forecast 2024-2029 ($ million)
- Exhibits155: Chart on Australia - Year-over-year growth 2024-2029 (%)
- Exhibits156: Data Table on Australia - Year-over-year growth 2024-2029 (%)
- Exhibits157: Chart on India - Market size and forecast 2024-2029 ($ million)
- Exhibits158: Data Table on India - Market size and forecast 2024-2029 ($ million)
- Exhibits159: Chart on India - Year-over-year growth 2024-2029 (%)
- Exhibits160: Data Table on India - Year-over-year growth 2024-2029 (%)
- Exhibits161: Chart on Italy - Market size and forecast 2024-2029 ($ million)
- Exhibits162: Data Table on Italy - Market size and forecast 2024-2029 ($ million)
- Exhibits163: Chart on Italy - Year-over-year growth 2024-2029 (%)
- Exhibits164: Data Table on Italy - Year-over-year growth 2024-2029 (%)
- Exhibits165: Chart on Spain - Market size and forecast 2024-2029 ($ million)
- Exhibits166: Data Table on Spain - Market size and forecast 2024-2029 ($ million)
- Exhibits167: Chart on Spain - Year-over-year growth 2024-2029 (%)
- Exhibits168: Data Table on Spain - Year-over-year growth 2024-2029 (%)
- Exhibits169: Market opportunity By Geographical Landscape ($ million)
- Exhibits170: Data Tables on Market opportunity By Geographical Landscape ($ million)
- Exhibits171: Impact of drivers and challenges in 2024 and 2029
- Exhibits172: Overview on criticality of inputs and factors of differentiation
- Exhibits173: Overview on factors of disruption
- Exhibits174: Impact of key risks on business
- Exhibits175: Companies covered
- Exhibits176: Company ranking index
- Exhibits177: Matrix on companies position and classification
- Exhibits178: AAA Taranis Visual Ltd. - Overview
- Exhibits179: AAA Taranis Visual Ltd. - Product / Service
- Exhibits180: AAA Taranis Visual Ltd. - Key offerings
- Exhibits181: SWOT
- Exhibits182: Abaco Spa - Overview
- Exhibits183: Abaco Spa - Product / Service
- Exhibits184: Abaco Spa - Key offerings
- Exhibits185: SWOT
- Exhibits186: Ag Leader Technology - Overview
- Exhibits187: Ag Leader Technology - Product / Service
- Exhibits188: Ag Leader Technology - Key offerings
- Exhibits189: SWOT
- Exhibits190: AGCO Corp. - Overview
- Exhibits191: AGCO Corp. - Business segments
- Exhibits192: AGCO Corp. - Key news
- Exhibits193: AGCO Corp. - Key offerings
- Exhibits194: AGCO Corp. - Segment focus
- Exhibits195: SWOT
- Exhibits196: Agribotix - Overview
- Exhibits197: Agribotix - Product / Service
- Exhibits198: Agribotix - Key offerings
- Exhibits199: SWOT
- Exhibits200: Carl Zeiss AG - Overview
- Exhibits201: Carl Zeiss AG - Product / Service
- Exhibits202: Carl Zeiss AG - Key news
- Exhibits203: Carl Zeiss AG - Key offerings
- Exhibits204: SWOT
- Exhibits205: CNH Industrial NV - Overview
- Exhibits206: CNH Industrial NV - Business segments
- Exhibits207: CNH Industrial NV - Key offerings
- Exhibits208: CNH Industrial NV - Segment focus
- Exhibits209: SWOT
- Exhibits210: CropX Technologies Ltd. - Overview
- Exhibits211: CropX Technologies Ltd. - Product / Service
- Exhibits212: CropX Technologies Ltd. - Key offerings
- Exhibits213: SWOT
- Exhibits214: Deere and Co. - Overview
- Exhibits215: Deere and Co. - Business segments
- Exhibits216: Deere and Co. - Key news
- Exhibits217: Deere and Co. - Key offerings
- Exhibits218: Deere and Co. - Segment focus
- Exhibits219: SWOT
- Exhibits220: DICKEY john - Overview
- Exhibits221: DICKEY john - Product / Service
- Exhibits222: DICKEY john - Key offerings
- Exhibits223: SWOT
- Exhibits224: Kubota Corp. - Overview
- Exhibits225: Kubota Corp. - Business segments
- Exhibits226: Kubota Corp. - Key offerings
- Exhibits227: Kubota Corp. - Segment focus
- Exhibits228: SWOT
- Exhibits229: TeeJet Technologies - Overview
- Exhibits230: TeeJet Technologies - Product / Service
- Exhibits231: TeeJet Technologies - Key offerings
- Exhibits232: SWOT
- Exhibits233: The Toro Co. - Overview
- Exhibits234: The Toro Co. - Business segments
- Exhibits235: The Toro Co. - Key news
- Exhibits236: The Toro Co. - Key offerings
- Exhibits237: The Toro Co. - Segment focus
- Exhibits238: SWOT
- Exhibits239: Trimble Inc. - Overview
- Exhibits240: Trimble Inc. - Business segments
- Exhibits241: Trimble Inc. - Key news
- Exhibits242: Trimble Inc. - Key offerings
- Exhibits243: Trimble Inc. - Segment focus
- Exhibits244: SWOT
- Exhibits245: Yara International ASA - Overview
- Exhibits246: Yara International ASA - Business segments
- Exhibits247: Yara International ASA - Key offerings
- Exhibits248: Yara International ASA - Segment focus
- Exhibits249: SWOT
- Exhibits250: Inclusions checklist
- Exhibits251: Exclusions checklist
- Exhibits252: Currency conversion rates for US$
- Exhibits253: Research methodology
- Exhibits254: Information sources
- Exhibits255: Data validation
- Exhibits256: Validation techniques employed for market sizing
- Exhibits257: Data synthesis
- Exhibits258: 360 degree market analysis
- Exhibits259: List of abbreviations
The precision agriculture market is forecasted to grow by USD 8,018.5 mn during 2024-2029, accelerating at a CAGR of 15.4% during the forecast period. The report on the precision agriculture market provides a holistic analysis, market size and forecast, trends, growth drivers, and challenges, as well as vendor analysis covering around 25 vendors.
The report offers an up-to-date analysis regarding the current market scenario, the latest trends and drivers, and the overall market environment. The market is driven by rise in investments in agricultural technologies, focus on increasing agricultural output, and rising need to manage data on agricultural farms.
| Market Scope | |
|---|---|
| Base Year | 2025 |
| End Year | 2029 |
| Series Year | 2025-2029 |
| Growth Momentum | Accelerate |
| YOY 2025 | 13% |
| CAGR | 15.4% |
| Incremental Value | $8,018.5 mn |
The study was conducted using an objective combination of primary and secondary information including inputs from key participants in the industry. The report contains a comprehensive market size data, segment with regional analysis and vendor landscape in addition to an analysis of the key companies. Reports have historic and forecast data.
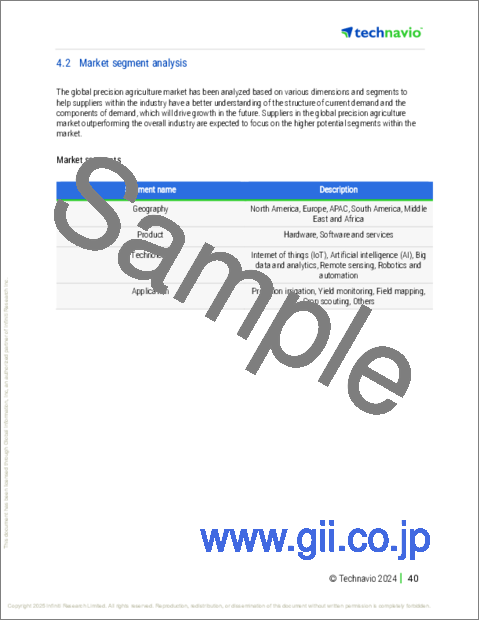
Technavio's precision agriculture market is segmented as below:
By Product
- Hardware
- Software and services
By Application
- Precision irrigation
- Yield monitoring
- Field mapping
- Crop scouting
- Others
By Technology
- Internet of things (IoT)
- Artificial intelligence (AI)
- Big data and analytics
- Remote sensing
- Robotics and automation
By Geographical Landscape
- North America
- Europe
- APAC
- South America
- Middle East and Africa
This study identifies the technological advances in precision agriculture as one of the prime reasons driving the precision agriculture market growth during the next few years. Also, increase in number of strategic alliances and rising influence of big data analytics on precision agriculture will lead to sizable demand in the market.
The report on the precision agriculture market covers the following areas:
- Precision Agriculture Market sizing
- Precision Agriculture Market forecast
- Precision Agriculture Market industry analysis
The robust vendor analysis is designed to help clients improve their market position, and in line with this, this report provides a detailed analysis of several leading precision agriculture market vendors that include AAA Taranis Visual Ltd., Abaco Spa, Ag Leader Technology, AGCO Corp., Agribotix, Carl Zeiss AG, CNH Industrial NV, CropX Technologies Ltd., Deere and Co., DICKEY john, Farmers Edge Inc., Hexagon AB, Iteris Inc., Kubota Corp., TeeJet Technologies, The Toro Co., Topcon Corp., Trimble Inc., and Yara International ASA. Also, the precision agriculture market analysis report includes information on upcoming trends and challenges that will influence market growth. This is to help companies strategize and leverage all forthcoming growth opportunities.
The publisher presents a detailed picture of the market by the way of study, synthesis, and summation of data from multiple sources by an analysis of key parameters such as profit, pricing, competition, and promotions. It presents various market facets by identifying the key industry influencers. The data presented is comprehensive, reliable, and a result of extensive primary and secondary research. The market research reports provide a complete competitive landscape and an in-depth vendor selection methodology and analysis using qualitative and quantitative research to forecast accurate market growth.
Table of Contents
1 Executive Summary
- 1.1 Market overview
- Executive Summary - Chart on Market Overview
- Executive Summary - Data Table on Market Overview
- Executive Summary - Chart on Global Market Characteristics
- Executive Summary - Chart on Market By Geographical Landscape
- Executive Summary - Chart on Market Segmentation by Product
- Executive Summary - Chart on Market Segmentation by Application
- Executive Summary - Chart on Market Segmentation by Technology
- Executive Summary - Chart on Incremental Growth
- Executive Summary - Data Table on Incremental Growth
- Executive Summary - Chart on Company Market Positioning
2 Technavio Analysis
- 2.1 Analysis of price sensitivity, lifecycle, customer purchase basket, adoption rates, and purchase criteria
- Analysis of price sensitivity, lifecycle, customer purchase basket, adoption rates, and purchase criteria
- 2.2 Criticality of inputs and Factors of differentiation
- Overview on criticality of inputs and factors of differentiation
- 2.3 Factors of disruption
- Overview on factors of disruption
- 2.4 Impact of drivers and challenges
- Impact of drivers and challenges in 2024 and 2029
3 Market Landscape
- 3.1 Market ecosystem
- Parent Market
- Data Table on - Parent Market
- 3.2 Market characteristics
- Market characteristics analysis
- 3.3 Value chain analysis
- Value chain analysis
4 Market Sizing
- 4.1 Market definition
- Offerings of companies included in the market definition
- 4.2 Market segment analysis
- Market segments
- 4.3 Market size 2024
- 4.4 Market outlook: Forecast for 2024-2029
- Chart on Global - Market size and forecast 2024-2029 ($ million)
- Data Table on Global - Market size and forecast 2024-2029 ($ million)
- Chart on Global Market: Year-over-year growth 2024-2029 (%)
- Data Table on Global Market: Year-over-year growth 2024-2029 (%)
5 Historic Market Size
- 5.1 Global Precision Agriculture Market 2019 - 2023
- Historic Market Size - Data Table on Global Precision Agriculture Market 2019 - 2023 ($ million)
- 5.2 Product segment analysis 2019 - 2023
- Historic Market Size - Product Segment 2019 - 2023 ($ million)
- 5.3 Application segment analysis 2019 - 2023
- Historic Market Size - Application Segment 2019 - 2023 ($ million)
- 5.4 Technology segment analysis 2019 - 2023
- Historic Market Size - Technology Segment 2019 - 2023 ($ million)
- 5.5 Geography segment analysis 2019 - 2023
- Historic Market Size - Geography Segment 2019 - 2023 ($ million)
- 5.6 Country segment analysis 2019 - 2023
- Historic Market Size - Country Segment 2019 - 2023 ($ million)
6 Qualitative Analysis
- 6.1 The AI impact on global precision agriculture market
7 Five Forces Analysis
- 7.1 Five forces summary
- Five forces analysis - Comparison between 2024 and 2029
- 7.2 Bargaining power of buyers
- Bargaining power of buyers - Impact of key factors 2024 and 2029
- 7.3 Bargaining power of suppliers
- Bargaining power of suppliers - Impact of key factors in 2024 and 2029
- 7.4 Threat of new entrants
- Threat of new entrants - Impact of key factors in 2024 and 2029
- 7.5 Threat of substitutes
- Threat of substitutes - Impact of key factors in 2024 and 2029
- 7.6 Threat of rivalry
- Threat of rivalry - Impact of key factors in 2024 and 2029
- 7.7 Market condition
- Chart on Market condition - Five forces 2024 and 2029
8 Market Segmentation by Product
- 8.1 Market segments
- Chart on Product - Market share 2024-2029 (%)
- Data Table on Product - Market share 2024-2029 (%)
- 8.2 Comparison by Product
- Chart on Comparison by Product
- Data Table on Comparison by Product
- 8.3 Hardware - Market size and forecast 2024-2029
- Chart on Hardware - Market size and forecast 2024-2029 ($ million)
- Data Table on Hardware - Market size and forecast 2024-2029 ($ million)
- Chart on Hardware - Year-over-year growth 2024-2029 (%)
- Data Table on Hardware - Year-over-year growth 2024-2029 (%)
- 8.4 Software and services - Market size and forecast 2024-2029
- Chart on Software and services - Market size and forecast 2024-2029 ($ million)
- Data Table on Software and services - Market size and forecast 2024-2029 ($ million)
- Chart on Software and services - Year-over-year growth 2024-2029 (%)
- Data Table on Software and services - Year-over-year growth 2024-2029 (%)
- 8.5 Market opportunity by Product
- Market opportunity by Product ($ million)
- Data Table on Market opportunity by Product ($ million)
9 Market Segmentation by Application
- 9.1 Market segments
- Chart on Application - Market share 2024-2029 (%)
- Data Table on Application - Market share 2024-2029 (%)
- 9.2 Comparison by Application
- Chart on Comparison by Application
- Data Table on Comparison by Application
- 9.3 Yield monitoring - Market size and forecast 2024-2029
- Chart on Yield monitoring - Market size and forecast 2024-2029 ($ million)
- Data Table on Yield monitoring - Market size and forecast 2024-2029 ($ million)
- Chart on Yield monitoring - Year-over-year growth 2024-2029 (%)
- Data Table on Yield monitoring - Year-over-year growth 2024-2029 (%)
- 9.4 Field mapping - Market size and forecast 2024-2029
- Chart on Field mapping - Market size and forecast 2024-2029 ($ million)
- Data Table on Field mapping - Market size and forecast 2024-2029 ($ million)
- Chart on Field mapping - Year-over-year growth 2024-2029 (%)
- Data Table on Field mapping - Year-over-year growth 2024-2029 (%)
- 9.5 Precision irrigation - Market size and forecast 2024-2029
- Chart on Precision irrigation - Market size and forecast 2024-2029 ($ million)
- Data Table on Precision irrigation - Market size and forecast 2024-2029 ($ million)
- Chart on Precision irrigation - Year-over-year growth 2024-2029 (%)
- Data Table on Precision irrigation - Year-over-year growth 2024-2029 (%)
- 9.6 Crop scouting - Market size and forecast 2024-2029
- Chart on Crop scouting - Market size and forecast 2024-2029 ($ million)
- Data Table on Crop scouting - Market size and forecast 2024-2029 ($ million)
- Chart on Crop scouting - Year-over-year growth 2024-2029 (%)
- Data Table on Crop scouting - Year-over-year growth 2024-2029 (%)
- 9.7 Others - Market size and forecast 2024-2029
- Chart on Others - Market size and forecast 2024-2029 ($ million)
- Data Table on Others - Market size and forecast 2024-2029 ($ million)
- Chart on Others - Year-over-year growth 2024-2029 (%)
- Data Table on Others - Year-over-year growth 2024-2029 (%)
- 9.8 Market opportunity by Application
- Market opportunity by Application ($ million)
- Data Table on Market opportunity by Application ($ million)
10 Market Segmentation by Technology
- 10.1 Market segments
- Chart on Technology - Market share 2024-2029 (%)
- Data Table on Technology - Market share 2024-2029 (%)
- 10.2 Comparison by Technology
- Chart on Comparison by Technology
- Data Table on Comparison by Technology
- 10.3 Internet of things (IoT) - Market size and forecast 2024-2029
- Chart on Internet of things (IoT) - Market size and forecast 2024-2029 ($ million)
- Data Table on Internet of things (IoT) - Market size and forecast 2024-2029 ($ million)
- Chart on Internet of things (IoT) - Year-over-year growth 2024-2029 (%)
- Data Table on Internet of things (IoT) - Year-over-year growth 2024-2029 (%)
- 10.4 Artificial intelligence (AI) - Market size and forecast 2024-2029
- Chart on Artificial intelligence (AI) - Market size and forecast 2024-2029 ($ million)
- Data Table on Artificial intelligence (AI) - Market size and forecast 2024-2029 ($ million)
- Chart on Artificial intelligence (AI) - Year-over-year growth 2024-2029 (%)
- Data Table on Artificial intelligence (AI) - Year-over-year growth 2024-2029 (%)
- 10.5 Big data and analytics - Market size and forecast 2024-2029
- Chart on Big data and analytics - Market size and forecast 2024-2029 ($ million)
- Data Table on Big data and analytics - Market size and forecast 2024-2029 ($ million)
- Chart on Big data and analytics - Year-over-year growth 2024-2029 (%)
- Data Table on Big data and analytics - Year-over-year growth 2024-2029 (%)
- 10.6 Remote sensing - Market size and forecast 2024-2029
- Chart on Remote sensing - Market size and forecast 2024-2029 ($ million)
- Data Table on Remote sensing - Market size and forecast 2024-2029 ($ million)
- Chart on Remote sensing - Year-over-year growth 2024-2029 (%)
- Data Table on Remote sensing - Year-over-year growth 2024-2029 (%)
- 10.7 Robotics and automation - Market size and forecast 2024-2029
- Chart on Robotics and automation - Market size and forecast 2024-2029 ($ million)
- Data Table on Robotics and automation - Market size and forecast 2024-2029 ($ million)
- Chart on Robotics and automation - Year-over-year growth 2024-2029 (%)
- Data Table on Robotics and automation - Year-over-year growth 2024-2029 (%)
- 10.8 Market opportunity by Technology
- Market opportunity by Technology ($ million)
- Data Table on Market opportunity by Technology ($ million)
11 Customer Landscape
- 11.1 Customer landscape overview
- Analysis of price sensitivity, lifecycle, customer purchase basket, adoption rates, and purchase criteria
12 Geographic Landscape
- 12.1 Geographic segmentation
- Chart on Market share By Geographical Landscape 2024-2029 (%)
- Data Table on Market share By Geographical Landscape 2024-2029 (%)
- 12.2 Geographic comparison
- Chart on Geographic comparison
- Data Table on Geographic comparison
- 12.3 North America - Market size and forecast 2024-2029
- Chart on North America - Market size and forecast 2024-2029 ($ million)
- Data Table on North America - Market size and forecast 2024-2029 ($ million)
- Chart on North America - Year-over-year growth 2024-2029 (%)
- Data Table on North America - Year-over-year growth 2024-2029 (%)
- 12.4 Europe - Market size and forecast 2024-2029
- Chart on Europe - Market size and forecast 2024-2029 ($ million)
- Data Table on Europe - Market size and forecast 2024-2029 ($ million)
- Chart on Europe - Year-over-year growth 2024-2029 (%)
- Data Table on Europe - Year-over-year growth 2024-2029 (%)
- 12.5 APAC - Market size and forecast 2024-2029
- Chart on APAC - Market size and forecast 2024-2029 ($ million)
- Data Table on APAC - Market size and forecast 2024-2029 ($ million)
- Chart on APAC - Year-over-year growth 2024-2029 (%)
- Data Table on APAC - Year-over-year growth 2024-2029 (%)
- 12.6 South America - Market size and forecast 2024-2029
- Chart on South America - Market size and forecast 2024-2029 ($ million)
- Data Table on South America - Market size and forecast 2024-2029 ($ million)
- Chart on South America - Year-over-year growth 2024-2029 (%)
- Data Table on South America - Year-over-year growth 2024-2029 (%)
- 12.7 Middle East and Africa - Market size and forecast 2024-2029
- Chart on Middle East and Africa - Market size and forecast 2024-2029 ($ million)
- Data Table on Middle East and Africa - Market size and forecast 2024-2029 ($ million)
- Chart on Middle East and Africa - Year-over-year growth 2024-2029 (%)
- Data Table on Middle East and Africa - Year-over-year growth 2024-2029 (%)
- 12.8 US - Market size and forecast 2024-2029
- Chart on US - Market size and forecast 2024-2029 ($ million)
- Data Table on US - Market size and forecast 2024-2029 ($ million)
- Chart on US - Year-over-year growth 2024-2029 (%)
- Data Table on US - Year-over-year growth 2024-2029 (%)
- 12.9 China - Market size and forecast 2024-2029
- Chart on China - Market size and forecast 2024-2029 ($ million)
- Data Table on China - Market size and forecast 2024-2029 ($ million)
- Chart on China - Year-over-year growth 2024-2029 (%)
- Data Table on China - Year-over-year growth 2024-2029 (%)
- 12.10 Germany - Market size and forecast 2024-2029
- Chart on Germany - Market size and forecast 2024-2029 ($ million)
- Data Table on Germany - Market size and forecast 2024-2029 ($ million)
- Chart on Germany - Year-over-year growth 2024-2029 (%)
- Data Table on Germany - Year-over-year growth 2024-2029 (%)
- 12.11 UK - Market size and forecast 2024-2029
- Chart on UK - Market size and forecast 2024-2029 ($ million)
- Data Table on UK - Market size and forecast 2024-2029 ($ million)
- Chart on UK - Year-over-year growth 2024-2029 (%)
- Data Table on UK - Year-over-year growth 2024-2029 (%)
- 12.12 Canada - Market size and forecast 2024-2029
- Chart on Canada - Market size and forecast 2024-2029 ($ million)
- Data Table on Canada - Market size and forecast 2024-2029 ($ million)
- Chart on Canada - Year-over-year growth 2024-2029 (%)
- Data Table on Canada - Year-over-year growth 2024-2029 (%)
- 12.13 France - Market size and forecast 2024-2029
- Chart on France - Market size and forecast 2024-2029 ($ million)
- Data Table on France - Market size and forecast 2024-2029 ($ million)
- Chart on France - Year-over-year growth 2024-2029 (%)
- Data Table on France - Year-over-year growth 2024-2029 (%)
- 12.14 Australia - Market size and forecast 2024-2029
- Chart on Australia - Market size and forecast 2024-2029 ($ million)
- Data Table on Australia - Market size and forecast 2024-2029 ($ million)
- Chart on Australia - Year-over-year growth 2024-2029 (%)
- Data Table on Australia - Year-over-year growth 2024-2029 (%)
- 12.15 India - Market size and forecast 2024-2029
- Chart on India - Market size and forecast 2024-2029 ($ million)
- Data Table on India - Market size and forecast 2024-2029 ($ million)
- Chart on India - Year-over-year growth 2024-2029 (%)
- Data Table on India - Year-over-year growth 2024-2029 (%)
- 12.16 Italy - Market size and forecast 2024-2029
- Chart on Italy - Market size and forecast 2024-2029 ($ million)
- Data Table on Italy - Market size and forecast 2024-2029 ($ million)
- Chart on Italy - Year-over-year growth 2024-2029 (%)
- Data Table on Italy - Year-over-year growth 2024-2029 (%)
- 12.17 Spain - Market size and forecast 2024-2029
- Chart on Spain - Market size and forecast 2024-2029 ($ million)
- Data Table on Spain - Market size and forecast 2024-2029 ($ million)
- Chart on Spain - Year-over-year growth 2024-2029 (%)
- Data Table on Spain - Year-over-year growth 2024-2029 (%)
- 12.18 Market opportunity By Geographical Landscape
- Market opportunity By Geographical Landscape ($ million)
- Data Tables on Market opportunity By Geographical Landscape ($ million)
13 Drivers, Challenges, and Opportunity/Restraints
- 13.1 Market drivers
- 13.2 Market challenges
- 13.3 Impact of drivers and challenges
- Impact of drivers and challenges in 2024 and 2029
- 13.4 Market opportunities/restraints
14 Competitive Landscape
- 14.1 Overview
- 14.2 Competitive Landscape
- Overview on criticality of inputs and factors of differentiation
- 14.3 Landscape disruption
- Overview on factors of disruption
- 14.4 Industry risks
- Impact of key risks on business
15 Competitive Analysis
- 15.1 Companies profiled
- Companies covered
- 15.2 Company ranking index
- Company ranking index
- 15.3 Market positioning of companies
- Matrix on companies position and classification
- 15.4 AAA Taranis Visual Ltd.
- AAA Taranis Visual Ltd. - Overview
- AAA Taranis Visual Ltd. - Product / Service
- AAA Taranis Visual Ltd. - Key offerings
- SWOT
- 15.5 Abaco Spa
- Abaco Spa - Overview
- Abaco Spa - Product / Service
- Abaco Spa - Key offerings
- SWOT
- 15.6 Ag Leader Technology
- Ag Leader Technology - Overview
- Ag Leader Technology - Product / Service
- Ag Leader Technology - Key offerings
- SWOT
- 15.7 AGCO Corp.
- AGCO Corp. - Overview
- AGCO Corp. - Business segments
- AGCO Corp. - Key news
- AGCO Corp. - Key offerings
- AGCO Corp. - Segment focus
- SWOT
- 15.8 Agribotix
- Agribotix - Overview
- Agribotix - Product / Service
- Agribotix - Key offerings
- SWOT
- 15.9 Carl Zeiss AG
- Carl Zeiss AG - Overview
- Carl Zeiss AG - Product / Service
- Carl Zeiss AG - Key news
- Carl Zeiss AG - Key offerings
- SWOT
- 15.10 CNH Industrial NV
- CNH Industrial NV - Overview
- CNH Industrial NV - Business segments
- CNH Industrial NV - Key offerings
- CNH Industrial NV - Segment focus
- SWOT
- 15.11 CropX Technologies Ltd.
- CropX Technologies Ltd. - Overview
- CropX Technologies Ltd. - Product / Service
- CropX Technologies Ltd. - Key offerings
- SWOT
- 15.12 Deere and Co.
- Deere and Co. - Overview
- Deere and Co. - Business segments
- Deere and Co. - Key news
- Deere and Co. - Key offerings
- Deere and Co. - Segment focus
- SWOT
- 15.13 DICKEY john
- DICKEY john - Overview
- DICKEY john - Product / Service
- DICKEY john - Key offerings
- SWOT
- 15.14 Kubota Corp.
- Kubota Corp. - Overview
- Kubota Corp. - Business segments
- Kubota Corp. - Key offerings
- Kubota Corp. - Segment focus
- SWOT
- 15.15 TeeJet Technologies
- TeeJet Technologies - Overview
- TeeJet Technologies - Product / Service
- TeeJet Technologies - Key offerings
- SWOT
- 15.16 The Toro Co.
- The Toro Co. - Overview
- The Toro Co. - Business segments
- The Toro Co. - Key news
- The Toro Co. - Key offerings
- The Toro Co. - Segment focus
- SWOT
- 15.17 Trimble Inc.
- Trimble Inc. - Overview
- Trimble Inc. - Business segments
- Trimble Inc. - Key news
- Trimble Inc. - Key offerings
- Trimble Inc. - Segment focus
- SWOT
- 15.18 Yara International ASA
- Yara International ASA - Overview
- Yara International ASA - Business segments
- Yara International ASA - Key offerings
- Yara International ASA - Segment focus
- SWOT
16 Appendix
- 16.1 Scope of the report
- 16.2 Inclusions and exclusions checklist
- Inclusions checklist
- Exclusions checklist
- 16.3 Currency conversion rates for US$
- Currency conversion rates for US$
- 16.4 Research methodology
- Research methodology
- 16.5 Data procurement
- Information sources
- 16.6 Data validation
- Data validation
- 16.7 Validation techniques employed for market sizing
- Validation techniques employed for market sizing
- 16.8 Data synthesis
- Data synthesis
- 16.9 360 degree market analysis
- 360 degree market analysis
- 16.10 List of abbreviations
- List of abbreviations

