|
|
市場調査レポート
商品コード
1524799
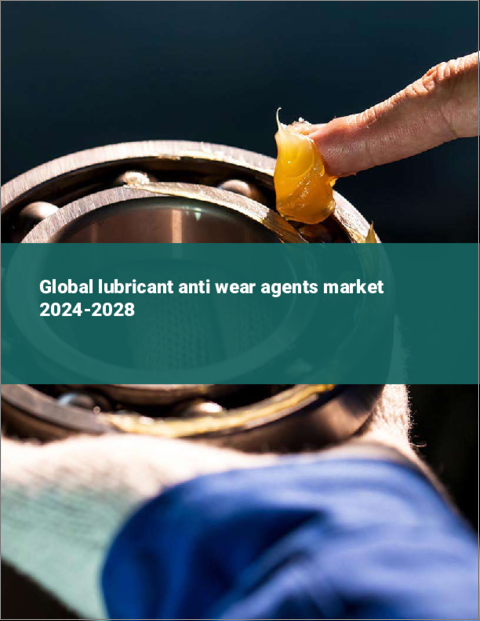
潤滑油耐摩耗剤の世界市場 2024-2028Global lubricant anti wear agents market 2024-2028 |
||||||
|
|||||||
カスタマイズ可能
|
|||||||

| 潤滑油耐摩耗剤の世界市場 2024-2028 |
|
出版日: 2024年07月03日
発行: TechNavio
ページ情報: 英文 165 Pages
納期: 即納可能
|

全表示
- 概要
- 図表
- 目次
潤滑油耐摩耗剤市場は2023-2028年に1億860万米ドル、予測期間中のCAGRは2.78%で成長すると予測されます。
当レポートでは、潤滑油耐摩耗剤市場の全体的な分析、市場規模・予測、動向、成長促進要因、課題、約25のベンダーを網羅したベンダー分析などを掲載しています。
現在の市場シナリオ、最新動向と促進要因、市場環境全体に関する最新分析を提供しています。市場は、信頼性の高い機械と効果的なメンテナンスに対するニーズの高まり、新興経済諸国における潤滑油需要の高まり、エンドユーザー産業からの需要の増加によって牽引されています。
| 市場範囲 | |
|---|---|
| 基準年 | 2024 |
| 終了年 | 2028 |
| 予測期間 | 2024-2028 |
| 成長モメンタム | 加速 |
| 前年比2024年 | 2.44% |
| CAGR | 2.78% |
| 増分額 | 1億860万米ドル |
本調査では、エンジンオイル技術の進歩が今後数年間の潤滑油耐摩耗剤市場成長を牽引する主要因の1つであるとしています。また、自動車用エンジンオイルの発売数の増加や、より薄いエンジンオイルの普及が市場の大きな需要につながります。
目次
第1章 エグゼクティブサマリー
- 市場概要
第2章 市場情勢
- 市場エコシステム
- 市場の特徴
- バリューチェーン分析
第3章 市場規模の評価
- 市場の定義
- 市場セグメント分析
- 市場規模 2023
- 市場の見通し 2023-2028
第4章 市場規模実績
- 世界潤滑油耐摩耗剤市場 2018-2022
- チャネル別セグメント分析 2018-2022
- タイプ別セグメント分析 2018-2022
- 地域別セグメント分析 2018-2022
- 国別セグメント分析 2018-2022
第5章 ファイブフォース分析
- ファイブフォースの要約
- 買い手の交渉力
- 供給企業の交渉力
- 新規参入業者の脅威
- 代替品の脅威
- 競争の脅威
- 市況
第6章 市場セグメンテーション:チャネル別
- 市場セグメンテーション
- 比較:チャネル別
- キャプティブ価格:市場規模と予測 2023-2028
- 小売価格:市場規模と予測 2023-2028
- 市場機会:チャネル別
第7章 市場セグメンテーション:タイプ別
- 市場セグメンテーション
- 比較:タイプ別
- ジアルキルジチオリン酸亜鉛:市場規模と予測 2023-2028
- リン酸:市場規模と予測 2023-2028
- 亜リン酸塩:市場規模と予測 2023-2028
- ホスホネート:市場規模と予測 2023-2028
- 市場機会:タイプ別
第8章 顧客情勢
- 顧客情勢の概要
第9章 地域別情勢
- 地域別セグメンテーション
- 地域別比較
- アジア太平洋:市場規模と予測 2023-2028
- 欧州:市場規模と予測 2023-2028
- 北米:市場規模と予測 2023-2028
- 中東・アフリカ:市場規模と予測 2023-2028
- 南米:市場規模と予測 2023-2028
- 米国:市場規模と予測 2023-2028
- 日本:市場規模と予測 2023-2028
- 中国:市場規模と予測 2023-2028
- ロシア:市場規模と予測 2023-2028
- インド:市場規模と予測 2023-2028
- 市場機会:地域情勢別
第10章 促進要因・課題・機会・抑制要因
- 市場促進要因
- 市場の課題
- 促進要因と課題の影響
- 市場の機会・抑制要因
第11章 競合情勢
- 概要
- 競合情勢
- 混乱の状況
- 業界のリスク
第12章 競合分析
- 企業プロファイル
- 企業の市場ポジショニング
- Afton Group
- BASF SE
- BRB International BV
- Chevron Corp.
- Croda International Plc
- DOG Chemical Products Ltd. and Co. Kg
- Dorf Ketal Chemicals I Pvt. Ltd.
- Dover Chemical Corp.
- Eni SpA
- Evonik Industries AG
- Infineum International Ltd.
- Lanxess AG
- Solvay SA
- The Lubrizol Corp.
- Wuxi Southern Petroleum Additives Co. Ltd.
第13章 付録
Exhibits:
- Exhibits1: Executive Summary - Chart on Market Overview
- Exhibits2: Executive Summary - Data Table on Market Overview
- Exhibits3: Executive Summary - Chart on Global Market Characteristics
- Exhibits4: Executive Summary - Chart on Market By Geographical Landscape
- Exhibits5: Executive Summary - Chart on Market Segmentation by Channel
- Exhibits6: Executive Summary - Chart on Market Segmentation by Type
- Exhibits7: Executive Summary - Chart on Incremental Growth
- Exhibits8: Executive Summary - Data Table on Incremental Growth
- Exhibits9: Executive Summary - Chart on Company Market Positioning
- Exhibits10: Parent Market
- Exhibits11: Data Table on - Parent Market
- Exhibits12: Market characteristics analysis
- Exhibits13: Value Chain Analysis
- Exhibits14: Offerings of companies included in the market definition
- Exhibits15: Market segments
- Exhibits16: Chart on Global - Market size and forecast 2023-2028 ($ million)
- Exhibits17: Data Table on Global - Market size and forecast 2023-2028 ($ million)
- Exhibits18: Chart on Global Market: Year-over-year growth 2023-2028 (%)
- Exhibits19: Data Table on Global Market: Year-over-year growth 2023-2028 (%)
- Exhibits20: Historic Market Size - Data Table on Global Lubricant Anti Wear Agents Market 2018 - 2022 ($ million)
- Exhibits21: Historic Market Size - Channel Segment 2018 - 2022 ($ million)
- Exhibits22: Historic Market Size - Type Segment 2018 - 2022 ($ million)
- Exhibits23: Historic Market Size - Geography Segment 2018 - 2022 ($ million)
- Exhibits24: Historic Market Size - Country Segment 2018 - 2022 ($ million)
- Exhibits25: Five forces analysis - Comparison between 2023 and 2028
- Exhibits26: Bargaining power of buyers - Impact of key factors 2023 and 2028
- Exhibits27: Bargaining power of suppliers - Impact of key factors in 2023 and 2028
- Exhibits28: Threat of new entrants - Impact of key factors in 2023 and 2028
- Exhibits29: Threat of substitutes - Impact of key factors in 2023 and 2028
- Exhibits30: Threat of rivalry - Impact of key factors in 2023 and 2028
- Exhibits31: Chart on Market condition - Five forces 2023 and 2028
- Exhibits32: Chart on Channel - Market share 2023-2028 (%)
- Exhibits33: Data Table on Channel - Market share 2023-2028 (%)
- Exhibits34: Chart on Comparison by Channel
- Exhibits35: Data Table on Comparison by Channel
- Exhibits36: Chart on Captive - Market size and forecast 2023-2028 ($ million)
- Exhibits37: Data Table on Captive - Market size and forecast 2023-2028 ($ million)
- Exhibits38: Chart on Captive - Year-over-year growth 2023-2028 (%)
- Exhibits39: Data Table on Captive - Year-over-year growth 2023-2028 (%)
- Exhibits40: Chart on Merchant - Market size and forecast 2023-2028 ($ million)
- Exhibits41: Data Table on Merchant - Market size and forecast 2023-2028 ($ million)
- Exhibits42: Chart on Merchant - Year-over-year growth 2023-2028 (%)
- Exhibits43: Data Table on Merchant - Year-over-year growth 2023-2028 (%)
- Exhibits44: Market opportunity by Channel ($ million)
- Exhibits45: Data Table on Market opportunity by Channel ($ million)
- Exhibits46: Chart on Type - Market share 2023-2028 (%)
- Exhibits47: Data Table on Type - Market share 2023-2028 (%)
- Exhibits48: Chart on Comparison by Type
- Exhibits49: Data Table on Comparison by Type
- Exhibits50: Chart on Zinc dialkyl di-thiophosphate - Market size and forecast 2023-2028 ($ million)
- Exhibits51: Data Table on Zinc dialkyl di-thiophosphate - Market size and forecast 2023-2028 ($ million)
- Exhibits52: Chart on Zinc dialkyl di-thiophosphate - Year-over-year growth 2023-2028 (%)
- Exhibits53: Data Table on Zinc dialkyl di-thiophosphate - Year-over-year growth 2023-2028 (%)
- Exhibits54: Chart on Phosphate - Market size and forecast 2023-2028 ($ million)
- Exhibits55: Data Table on Phosphate - Market size and forecast 2023-2028 ($ million)
- Exhibits56: Chart on Phosphate - Year-over-year growth 2023-2028 (%)
- Exhibits57: Data Table on Phosphate - Year-over-year growth 2023-2028 (%)
- Exhibits58: Chart on Phosphite - Market size and forecast 2023-2028 ($ million)
- Exhibits59: Data Table on Phosphite - Market size and forecast 2023-2028 ($ million)
- Exhibits60: Chart on Phosphite - Year-over-year growth 2023-2028 (%)
- Exhibits61: Data Table on Phosphite - Year-over-year growth 2023-2028 (%)
- Exhibits62: Chart on Phosphonate - Market size and forecast 2023-2028 ($ million)
- Exhibits63: Data Table on Phosphonate - Market size and forecast 2023-2028 ($ million)
- Exhibits64: Chart on Phosphonate - Year-over-year growth 2023-2028 (%)
- Exhibits65: Data Table on Phosphonate - Year-over-year growth 2023-2028 (%)
- Exhibits66: Market opportunity by Type ($ million)
- Exhibits67: Data Table on Market opportunity by Type ($ million)
- Exhibits68: Analysis of price sensitivity, lifecycle, customer purchase basket, adoption rates, and purchase criteria
- Exhibits69: Chart on Market share By Geographical Landscape 2023-2028 (%)
- Exhibits70: Data Table on Market share By Geographical Landscape 2023-2028 (%)
- Exhibits71: Chart on Geographic comparison
- Exhibits72: Data Table on Geographic comparison
- Exhibits73: Chart on APAC - Market size and forecast 2023-2028 ($ million)
- Exhibits74: Data Table on APAC - Market size and forecast 2023-2028 ($ million)
- Exhibits75: Chart on APAC - Year-over-year growth 2023-2028 (%)
- Exhibits76: Data Table on APAC - Year-over-year growth 2023-2028 (%)
- Exhibits77: Chart on Europe - Market size and forecast 2023-2028 ($ million)
- Exhibits78: Data Table on Europe - Market size and forecast 2023-2028 ($ million)
- Exhibits79: Chart on Europe - Year-over-year growth 2023-2028 (%)
- Exhibits80: Data Table on Europe - Year-over-year growth 2023-2028 (%)
- Exhibits81: Chart on North America - Market size and forecast 2023-2028 ($ million)
- Exhibits82: Data Table on North America - Market size and forecast 2023-2028 ($ million)
- Exhibits83: Chart on North America - Year-over-year growth 2023-2028 (%)
- Exhibits84: Data Table on North America - Year-over-year growth 2023-2028 (%)
- Exhibits85: Chart on Middle East and Africa - Market size and forecast 2023-2028 ($ million)
- Exhibits86: Data Table on Middle East and Africa - Market size and forecast 2023-2028 ($ million)
- Exhibits87: Chart on Middle East and Africa - Year-over-year growth 2023-2028 (%)
- Exhibits88: Data Table on Middle East and Africa - Year-over-year growth 2023-2028 (%)
- Exhibits89: Chart on South America - Market size and forecast 2023-2028 ($ million)
- Exhibits90: Data Table on South America - Market size and forecast 2023-2028 ($ million)
- Exhibits91: Chart on South America - Year-over-year growth 2023-2028 (%)
- Exhibits92: Data Table on South America - Year-over-year growth 2023-2028 (%)
- Exhibits93: Chart on US - Market size and forecast 2023-2028 ($ million)
- Exhibits94: Data Table on US - Market size and forecast 2023-2028 ($ million)
- Exhibits95: Chart on US - Year-over-year growth 2023-2028 (%)
- Exhibits96: Data Table on US - Year-over-year growth 2023-2028 (%)
- Exhibits97: Chart on Japan - Market size and forecast 2023-2028 ($ million)
- Exhibits98: Data Table on Japan - Market size and forecast 2023-2028 ($ million)
- Exhibits99: Chart on Japan - Year-over-year growth 2023-2028 (%)
- Exhibits100: Data Table on Japan - Year-over-year growth 2023-2028 (%)
- Exhibits101: Chart on China - Market size and forecast 2023-2028 ($ million)
- Exhibits102: Data Table on China - Market size and forecast 2023-2028 ($ million)
- Exhibits103: Chart on China - Year-over-year growth 2023-2028 (%)
- Exhibits104: Data Table on China - Year-over-year growth 2023-2028 (%)
- Exhibits105: Chart on Russia - Market size and forecast 2023-2028 ($ million)
- Exhibits106: Data Table on Russia - Market size and forecast 2023-2028 ($ million)
- Exhibits107: Chart on Russia - Year-over-year growth 2023-2028 (%)
- Exhibits108: Data Table on Russia - Year-over-year growth 2023-2028 (%)
- Exhibits109: Chart on India - Market size and forecast 2023-2028 ($ million)
- Exhibits110: Data Table on India - Market size and forecast 2023-2028 ($ million)
- Exhibits111: Chart on India - Year-over-year growth 2023-2028 (%)
- Exhibits112: Data Table on India - Year-over-year growth 2023-2028 (%)
- Exhibits113: Market opportunity By Geographical Landscape ($ million)
- Exhibits114: Data Tables on Market opportunity By Geographical Landscape ($ million)
- Exhibits115: Impact of drivers and challenges in 2023 and 2028
- Exhibits116: Overview on criticality of inputs and factors of differentiation
- Exhibits117: Overview on factors of disruption
- Exhibits118: Impact of key risks on business
- Exhibits119: Companies covered
- Exhibits120: Matrix on companies position and classification
- Exhibits121: Afton Group - Overview
- Exhibits122: Afton Group - Product / Service
- Exhibits123: Afton Group - Key offerings
- Exhibits124: BASF SE - Overview
- Exhibits125: BASF SE - Business segments
- Exhibits126: BASF SE - Key news
- Exhibits127: BASF SE - Key offerings
- Exhibits128: BASF SE - Segment focus
- Exhibits129: BRB International BV - Overview
- Exhibits130: BRB International BV - Product / Service
- Exhibits131: BRB International BV - Key offerings
- Exhibits132: Chevron Corp. - Overview
- Exhibits133: Chevron Corp. - Business segments
- Exhibits134: Chevron Corp. - Key news
- Exhibits135: Chevron Corp. - Key offerings
- Exhibits136: Chevron Corp. - Segment focus
- Exhibits137: Croda International Plc - Overview
- Exhibits138: Croda International Plc - Business segments
- Exhibits139: Croda International Plc - Key news
- Exhibits140: Croda International Plc - Key offerings
- Exhibits141: Croda International Plc - Segment focus
- Exhibits142: DOG Chemical Products Ltd. and Co. Kg - Overview
- Exhibits143: DOG Chemical Products Ltd. and Co. Kg - Product / Service
- Exhibits144: DOG Chemical Products Ltd. and Co. Kg - Key offerings
- Exhibits145: Dorf Ketal Chemicals I Pvt. Ltd. - Overview
- Exhibits146: Dorf Ketal Chemicals I Pvt. Ltd. - Product / Service
- Exhibits147: Dorf Ketal Chemicals I Pvt. Ltd. - Key offerings
- Exhibits148: Dover Chemical Corp. - Overview
- Exhibits149: Dover Chemical Corp. - Product / Service
- Exhibits150: Dover Chemical Corp. - Key offerings
- Exhibits151: Eni SpA - Overview
- Exhibits152: Eni SpA - Business segments
- Exhibits153: Eni SpA - Key news
- Exhibits154: Eni SpA - Key offerings
- Exhibits155: Eni SpA - Segment focus
- Exhibits156: Evonik Industries AG - Overview
- Exhibits157: Evonik Industries AG - Business segments
- Exhibits158: Evonik Industries AG - Key news
- Exhibits159: Evonik Industries AG - Key offerings
- Exhibits160: Evonik Industries AG - Segment focus
- Exhibits161: Infineum International Ltd. - Overview
- Exhibits162: Infineum International Ltd. - Product / Service
- Exhibits163: Infineum International Ltd. - Key offerings
- Exhibits164: Lanxess AG - Overview
- Exhibits165: Lanxess AG - Business segments
- Exhibits166: Lanxess AG - Key news
- Exhibits167: Lanxess AG - Key offerings
- Exhibits168: Lanxess AG - Segment focus
- Exhibits169: Solvay SA - Overview
- Exhibits170: Solvay SA - Business segments
- Exhibits171: Solvay SA - Key news
- Exhibits172: Solvay SA - Key offerings
- Exhibits173: Solvay SA - Segment focus
- Exhibits174: The Lubrizol Corp. - Overview
- Exhibits175: The Lubrizol Corp. - Product / Service
- Exhibits176: The Lubrizol Corp. - Key offerings
- Exhibits177: Wuxi Southern Petroleum Additives Co. Ltd. - Overview
- Exhibits178: Wuxi Southern Petroleum Additives Co. Ltd. - Product / Service
- Exhibits179: Wuxi Southern Petroleum Additives Co. Ltd. - Key offerings
- Exhibits180: Inclusions checklist
- Exhibits181: Exclusions checklist
- Exhibits182: Currency conversion rates for US$
- Exhibits183: Research methodology
- Exhibits184: Information sources
- Exhibits185: Data validation
- Exhibits186: Validation techniques employed for market sizing
- Exhibits187: Data synthesis
- Exhibits188: 360 degree market analysis
- Exhibits189: List of abbreviations
The lubricant anti wear agents market is forecasted to grow by USD 108.6 mn during 2023-2028, accelerating at a CAGR of 2.78% during the forecast period. The report on the lubricant anti wear agents market provides a holistic analysis, market size and forecast, trends, growth drivers, and challenges, as well as vendor analysis covering around 25 vendors.
The report offers an up-to-date analysis regarding the current market scenario, the latest trends and drivers, and the overall market environment. The market is driven by increasing need for reliable machinery and effective maintenance, rising demand for lubricants in developing economies, and increasing demand from end-user industries.
Technavio's lubricant anti wear agents market is segmented as below:
| Market Scope | |
|---|---|
| Base Year | 2024 |
| End Year | 2028 |
| Series Year | 2024-2028 |
| Growth Momentum | Accelerate |
| YOY 2024 | 2.44% |
| CAGR | 2.78% |
| Incremental Value | $108.6mn |
By Channel
- Captive
- Merchant
By Type
- Zinc dialkyl di-thiophosphate
- Phosphate
- Phosphite
- Phosphonate
By Geographical Landscape
- APAC
- Europe
- North America
- Middle East and Africa
- South America
This study identifies the advances in engine oil technology as one of the prime reasons driving the lubricant anti wear agents market growth during the next few years. Also, increasing number of launches of automotive engine oil and growing uptake of thinner engine oil will lead to sizable demand in the market.
The report on the lubricant anti wear agents market covers the following areas:
- Lubricant anti wear agents market sizing
- Lubricant anti wear agents market forecast
- Lubricant anti wear agents market industry analysis
The robust vendor analysis is designed to help clients improve their market position, and in line with this, this report provides a detailed analysis of several leading lubricant anti wear agents market vendors that include Afton Group, AMSOIL Inc., ASL CamGuard, BASF SE, BRB International BV, Chevron Corp., Clariant International Ltd., Croda International Plc, DOG Chemical Products Ltd. and Co. Kg, Dorf Ketal Chemicals I Pvt. Ltd., Dover Chemical Corp., Eni SpA, Evonik Industries AG, Exxon Mobil Corp., Infineum International Ltd., Italmatch Chemicals Spa, Lanxess AG, Solvay SA, The Lubrizol Corp., and Wuxi Southern Petroleum Additives Co. Ltd.. Also, the lubricant anti wear agents market analysis report includes information on upcoming trends and challenges that will influence market growth. This is to help companies strategize and leverage all forthcoming growth opportunities.
The study was conducted using an objective combination of primary and secondary information including inputs from key participants in the industry. The report contains a comprehensive market and vendor landscape in addition to an analysis of the key vendors.
The publisher presents a detailed picture of the market by the way of study, synthesis, and summation of data from multiple sources by an analysis of key parameters such as profit, pricing, competition, and promotions. It presents various market facets by identifying the key industry influencers. The data presented is comprehensive, reliable, and a result of extensive research - both primary and secondary. The market research reports provide a complete competitive landscape and an in-depth vendor selection methodology and analysis using qualitative and quantitative research to forecast the accurate market growth.
Table of Contents
1 Executive Summary
- 1.1 Market overview
- Executive Summary - Chart on Market Overview
- Executive Summary - Data Table on Market Overview
- Executive Summary - Chart on Global Market Characteristics
- Executive Summary - Chart on Market By Geographical Landscape
- Executive Summary - Chart on Market Segmentation by Channel
- Executive Summary - Chart on Market Segmentation by Type
- Executive Summary - Chart on Incremental Growth
- Executive Summary - Data Table on Incremental Growth
- Executive Summary - Chart on Company Market Positioning
2 Market Landscape
- 2.1 Market ecosystem
- Parent Market
- Data Table on - Parent Market
- 2.2 Market characteristics
- Market characteristics analysis
- 2.3 Value chain analysis
- Value Chain Analysis
3 Market Sizing
- 3.1 Market definition
- Offerings of companies included in the market definition
- 3.2 Market segment analysis
- Market segments
- 3.3 Market size 2023
- 3.4 Market outlook: Forecast for 2023-2028
- Chart on Global - Market size and forecast 2023-2028 ($ million)
- Data Table on Global - Market size and forecast 2023-2028 ($ million)
- Chart on Global Market: Year-over-year growth 2023-2028 (%)
- Data Table on Global Market: Year-over-year growth 2023-2028 (%)
4 Historic Market Size
- 4.1 Global Lubricant Anti Wear Agents Market 2018 - 2022
- Historic Market Size - Data Table on Global Lubricant Anti Wear Agents Market 2018 - 2022 ($ million)
- 4.2 Channel segment analysis 2018 - 2022
- Historic Market Size - Channel Segment 2018 - 2022 ($ million)
- 4.3 Type segment analysis 2018 - 2022
- Historic Market Size - Type Segment 2018 - 2022 ($ million)
- 4.4 Geography segment analysis 2018 - 2022
- Historic Market Size - Geography Segment 2018 - 2022 ($ million)
- 4.5 Country segment analysis 2018 - 2022
- Historic Market Size - Country Segment 2018 - 2022 ($ million)
5 Five Forces Analysis
- 5.1 Five forces summary
- Five forces analysis - Comparison between 2023 and 2028
- 5.2 Bargaining power of buyers
- Bargaining power of buyers - Impact of key factors 2023 and 2028
- 5.3 Bargaining power of suppliers
- Bargaining power of suppliers - Impact of key factors in 2023 and 2028
- 5.4 Threat of new entrants
- Threat of new entrants - Impact of key factors in 2023 and 2028
- 5.5 Threat of substitutes
- Threat of substitutes - Impact of key factors in 2023 and 2028
- 5.6 Threat of rivalry
- Threat of rivalry - Impact of key factors in 2023 and 2028
- 5.7 Market condition
- Chart on Market condition - Five forces 2023 and 2028
6 Market Segmentation by Channel
- 6.1 Market segments
- Chart on Channel - Market share 2023-2028 (%)
- Data Table on Channel - Market share 2023-2028 (%)
- 6.2 Comparison by Channel
- Chart on Comparison by Channel
- Data Table on Comparison by Channel
- 6.3 Captive - Market size and forecast 2023-2028
- Chart on Captive - Market size and forecast 2023-2028 ($ million)
- Data Table on Captive - Market size and forecast 2023-2028 ($ million)
- Chart on Captive - Year-over-year growth 2023-2028 (%)
- Data Table on Captive - Year-over-year growth 2023-2028 (%)
- 6.4 Merchant - Market size and forecast 2023-2028
- Chart on Merchant - Market size and forecast 2023-2028 ($ million)
- Data Table on Merchant - Market size and forecast 2023-2028 ($ million)
- Chart on Merchant - Year-over-year growth 2023-2028 (%)
- Data Table on Merchant - Year-over-year growth 2023-2028 (%)
- 6.5 Market opportunity by Channel
- Market opportunity by Channel ($ million)
- Data Table on Market opportunity by Channel ($ million)
7 Market Segmentation by Type
- 7.1 Market segments
- Chart on Type - Market share 2023-2028 (%)
- Data Table on Type - Market share 2023-2028 (%)
- 7.2 Comparison by Type
- Chart on Comparison by Type
- Data Table on Comparison by Type
- 7.3 Zinc dialkyl di-thiophosphate - Market size and forecast 2023-2028
- Chart on Zinc dialkyl di-thiophosphate - Market size and forecast 2023-2028 ($ million)
- Data Table on Zinc dialkyl di-thiophosphate - Market size and forecast 2023-2028 ($ million)
- Chart on Zinc dialkyl di-thiophosphate - Year-over-year growth 2023-2028 (%)
- Data Table on Zinc dialkyl di-thiophosphate - Year-over-year growth 2023-2028 (%)
- 7.4 Phosphate - Market size and forecast 2023-2028
- Chart on Phosphate - Market size and forecast 2023-2028 ($ million)
- Data Table on Phosphate - Market size and forecast 2023-2028 ($ million)
- Chart on Phosphate - Year-over-year growth 2023-2028 (%)
- Data Table on Phosphate - Year-over-year growth 2023-2028 (%)
- 7.5 Phosphite - Market size and forecast 2023-2028
- Chart on Phosphite - Market size and forecast 2023-2028 ($ million)
- Data Table on Phosphite - Market size and forecast 2023-2028 ($ million)
- Chart on Phosphite - Year-over-year growth 2023-2028 (%)
- Data Table on Phosphite - Year-over-year growth 2023-2028 (%)
- 7.6 Phosphonate - Market size and forecast 2023-2028
- Chart on Phosphonate - Market size and forecast 2023-2028 ($ million)
- Data Table on Phosphonate - Market size and forecast 2023-2028 ($ million)
- Chart on Phosphonate - Year-over-year growth 2023-2028 (%)
- Data Table on Phosphonate - Year-over-year growth 2023-2028 (%)
- 7.7 Market opportunity by Type
- Market opportunity by Type ($ million)
- Data Table on Market opportunity by Type ($ million)
8 Customer Landscape
- 8.1 Customer landscape overview
- Analysis of price sensitivity, lifecycle, customer purchase basket, adoption rates, and purchase criteria
9 Geographic Landscape
- 9.1 Geographic segmentation
- Chart on Market share By Geographical Landscape 2023-2028 (%)
- Data Table on Market share By Geographical Landscape 2023-2028 (%)
- 9.2 Geographic comparison
- Chart on Geographic comparison
- Data Table on Geographic comparison
- 9.3 APAC - Market size and forecast 2023-2028
- Chart on APAC - Market size and forecast 2023-2028 ($ million)
- Data Table on APAC - Market size and forecast 2023-2028 ($ million)
- Chart on APAC - Year-over-year growth 2023-2028 (%)
- Data Table on APAC - Year-over-year growth 2023-2028 (%)
- 9.4 Europe - Market size and forecast 2023-2028
- Chart on Europe - Market size and forecast 2023-2028 ($ million)
- Data Table on Europe - Market size and forecast 2023-2028 ($ million)
- Chart on Europe - Year-over-year growth 2023-2028 (%)
- Data Table on Europe - Year-over-year growth 2023-2028 (%)
- 9.5 North America - Market size and forecast 2023-2028
- Chart on North America - Market size and forecast 2023-2028 ($ million)
- Data Table on North America - Market size and forecast 2023-2028 ($ million)
- Chart on North America - Year-over-year growth 2023-2028 (%)
- Data Table on North America - Year-over-year growth 2023-2028 (%)
- 9.6 Middle East and Africa - Market size and forecast 2023-2028
- Chart on Middle East and Africa - Market size and forecast 2023-2028 ($ million)
- Data Table on Middle East and Africa - Market size and forecast 2023-2028 ($ million)
- Chart on Middle East and Africa - Year-over-year growth 2023-2028 (%)
- Data Table on Middle East and Africa - Year-over-year growth 2023-2028 (%)
- 9.7 South America - Market size and forecast 2023-2028
- Chart on South America - Market size and forecast 2023-2028 ($ million)
- Data Table on South America - Market size and forecast 2023-2028 ($ million)
- Chart on South America - Year-over-year growth 2023-2028 (%)
- Data Table on South America - Year-over-year growth 2023-2028 (%)
- 9.8 US - Market size and forecast 2023-2028
- Chart on US - Market size and forecast 2023-2028 ($ million)
- Data Table on US - Market size and forecast 2023-2028 ($ million)
- Chart on US - Year-over-year growth 2023-2028 (%)
- Data Table on US - Year-over-year growth 2023-2028 (%)
- 9.9 Japan - Market size and forecast 2023-2028
- Chart on Japan - Market size and forecast 2023-2028 ($ million)
- Data Table on Japan - Market size and forecast 2023-2028 ($ million)
- Chart on Japan - Year-over-year growth 2023-2028 (%)
- Data Table on Japan - Year-over-year growth 2023-2028 (%)
- 9.10 China - Market size and forecast 2023-2028
- Chart on China - Market size and forecast 2023-2028 ($ million)
- Data Table on China - Market size and forecast 2023-2028 ($ million)
- Chart on China - Year-over-year growth 2023-2028 (%)
- Data Table on China - Year-over-year growth 2023-2028 (%)
- 9.11 Russia - Market size and forecast 2023-2028
- Chart on Russia - Market size and forecast 2023-2028 ($ million)
- Data Table on Russia - Market size and forecast 2023-2028 ($ million)
- Chart on Russia - Year-over-year growth 2023-2028 (%)
- Data Table on Russia - Year-over-year growth 2023-2028 (%)
- 9.12 India - Market size and forecast 2023-2028
- Chart on India - Market size and forecast 2023-2028 ($ million)
- Data Table on India - Market size and forecast 2023-2028 ($ million)
- Chart on India - Year-over-year growth 2023-2028 (%)
- Data Table on India - Year-over-year growth 2023-2028 (%)
- 9.13 Market opportunity By Geographical Landscape
- Market opportunity By Geographical Landscape ($ million)
- Data Tables on Market opportunity By Geographical Landscape ($ million)
10 Drivers, Challenges, and Opportunity/Restraints
- 10.1 Market drivers
- 10.2 Market challenges
- 10.3 Impact of drivers and challenges
- Impact of drivers and challenges in 2023 and 2028
- 10.4 Market opportunities/restraints
11 Competitive Landscape
- 11.1 Overview
- 11.2 Competitive Landscape
- Overview on criticality of inputs and factors of differentiation
- 11.3 Landscape disruption
- Overview on factors of disruption
- 11.4 Industry risks
- Impact of key risks on business
12 Competitive Analysis
- 12.1 Companies profiled
- Companies covered
- 12.2 Market positioning of companies
- Matrix on companies position and classification
- 12.3 Afton Group
- Afton Group - Overview
- Afton Group - Product / Service
- Afton Group - Key offerings
- 12.4 BASF SE
- BASF SE - Overview
- BASF SE - Business segments
- BASF SE - Key news
- BASF SE - Key offerings
- BASF SE - Segment focus
- 12.5 BRB International BV
- BRB International BV - Overview
- BRB International BV - Product / Service
- BRB International BV - Key offerings
- 12.6 Chevron Corp.
- Chevron Corp. - Overview
- Chevron Corp. - Business segments
- Chevron Corp. - Key news
- Chevron Corp. - Key offerings
- Chevron Corp. - Segment focus
- 12.7 Croda International Plc
- Croda International Plc - Overview
- Croda International Plc - Business segments
- Croda International Plc - Key news
- Croda International Plc - Key offerings
- Croda International Plc - Segment focus
- 12.8 DOG Chemical Products Ltd. and Co. Kg
- DOG Chemical Products Ltd. and Co. Kg - Overview
- DOG Chemical Products Ltd. and Co. Kg - Product / Service
- DOG Chemical Products Ltd. and Co. Kg - Key offerings
- 12.9 Dorf Ketal Chemicals I Pvt. Ltd.
- Dorf Ketal Chemicals I Pvt. Ltd. - Overview
- Dorf Ketal Chemicals I Pvt. Ltd. - Product / Service
- Dorf Ketal Chemicals I Pvt. Ltd. - Key offerings
- 12.10 Dover Chemical Corp.
- Dover Chemical Corp. - Overview
- Dover Chemical Corp. - Product / Service
- Dover Chemical Corp. - Key offerings
- 12.11 Eni SpA
- Eni SpA - Overview
- Eni SpA - Business segments
- Eni SpA - Key news
- Eni SpA - Key offerings
- Eni SpA - Segment focus
- 12.12 Evonik Industries AG
- Evonik Industries AG - Overview
- Evonik Industries AG - Business segments
- Evonik Industries AG - Key news
- Evonik Industries AG - Key offerings
- Evonik Industries AG - Segment focus
- 12.13 Infineum International Ltd.
- Infineum International Ltd. - Overview
- Infineum International Ltd. - Product / Service
- Infineum International Ltd. - Key offerings
- 12.14 Lanxess AG
- Lanxess AG - Overview
- Lanxess AG - Business segments
- Lanxess AG - Key news
- Lanxess AG - Key offerings
- Lanxess AG - Segment focus
- 12.15 Solvay SA
- Solvay SA - Overview
- Solvay SA - Business segments
- Solvay SA - Key news
- Solvay SA - Key offerings
- Solvay SA - Segment focus
- 12.16 The Lubrizol Corp.
- The Lubrizol Corp. - Overview
- The Lubrizol Corp. - Product / Service
- The Lubrizol Corp. - Key offerings
- 12.17 Wuxi Southern Petroleum Additives Co. Ltd.
- Wuxi Southern Petroleum Additives Co. Ltd. - Overview
- Wuxi Southern Petroleum Additives Co. Ltd. - Product / Service
- Wuxi Southern Petroleum Additives Co. Ltd. - Key offerings
13 Appendix
- 13.1 Scope of the report
- 13.2 Inclusions and exclusions checklist
- Inclusions checklist
- Exclusions checklist
- 13.3 Currency conversion rates for US$
- Currency conversion rates for US$
- 13.4 Research methodology
- Research methodology
- 13.5 Data procurement
- Information sources
- 13.6 Data validation
- Data validation
- 13.7 Validation techniques employed for market sizing
- Validation techniques employed for market sizing
- 13.8 Data synthesis
- Data synthesis
- 360 degree market analysis
- 360 degree market analysis
- 13.10 List of abbreviations
- List of abbreviations
