|
|
市場調査レポート
商品コード
1762866
メタノールの世界市場 2025~2029年Global Methanol Market 2025-2029 |
||||||

|
|||||||
カスタマイズ可能
|
|||||||


| メタノールの世界市場 2025~2029年 |
|
出版日: 2025年06月26日
発行: TechNavio
ページ情報: 英文 237 Pages
納期: 即納可能
|

全表示
- 概要
- 図表
- 目次
メタノール市場は2024~2029年に68億3,210万米ドル、予測期間中のCAGRは3.5%で成長すると予測されます。
当レポートでは、メタノール市場の全体的な分析、市場規模・予測、動向、成長促進要因、課題、約25のベンダーを網羅したベンダー分析などを掲載しています。
現在の市場シナリオ、最新動向と促進要因、市場環境全体に関する最新分析を提供しています。市場は、ホルムアルデヒドとその誘導体の需要増加、様々な技術の採用増加、アジア太平洋地域における化学品需要の増加によって牽引されています。
| 市場範囲 | |
|---|---|
| 基準年 | 2025年 |
| 終了年 | 2029年 |
| 予測期間 | 2025~2029年 |
| 成長モメンタム | 加速 |
| 前年比 | 3.2% |
| CAGR | 3.5% |
| 増分額 | 68億3,210万米ドル |
本調査は、業界の主要参加者からのインプットを含め、一次情報と二次情報を客観的に組み合わせて実施しました。レポートには、主要企業の分析に加え、包括的な市場規模データ、地域別分析によるセグメント、ベンダー情勢が含まれています。レポートには過去データと予測データがあります。
本調査では、化学産業におけるメタノールの需要増加が、今後数年間のメタノール市場の成長を促進する主要な理由の1つであると特定しています。また、燃料としてのメタノールの需要の増加やメタノール生産における技術の進歩も、市場の大きな需要につながると思われます。
目次
第1章 エグゼクティブサマリー
- 市場概要
第2章 Technavio分析
- 価格・ライフサイクル・顧客購入バスケット・採用率・購入基準の分析
- インプットの重要性と差別化の要因
- 混乱の要因
- 促進要因と課題の影響
第3章 市場情勢
- 市場エコシステム
- 市場の特徴
- バリューチェーン分析
第4章 市場規模
- 市場の定義
- 市場セグメント分析
- 市場規模 2024年
- 市場の見通し 2024~2029年
第5章 市場規模実績
- メタノールの世界市場 2019~2023年
- デリバティブタイプ別セグメント分析 2019~2023年
- エンドユーザー別セグメント分析 2019~2023年
- 原料別セグメント分析 2019~2023年
- 地域別セグメント分析 2019~2023年
- 国別セグメント分析 2019~2023年
第6章 定性分析
- AIの影響メタノールの世界市場
第7章 ファイブフォース分析
- ファイブフォースの要約
- 買い手の交渉力
- 供給企業の交渉力
- 新規参入業者の脅威
- 代替品の脅威
- 競争の脅威
- 市況
第8章 市場セグメンテーション:デリバティブタイプ別
- 市場セグメント
- 比較:デリバティブタイプ別
- ホルムアルデヒド:市場規模と予測 2024~2029年
- ガソリン:市場規模と予測 2024~2029年
- 酢酸:市場規模と予測 2024~2029年
- DME:市場規模と予測 2024~2029年
- その他:市場規模と予測 2024~2029年
- 市場機会:デリバティブタイプ別
第9章 市場セグメンテーション:エンドユーザー別
- 市場セグメント
- 比較:エンドユーザー別
- 自動車:市場規模と予測 2024~2029年
- 工事:市場規模と予測 2024~2029年
- 塗料とコーティング:市場規模と予測 2024~2029年
- エレクトロニクス:市場規模と予測 2024~2029年
- その他:市場規模と予測 2024~2029年
- 市場機会:エンドユーザー別
第10章 市場セグメンテーション:原料別
- 市場セグメント
- 比較:原料別
- 天然ガス:市場規模と予測 2024~2029年
- 石炭:市場規模と予測 2024~2029年
- 市場機会:原料別
第11章 顧客情勢
- 顧客情勢の概要
第12章 地域別情勢
- 地域別セグメンテーション
- 地域別比較
- アジア太平洋:市場規模と予測 2024~2029年
- 欧州:市場規模と予測 2024~2029年
- 北米:市場規模と予測 2024~2029年
- 中東・アフリカ:市場規模と予測 2024~2029年
- 南米:市場規模と予測 2024~2029年
- 中国:市場規模と予測 2024~2029年
- 米国:市場規模と予測 2024~2029年
- インド:市場規模と予測 2024~2029年
- インドネシア:市場規模と予測 2024~2029年
- ロシア:市場規模と予測 2024~2029年
- サウジアラビア:市場規模と予測 2024~2029年
- ドイツ:市場規模と予測 2024~2029年
- イラン:市場規模と予測 2024~2029年
- オマーン:市場規模と予測 2024~2029年
- カナダ:市場規模と予測 2024~2029年
- 市場機会:地域情勢別
第13章 促進要因・課題・機会・抑制要因
- 市場促進要因
- 市場の課題
- 促進要因と課題の影響
- 市場の機会・抑制要因
第14章 競合情勢
- 概要
- 競合情勢
- 混乱の状況
- 業界のリスク
第15章 競合分析
- 企業プロファイル
- 企業ランキング指数
- 企業の市場ポジショニング
- BASF SE
- Celanese Corp.
- Coogee
- ENERKEM Inc.
- Eni SpA
- GNFC Ltd.
- INEOS Group Holdings S.A.
- LyondellBasell Industries NV
- Methanex Corp.
- Mitsubishi Gas Chemical Co. Inc.
- Mitsui and Co. Ltd.
- OCI NV
- PETRONAS Chemicals Group Berhad
- Proman GmbH
- Thermo Fisher Scientific Inc.
第16章 付録
Exhibits:
- Exhibits1: Executive Summary - Chart on Market Overview
- Exhibits2: Executive Summary - Data Table on Market Overview
- Exhibits3: Executive Summary - Chart on Global Market Characteristics
- Exhibits4: Executive Summary - Chart on Market By Geographical Landscape
- Exhibits5: Executive Summary - Chart on Market Segmentation by Derivative Type
- Exhibits6: Executive Summary - Chart on Market Segmentation by End-user
- Exhibits7: Executive Summary - Chart on Market Segmentation by Feedstock
- Exhibits8: Executive Summary - Chart on Incremental Growth
- Exhibits9: Executive Summary - Data Table on Incremental Growth
- Exhibits10: Executive Summary - Chart on Company Market Positioning
- Exhibits11: Analysis of price sensitivity, lifecycle, customer purchase basket, adoption rates, and purchase criteria
- Exhibits12: Overview on criticality of inputs and factors of differentiation
- Exhibits13: Overview on factors of disruption
- Exhibits14: Impact of drivers and challenges in 2024 and 2029
- Exhibits15: Parent Market
- Exhibits16: Data Table on - Parent Market
- Exhibits17: Market characteristics analysis
- Exhibits18: Value chain analysis
- Exhibits19: Offerings of companies included in the market definition
- Exhibits20: Market segments
- Exhibits21: Chart on Global - Market size and forecast 2024-2029 ($ million)
- Exhibits22: Data Table on Global - Market size and forecast 2024-2029 ($ million)
- Exhibits23: Chart on Global Market: Year-over-year growth 2024-2029 (%)
- Exhibits24: Data Table on Global Market: Year-over-year growth 2024-2029 (%)
- Exhibits25: Historic Market Size - Data Table on Global Methanol Market 2019 - 2023 ($ million)
- Exhibits26: Historic Market Size - Derivative Type Segment 2019 - 2023 ($ million)
- Exhibits27: Historic Market Size - End-user Segment 2019 - 2023 ($ million)
- Exhibits28: Historic Market Size - Feedstock Segment 2019 - 2023 ($ million)
- Exhibits29: Historic Market Size - Geography Segment 2019 - 2023 ($ million)
- Exhibits30: Historic Market Size - Country Segment 2019 - 2023 ($ million)
- Exhibits31: Five forces analysis - Comparison between 2024 and 2029
- Exhibits32: Bargaining power of buyers - Impact of key factors 2024 and 2029
- Exhibits33: Bargaining power of suppliers - Impact of key factors in 2024 and 2029
- Exhibits34: Threat of new entrants - Impact of key factors in 2024 and 2029
- Exhibits35: Threat of substitutes - Impact of key factors in 2024 and 2029
- Exhibits36: Threat of rivalry - Impact of key factors in 2024 and 2029
- Exhibits37: Chart on Market condition - Five forces 2024 and 2029
- Exhibits38: Chart on Derivative Type - Market share 2024-2029 (%)
- Exhibits39: Data Table on Derivative Type - Market share 2024-2029 (%)
- Exhibits40: Chart on Comparison by Derivative Type
- Exhibits41: Data Table on Comparison by Derivative Type
- Exhibits42: Chart on Formaldehyde - Market size and forecast 2024-2029 ($ million)
- Exhibits43: Data Table on Formaldehyde - Market size and forecast 2024-2029 ($ million)
- Exhibits44: Chart on Formaldehyde - Year-over-year growth 2024-2029 (%)
- Exhibits45: Data Table on Formaldehyde - Year-over-year growth 2024-2029 (%)
- Exhibits46: Chart on Gasoline - Market size and forecast 2024-2029 ($ million)
- Exhibits47: Data Table on Gasoline - Market size and forecast 2024-2029 ($ million)
- Exhibits48: Chart on Gasoline - Year-over-year growth 2024-2029 (%)
- Exhibits49: Data Table on Gasoline - Year-over-year growth 2024-2029 (%)
- Exhibits50: Chart on Acetic acid - Market size and forecast 2024-2029 ($ million)
- Exhibits51: Data Table on Acetic acid - Market size and forecast 2024-2029 ($ million)
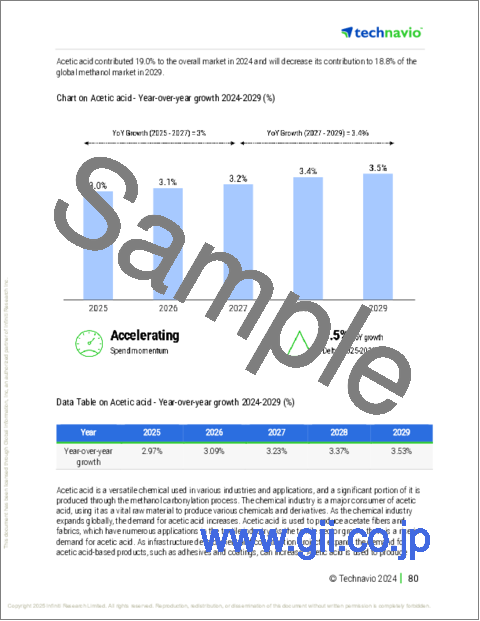
- Exhibits52: Chart on Acetic acid - Year-over-year growth 2024-2029 (%)
- Exhibits53: Data Table on Acetic acid - Year-over-year growth 2024-2029 (%)
- Exhibits54: Chart on DME - Market size and forecast 2024-2029 ($ million)
- Exhibits55: Data Table on DME - Market size and forecast 2024-2029 ($ million)
- Exhibits56: Chart on DME - Year-over-year growth 2024-2029 (%)
- Exhibits57: Data Table on DME - Year-over-year growth 2024-2029 (%)
- Exhibits58: Chart on Others - Market size and forecast 2024-2029 ($ million)
- Exhibits59: Data Table on Others - Market size and forecast 2024-2029 ($ million)
- Exhibits60: Chart on Others - Year-over-year growth 2024-2029 (%)
- Exhibits61: Data Table on Others - Year-over-year growth 2024-2029 (%)
- Exhibits62: Market opportunity by Derivative Type ($ million)
- Exhibits63: Data Table on Market opportunity by Derivative Type ($ million)
- Exhibits64: Chart on End-user - Market share 2024-2029 (%)
- Exhibits65: Data Table on End-user - Market share 2024-2029 (%)
- Exhibits66: Chart on Comparison by End-user
- Exhibits67: Data Table on Comparison by End-user
- Exhibits68: Chart on Automotive - Market size and forecast 2024-2029 ($ million)
- Exhibits69: Data Table on Automotive - Market size and forecast 2024-2029 ($ million)
- Exhibits70: Chart on Automotive - Year-over-year growth 2024-2029 (%)
- Exhibits71: Data Table on Automotive - Year-over-year growth 2024-2029 (%)
- Exhibits72: Chart on Construction - Market size and forecast 2024-2029 ($ million)
- Exhibits73: Data Table on Construction - Market size and forecast 2024-2029 ($ million)
- Exhibits74: Chart on Construction - Year-over-year growth 2024-2029 (%)
- Exhibits75: Data Table on Construction - Year-over-year growth 2024-2029 (%)
- Exhibits76: Chart on Paints and coatings - Market size and forecast 2024-2029 ($ million)
- Exhibits77: Data Table on Paints and coatings - Market size and forecast 2024-2029 ($ million)
- Exhibits78: Chart on Paints and coatings - Year-over-year growth 2024-2029 (%)
- Exhibits79: Data Table on Paints and coatings - Year-over-year growth 2024-2029 (%)
- Exhibits80: Chart on Electronics - Market size and forecast 2024-2029 ($ million)
- Exhibits81: Data Table on Electronics - Market size and forecast 2024-2029 ($ million)
- Exhibits82: Chart on Electronics - Year-over-year growth 2024-2029 (%)
- Exhibits83: Data Table on Electronics - Year-over-year growth 2024-2029 (%)
- Exhibits84: Chart on Others - Market size and forecast 2024-2029 ($ million)
- Exhibits85: Data Table on Others - Market size and forecast 2024-2029 ($ million)
- Exhibits86: Chart on Others - Year-over-year growth 2024-2029 (%)
- Exhibits87: Data Table on Others - Year-over-year growth 2024-2029 (%)
- Exhibits88: Market opportunity by End-user ($ million)
- Exhibits89: Data Table on Market opportunity by End-user ($ million)
- Exhibits90: Chart on Feedstock - Market share 2024-2029 (%)
- Exhibits91: Data Table on Feedstock - Market share 2024-2029 (%)
- Exhibits92: Chart on Comparison by Feedstock
- Exhibits93: Data Table on Comparison by Feedstock
- Exhibits94: Chart on Natural gas - Market size and forecast 2024-2029 ($ million)
- Exhibits95: Data Table on Natural gas - Market size and forecast 2024-2029 ($ million)
- Exhibits96: Chart on Natural gas - Year-over-year growth 2024-2029 (%)
- Exhibits97: Data Table on Natural gas - Year-over-year growth 2024-2029 (%)
- Exhibits98: Chart on Coal - Market size and forecast 2024-2029 ($ million)
- Exhibits99: Data Table on Coal - Market size and forecast 2024-2029 ($ million)
- Exhibits100: Chart on Coal - Year-over-year growth 2024-2029 (%)
- Exhibits101: Data Table on Coal - Year-over-year growth 2024-2029 (%)
- Exhibits102: Market opportunity by Feedstock ($ million)
- Exhibits103: Data Table on Market opportunity by Feedstock ($ million)
- Exhibits104: Analysis of price sensitivity, lifecycle, customer purchase basket, adoption rates, and purchase criteria
- Exhibits105: Chart on Market share By Geographical Landscape 2024-2029 (%)
- Exhibits106: Data Table on Market share By Geographical Landscape 2024-2029 (%)
- Exhibits107: Chart on Geographic comparison
- Exhibits108: Data Table on Geographic comparison
- Exhibits109: Chart on APAC - Market size and forecast 2024-2029 ($ million)
- Exhibits110: Data Table on APAC - Market size and forecast 2024-2029 ($ million)
- Exhibits111: Chart on APAC - Year-over-year growth 2024-2029 (%)
- Exhibits112: Data Table on APAC - Year-over-year growth 2024-2029 (%)
- Exhibits113: Chart on Europe - Market size and forecast 2024-2029 ($ million)
- Exhibits114: Data Table on Europe - Market size and forecast 2024-2029 ($ million)
- Exhibits115: Chart on Europe - Year-over-year growth 2024-2029 (%)
- Exhibits116: Data Table on Europe - Year-over-year growth 2024-2029 (%)
- Exhibits117: Chart on North America - Market size and forecast 2024-2029 ($ million)
- Exhibits118: Data Table on North America - Market size and forecast 2024-2029 ($ million)
- Exhibits119: Chart on North America - Year-over-year growth 2024-2029 (%)
- Exhibits120: Data Table on North America - Year-over-year growth 2024-2029 (%)
- Exhibits121: Chart on Middle East and Africa - Market size and forecast 2024-2029 ($ million)
- Exhibits122: Data Table on Middle East and Africa - Market size and forecast 2024-2029 ($ million)
- Exhibits123: Chart on Middle East and Africa - Year-over-year growth 2024-2029 (%)
- Exhibits124: Data Table on Middle East and Africa - Year-over-year growth 2024-2029 (%)
- Exhibits125: Chart on South America - Market size and forecast 2024-2029 ($ million)
- Exhibits126: Data Table on South America - Market size and forecast 2024-2029 ($ million)
- Exhibits127: Chart on South America - Year-over-year growth 2024-2029 (%)
- Exhibits128: Data Table on South America - Year-over-year growth 2024-2029 (%)
- Exhibits129: Chart on China - Market size and forecast 2024-2029 ($ million)
- Exhibits130: Data Table on China - Market size and forecast 2024-2029 ($ million)
- Exhibits131: Chart on China - Year-over-year growth 2024-2029 (%)
- Exhibits132: Data Table on China - Year-over-year growth 2024-2029 (%)
- Exhibits133: Chart on US - Market size and forecast 2024-2029 ($ million)
- Exhibits134: Data Table on US - Market size and forecast 2024-2029 ($ million)
- Exhibits135: Chart on US - Year-over-year growth 2024-2029 (%)
- Exhibits136: Data Table on US - Year-over-year growth 2024-2029 (%)
- Exhibits137: Chart on India - Market size and forecast 2024-2029 ($ million)
- Exhibits138: Data Table on India - Market size and forecast 2024-2029 ($ million)
- Exhibits139: Chart on India - Year-over-year growth 2024-2029 (%)
- Exhibits140: Data Table on India - Year-over-year growth 2024-2029 (%)
- Exhibits141: Chart on Indonesia - Market size and forecast 2024-2029 ($ million)
- Exhibits142: Data Table on Indonesia - Market size and forecast 2024-2029 ($ million)
- Exhibits143: Chart on Indonesia - Year-over-year growth 2024-2029 (%)
- Exhibits144: Data Table on Indonesia - Year-over-year growth 2024-2029 (%)
- Exhibits145: Chart on Russia - Market size and forecast 2024-2029 ($ million)
- Exhibits146: Data Table on Russia - Market size and forecast 2024-2029 ($ million)
- Exhibits147: Chart on Russia - Year-over-year growth 2024-2029 (%)
- Exhibits148: Data Table on Russia - Year-over-year growth 2024-2029 (%)
- Exhibits149: Chart on Saudi Arabia - Market size and forecast 2024-2029 ($ million)
- Exhibits150: Data Table on Saudi Arabia - Market size and forecast 2024-2029 ($ million)
- Exhibits151: Chart on Saudi Arabia - Year-over-year growth 2024-2029 (%)
- Exhibits152: Data Table on Saudi Arabia - Year-over-year growth 2024-2029 (%)
- Exhibits153: Chart on Germany - Market size and forecast 2024-2029 ($ million)
- Exhibits154: Data Table on Germany - Market size and forecast 2024-2029 ($ million)
- Exhibits155: Chart on Germany - Year-over-year growth 2024-2029 (%)
- Exhibits156: Data Table on Germany - Year-over-year growth 2024-2029 (%)
- Exhibits157: Chart on Iran - Market size and forecast 2024-2029 ($ million)
- Exhibits158: Data Table on Iran - Market size and forecast 2024-2029 ($ million)
- Exhibits159: Chart on Iran - Year-over-year growth 2024-2029 (%)
- Exhibits160: Data Table on Iran - Year-over-year growth 2024-2029 (%)
- Exhibits161: Chart on Oman - Market size and forecast 2024-2029 ($ million)
- Exhibits162: Data Table on Oman - Market size and forecast 2024-2029 ($ million)
- Exhibits163: Chart on Oman - Year-over-year growth 2024-2029 (%)
- Exhibits164: Data Table on Oman - Year-over-year growth 2024-2029 (%)
- Exhibits165: Chart on Canada - Market size and forecast 2024-2029 ($ million)
- Exhibits166: Data Table on Canada - Market size and forecast 2024-2029 ($ million)
- Exhibits167: Chart on Canada - Year-over-year growth 2024-2029 (%)
- Exhibits168: Data Table on Canada - Year-over-year growth 2024-2029 (%)
- Exhibits169: Market opportunity By Geographical Landscape ($ million)
- Exhibits170: Data Tables on Market opportunity By Geographical Landscape ($ million)
- Exhibits171: Impact of drivers and challenges in 2024 and 2029
- Exhibits172: Overview on criticality of inputs and factors of differentiation
- Exhibits173: Overview on factors of disruption
- Exhibits174: Impact of key risks on business
- Exhibits175: Companies covered
- Exhibits176: Company ranking index
- Exhibits177: Matrix on companies position and classification
- Exhibits178: BASF SE - Overview
- Exhibits179: BASF SE - Business segments
- Exhibits180: BASF SE - Key news
- Exhibits181: BASF SE - Key offerings
- Exhibits182: BASF SE - Segment focus
- Exhibits183: SWOT
- Exhibits184: Celanese Corp. - Overview
- Exhibits185: Celanese Corp. - Business segments
- Exhibits186: Celanese Corp. - Key news
- Exhibits187: Celanese Corp. - Key offerings
- Exhibits188: Celanese Corp. - Segment focus
- Exhibits189: SWOT
- Exhibits190: Coogee - Overview
- Exhibits191: Coogee - Product / Service
- Exhibits192: Coogee - Key offerings
- Exhibits193: SWOT
- Exhibits194: ENERKEM Inc. - Overview
- Exhibits195: ENERKEM Inc. - Product / Service
- Exhibits196: ENERKEM Inc. - Key offerings
- Exhibits197: SWOT
- Exhibits198: Eni SpA - Overview
- Exhibits199: Eni SpA - Business segments
- Exhibits200: Eni SpA - Key news
- Exhibits201: Eni SpA - Key offerings
- Exhibits202: Eni SpA - Segment focus
- Exhibits203: SWOT
- Exhibits204: GNFC Ltd. - Overview
- Exhibits205: GNFC Ltd. - Business segments
- Exhibits206: GNFC Ltd. - Key offerings
- Exhibits207: GNFC Ltd. - Segment focus
- Exhibits208: SWOT
- Exhibits209: INEOS Group Holdings S.A. - Overview
- Exhibits210: INEOS Group Holdings S.A. - Product / Service
- Exhibits211: INEOS Group Holdings S.A. - Key news
- Exhibits212: INEOS Group Holdings S.A. - Key offerings
- Exhibits213: SWOT
- Exhibits214: LyondellBasell Industries NV - Overview
- Exhibits215: LyondellBasell Industries NV - Business segments
- Exhibits216: LyondellBasell Industries NV - Key news
- Exhibits217: LyondellBasell Industries NV - Key offerings
- Exhibits218: LyondellBasell Industries NV - Segment focus
- Exhibits219: SWOT
- Exhibits220: Methanex Corp. - Overview
- Exhibits221: Methanex Corp. - Product / Service
- Exhibits222: Methanex Corp. - Key offerings
- Exhibits223: SWOT
- Exhibits224: Mitsubishi Gas Chemical Co. Inc. - Overview
- Exhibits225: Mitsubishi Gas Chemical Co. Inc. - Business segments
- Exhibits226: Mitsubishi Gas Chemical Co. Inc. - Key news
- Exhibits227: Mitsubishi Gas Chemical Co. Inc. - Key offerings
- Exhibits228: Mitsubishi Gas Chemical Co. Inc. - Segment focus
- Exhibits229: SWOT
- Exhibits230: Mitsui and Co. Ltd. - Overview
- Exhibits231: Mitsui and Co. Ltd. - Business segments
- Exhibits232: Mitsui and Co. Ltd. - Key news
- Exhibits233: Mitsui and Co. Ltd. - Key offerings
- Exhibits234: Mitsui and Co. Ltd. - Segment focus
- Exhibits235: SWOT
- Exhibits236: OCI NV - Overview
- Exhibits237: OCI NV - Business segments
- Exhibits238: OCI NV - Key offerings
- Exhibits239: OCI NV - Segment focus
- Exhibits240: SWOT
- Exhibits241: PETRONAS Chemicals Group Berhad - Overview
- Exhibits242: PETRONAS Chemicals Group Berhad - Business segments
- Exhibits243: PETRONAS Chemicals Group Berhad - Key offerings
- Exhibits244: PETRONAS Chemicals Group Berhad - Segment focus
- Exhibits245: SWOT
- Exhibits246: Proman GmbH - Overview
- Exhibits247: Proman GmbH - Product / Service
- Exhibits248: Proman GmbH - Key offerings
- Exhibits249: SWOT
- Exhibits250: Thermo Fisher Scientific Inc. - Overview
- Exhibits251: Thermo Fisher Scientific Inc. - Business segments
- Exhibits252: Thermo Fisher Scientific Inc. - Key news
- Exhibits253: Thermo Fisher Scientific Inc. - Key offerings
- Exhibits254: Thermo Fisher Scientific Inc. - Segment focus
- Exhibits255: SWOT
- Exhibits256: Inclusions checklist
- Exhibits257: Exclusions checklist
- Exhibits258: Currency conversion rates for US$
- Exhibits259: Research methodology
- Exhibits260: Information sources
- Exhibits261: Data validation
- Exhibits262: Validation techniques employed for market sizing
- Exhibits263: Data synthesis
- Exhibits264: 360 degree market analysis
- Exhibits265: List of abbreviations
The methanol market is forecasted to grow by USD 6,832.1 mn during 2024-2029, accelerating at a CAGR of 3.5% during the forecast period. The report on the methanol market provides a holistic analysis, market size and forecast, trends, growth drivers, and challenges, as well as vendor analysis covering around 25 vendors.
The report offers an up-to-date analysis regarding the current market scenario, the latest trends and drivers, and the overall market environment. The market is driven by rising demand for formaldehyde and its derivatives, increasing adoption of various technology, and increasing demand for chemicals in apac.
| Market Scope | |
|---|---|
| Base Year | 2025 |
| End Year | 2029 |
| Series Year | 2025-2029 |
| Growth Momentum | Accelerate |
| YOY 2025 | 3.2% |
| CAGR | 3.5% |
| Incremental Value | $6,832.1 mn |
The study was conducted using an objective combination of primary and secondary information including inputs from key participants in the industry. The report contains a comprehensive market size data, segment with regional analysis and vendor landscape in addition to an analysis of the key companies. Reports have historic and forecast data.
Technavio's methanol market is segmented as below:
By Derivative Type
- Formaldehyde
- Gasoline
- Acetic acid
- DME
- Others
By End-user
- Automotive
- Construction
- Paints and coatings
- Electronics
- Others
By Feedstock
- Natural gas
- Coal
By Geographical Landscape
- APAC
- Europe
- North America
- Middle East and Africa
- South America
This study identifies the increasing demand for methanol in chemical industry as one of the prime reasons driving the methanol market growth during the next few years. Also, growing demand for methanol as fuel and technological advancements in methanol production will lead to sizable demand in the market.
The report on the methanol market covers the following areas:
- Methanol Market sizing
- Methanol Market forecast
- Methanol Market industry analysis
The robust vendor analysis is designed to help clients improve their market position, and in line with this, this report provides a detailed analysis of several leading methanol market vendors that include BASF SE, Celanese Corp., Coogee, ENERKEM Inc., Eni SpA, GNFC Ltd., INEOS Group Holdings S.A., LyondellBasell Industries NV, Methanex Corp., Mitsubishi Gas Chemical Co. Inc., Mitsui and Co. Ltd., Oberon Fuels Inc., OCI NV, PETRONAS Chemicals Group Berhad, Proman GmbH, Saudi Arabian Oil Co., Simalin Chemical Industries Pvt. Ltd., Thermo Fisher Scientific Inc., and Zagros Petrochemical Co.. Also, the methanol market analysis report includes information on upcoming trends and challenges that will influence market growth. This is to help companies strategize and leverage all forthcoming growth opportunities.
The publisher presents a detailed picture of the market by the way of study, synthesis, and summation of data from multiple sources by an analysis of key parameters such as profit, pricing, competition, and promotions. It presents various market facets by identifying the key industry influencers. The data presented is comprehensive, reliable, and a result of extensive primary and secondary research. The market research reports provide a complete competitive landscape and an in-depth vendor selection methodology and analysis using qualitative and quantitative research to forecast accurate market growth.
Table of Contents
1 Executive Summary
- 1.1 Market overview
- Executive Summary - Chart on Market Overview
- Executive Summary - Data Table on Market Overview
- Executive Summary - Chart on Global Market Characteristics
- Executive Summary - Chart on Market By Geographical Landscape
- Executive Summary - Chart on Market Segmentation by Derivative Type
- Executive Summary - Chart on Market Segmentation by End-user
- Executive Summary - Chart on Market Segmentation by Feedstock
- Executive Summary - Chart on Incremental Growth
- Executive Summary - Data Table on Incremental Growth
- Executive Summary - Chart on Company Market Positioning
2 Technavio Analysis
- 2.1 Analysis of price sensitivity, lifecycle, customer purchase basket, adoption rates, and purchase criteria
- Analysis of price sensitivity, lifecycle, customer purchase basket, adoption rates, and purchase criteria
- 2.2 Criticality of inputs and Factors of differentiation
- Overview on criticality of inputs and factors of differentiation
- 2.3 Factors of disruption
- Overview on factors of disruption
- 2.4 Impact of drivers and challenges
- Impact of drivers and challenges in 2024 and 2029
3 Market Landscape
- 3.1 Market ecosystem
- Parent Market
- Data Table on - Parent Market
- 3.2 Market characteristics
- Market characteristics analysis
- 3.3 Value chain analysis
- Value chain analysis
4 Market Sizing
- 4.1 Market definition
- Offerings of companies included in the market definition
- 4.2 Market segment analysis
- Market segments
- 4.3 Market size 2024
- 4.4 Market outlook: Forecast for 2024-2029
- Chart on Global - Market size and forecast 2024-2029 ($ million)
- Data Table on Global - Market size and forecast 2024-2029 ($ million)
- Chart on Global Market: Year-over-year growth 2024-2029 (%)
- Data Table on Global Market: Year-over-year growth 2024-2029 (%)
5 Historic Market Size
- 5.1 Global Methanol Market 2019 - 2023
- Historic Market Size - Data Table on Global Methanol Market 2019 - 2023 ($ million)
- 5.2 Derivative Type segment analysis 2019 - 2023
- Historic Market Size - Derivative Type Segment 2019 - 2023 ($ million)
- 5.3 End-user segment analysis 2019 - 2023
- Historic Market Size - End-user Segment 2019 - 2023 ($ million)
- 5.4 Feedstock segment analysis 2019 - 2023
- Historic Market Size - Feedstock Segment 2019 - 2023 ($ million)
- 5.5 Geography segment analysis 2019 - 2023
- Historic Market Size - Geography Segment 2019 - 2023 ($ million)
- 5.6 Country segment analysis 2019 - 2023
- Historic Market Size - Country Segment 2019 - 2023 ($ million)
6 Qualitative Analysis
- 6.1 Impact of AI in the Global Methanol Market
7 Five Forces Analysis
- 7.1 Five forces summary
- Five forces analysis - Comparison between 2024 and 2029
- 7.2 Bargaining power of buyers
- Bargaining power of buyers - Impact of key factors 2024 and 2029
- 7.3 Bargaining power of suppliers
- Bargaining power of suppliers - Impact of key factors in 2024 and 2029
- 7.4 Threat of new entrants
- Threat of new entrants - Impact of key factors in 2024 and 2029
- 7.5 Threat of substitutes
- Threat of substitutes - Impact of key factors in 2024 and 2029
- 7.6 Threat of rivalry
- Threat of rivalry - Impact of key factors in 2024 and 2029
- 7.7 Market condition
- Chart on Market condition - Five forces 2024 and 2029
8 Market Segmentation by Derivative Type
- 8.1 Market segments
- Chart on Derivative Type - Market share 2024-2029 (%)
- Data Table on Derivative Type - Market share 2024-2029 (%)
- 8.2 Comparison by Derivative Type
- Chart on Comparison by Derivative Type
- Data Table on Comparison by Derivative Type
- 8.3 Formaldehyde - Market size and forecast 2024-2029
- Chart on Formaldehyde - Market size and forecast 2024-2029 ($ million)
- Data Table on Formaldehyde - Market size and forecast 2024-2029 ($ million)
- Chart on Formaldehyde - Year-over-year growth 2024-2029 (%)
- Data Table on Formaldehyde - Year-over-year growth 2024-2029 (%)
- 8.4 Gasoline - Market size and forecast 2024-2029
- Chart on Gasoline - Market size and forecast 2024-2029 ($ million)
- Data Table on Gasoline - Market size and forecast 2024-2029 ($ million)
- Chart on Gasoline - Year-over-year growth 2024-2029 (%)
- Data Table on Gasoline - Year-over-year growth 2024-2029 (%)
- 8.5 Acetic acid - Market size and forecast 2024-2029
- Chart on Acetic acid - Market size and forecast 2024-2029 ($ million)
- Data Table on Acetic acid - Market size and forecast 2024-2029 ($ million)
- Chart on Acetic acid - Year-over-year growth 2024-2029 (%)
- Data Table on Acetic acid - Year-over-year growth 2024-2029 (%)
- 8.6 DME - Market size and forecast 2024-2029
- Chart on DME - Market size and forecast 2024-2029 ($ million)
- Data Table on DME - Market size and forecast 2024-2029 ($ million)
- Chart on DME - Year-over-year growth 2024-2029 (%)
- Data Table on DME - Year-over-year growth 2024-2029 (%)
- 8.7 Others - Market size and forecast 2024-2029
- Chart on Others - Market size and forecast 2024-2029 ($ million)
- Data Table on Others - Market size and forecast 2024-2029 ($ million)
- Chart on Others - Year-over-year growth 2024-2029 (%)
- Data Table on Others - Year-over-year growth 2024-2029 (%)
- 8.8 Market opportunity by Derivative Type
- Market opportunity by Derivative Type ($ million)
- Data Table on Market opportunity by Derivative Type ($ million)
9 Market Segmentation by End-user
- 9.1 Market segments
- Chart on End-user - Market share 2024-2029 (%)
- Data Table on End-user - Market share 2024-2029 (%)
- 9.2 Comparison by End-user
- Chart on Comparison by End-user
- Data Table on Comparison by End-user
- 9.3 Automotive - Market size and forecast 2024-2029
- Chart on Automotive - Market size and forecast 2024-2029 ($ million)
- Data Table on Automotive - Market size and forecast 2024-2029 ($ million)
- Chart on Automotive - Year-over-year growth 2024-2029 (%)
- Data Table on Automotive - Year-over-year growth 2024-2029 (%)
- 9.4 Construction - Market size and forecast 2024-2029
- Chart on Construction - Market size and forecast 2024-2029 ($ million)
- Data Table on Construction - Market size and forecast 2024-2029 ($ million)
- Chart on Construction - Year-over-year growth 2024-2029 (%)
- Data Table on Construction - Year-over-year growth 2024-2029 (%)
- 9.5 Paints and coatings - Market size and forecast 2024-2029
- Chart on Paints and coatings - Market size and forecast 2024-2029 ($ million)
- Data Table on Paints and coatings - Market size and forecast 2024-2029 ($ million)
- Chart on Paints and coatings - Year-over-year growth 2024-2029 (%)
- Data Table on Paints and coatings - Year-over-year growth 2024-2029 (%)
- 9.6 Electronics - Market size and forecast 2024-2029
- Chart on Electronics - Market size and forecast 2024-2029 ($ million)
- Data Table on Electronics - Market size and forecast 2024-2029 ($ million)
- Chart on Electronics - Year-over-year growth 2024-2029 (%)
- Data Table on Electronics - Year-over-year growth 2024-2029 (%)
- 9.7 Others - Market size and forecast 2024-2029
- Chart on Others - Market size and forecast 2024-2029 ($ million)
- Data Table on Others - Market size and forecast 2024-2029 ($ million)
- Chart on Others - Year-over-year growth 2024-2029 (%)
- Data Table on Others - Year-over-year growth 2024-2029 (%)
- 9.8 Market opportunity by End-user
- Market opportunity by End-user ($ million)
- Data Table on Market opportunity by End-user ($ million)
10 Market Segmentation by Feedstock
- 10.1 Market segments
- Chart on Feedstock - Market share 2024-2029 (%)
- Data Table on Feedstock - Market share 2024-2029 (%)
- 10.2 Comparison by Feedstock
- Chart on Comparison by Feedstock
- Data Table on Comparison by Feedstock
- 10.3 Natural gas - Market size and forecast 2024-2029
- Chart on Natural gas - Market size and forecast 2024-2029 ($ million)
- Data Table on Natural gas - Market size and forecast 2024-2029 ($ million)
- Chart on Natural gas - Year-over-year growth 2024-2029 (%)
- Data Table on Natural gas - Year-over-year growth 2024-2029 (%)
- 10.4 Coal - Market size and forecast 2024-2029
- Chart on Coal - Market size and forecast 2024-2029 ($ million)
- Data Table on Coal - Market size and forecast 2024-2029 ($ million)
- Chart on Coal - Year-over-year growth 2024-2029 (%)
- Data Table on Coal - Year-over-year growth 2024-2029 (%)
- 10.5 Market opportunity by Feedstock
- Market opportunity by Feedstock ($ million)
- Data Table on Market opportunity by Feedstock ($ million)
11 Customer Landscape
- 11.1 Customer landscape overview
- Analysis of price sensitivity, lifecycle, customer purchase basket, adoption rates, and purchase criteria
12 Geographic Landscape
- 12.1 Geographic segmentation
- Chart on Market share By Geographical Landscape 2024-2029 (%)
- Data Table on Market share By Geographical Landscape 2024-2029 (%)
- 12.2 Geographic comparison
- Chart on Geographic comparison
- Data Table on Geographic comparison
- 12.3 APAC - Market size and forecast 2024-2029
- Chart on APAC - Market size and forecast 2024-2029 ($ million)
- Data Table on APAC - Market size and forecast 2024-2029 ($ million)
- Chart on APAC - Year-over-year growth 2024-2029 (%)
- Data Table on APAC - Year-over-year growth 2024-2029 (%)
- 12.4 Europe - Market size and forecast 2024-2029
- Chart on Europe - Market size and forecast 2024-2029 ($ million)
- Data Table on Europe - Market size and forecast 2024-2029 ($ million)
- Chart on Europe - Year-over-year growth 2024-2029 (%)
- Data Table on Europe - Year-over-year growth 2024-2029 (%)
- 12.5 North America - Market size and forecast 2024-2029
- Chart on North America - Market size and forecast 2024-2029 ($ million)
- Data Table on North America - Market size and forecast 2024-2029 ($ million)
- Chart on North America - Year-over-year growth 2024-2029 (%)
- Data Table on North America - Year-over-year growth 2024-2029 (%)
- 12.6 Middle East and Africa - Market size and forecast 2024-2029
- Chart on Middle East and Africa - Market size and forecast 2024-2029 ($ million)
- Data Table on Middle East and Africa - Market size and forecast 2024-2029 ($ million)
- Chart on Middle East and Africa - Year-over-year growth 2024-2029 (%)
- Data Table on Middle East and Africa - Year-over-year growth 2024-2029 (%)
- 12.7 South America - Market size and forecast 2024-2029
- Chart on South America - Market size and forecast 2024-2029 ($ million)
- Data Table on South America - Market size and forecast 2024-2029 ($ million)
- Chart on South America - Year-over-year growth 2024-2029 (%)
- Data Table on South America - Year-over-year growth 2024-2029 (%)
- 12.8 China - Market size and forecast 2024-2029
- Chart on China - Market size and forecast 2024-2029 ($ million)
- Data Table on China - Market size and forecast 2024-2029 ($ million)
- Chart on China - Year-over-year growth 2024-2029 (%)
- Data Table on China - Year-over-year growth 2024-2029 (%)
- 12.9 US - Market size and forecast 2024-2029
- Chart on US - Market size and forecast 2024-2029 ($ million)
- Data Table on US - Market size and forecast 2024-2029 ($ million)
- Chart on US - Year-over-year growth 2024-2029 (%)
- Data Table on US - Year-over-year growth 2024-2029 (%)
- 12.10 India - Market size and forecast 2024-2029
- Chart on India - Market size and forecast 2024-2029 ($ million)
- Data Table on India - Market size and forecast 2024-2029 ($ million)
- Chart on India - Year-over-year growth 2024-2029 (%)
- Data Table on India - Year-over-year growth 2024-2029 (%)
- 12.11 Indonesia - Market size and forecast 2024-2029
- Chart on Indonesia - Market size and forecast 2024-2029 ($ million)
- Data Table on Indonesia - Market size and forecast 2024-2029 ($ million)
- Chart on Indonesia - Year-over-year growth 2024-2029 (%)
- Data Table on Indonesia - Year-over-year growth 2024-2029 (%)
- 12.12 Russia - Market size and forecast 2024-2029
- Chart on Russia - Market size and forecast 2024-2029 ($ million)
- Data Table on Russia - Market size and forecast 2024-2029 ($ million)
- Chart on Russia - Year-over-year growth 2024-2029 (%)
- Data Table on Russia - Year-over-year growth 2024-2029 (%)
- 12.13 Saudi Arabia - Market size and forecast 2024-2029
- Chart on Saudi Arabia - Market size and forecast 2024-2029 ($ million)
- Data Table on Saudi Arabia - Market size and forecast 2024-2029 ($ million)
- Chart on Saudi Arabia - Year-over-year growth 2024-2029 (%)
- Data Table on Saudi Arabia - Year-over-year growth 2024-2029 (%)
- 12.14 Germany - Market size and forecast 2024-2029
- Chart on Germany - Market size and forecast 2024-2029 ($ million)
- Data Table on Germany - Market size and forecast 2024-2029 ($ million)
- Chart on Germany - Year-over-year growth 2024-2029 (%)
- Data Table on Germany - Year-over-year growth 2024-2029 (%)
- 12.15 Iran - Market size and forecast 2024-2029
- Chart on Iran - Market size and forecast 2024-2029 ($ million)
- Data Table on Iran - Market size and forecast 2024-2029 ($ million)
- Chart on Iran - Year-over-year growth 2024-2029 (%)
- Data Table on Iran - Year-over-year growth 2024-2029 (%)
- 12.16 Oman - Market size and forecast 2024-2029
- Chart on Oman - Market size and forecast 2024-2029 ($ million)
- Data Table on Oman - Market size and forecast 2024-2029 ($ million)
- Chart on Oman - Year-over-year growth 2024-2029 (%)
- Data Table on Oman - Year-over-year growth 2024-2029 (%)
- 12.17 Canada - Market size and forecast 2024-2029
- Chart on Canada - Market size and forecast 2024-2029 ($ million)
- Data Table on Canada - Market size and forecast 2024-2029 ($ million)
- Chart on Canada - Year-over-year growth 2024-2029 (%)
- Data Table on Canada - Year-over-year growth 2024-2029 (%)
- 12.18 Market opportunity By Geographical Landscape
- Market opportunity By Geographical Landscape ($ million)
- Data Tables on Market opportunity By Geographical Landscape ($ million)
13 Drivers, Challenges, and Opportunity/Restraints
- 13.1 Market drivers
- 13.2 Market challenges
- 13.3 Impact of drivers and challenges
- Impact of drivers and challenges in 2024 and 2029
- 13.4 Market opportunities/restraints
14 Competitive Landscape
- 14.1 Overview
- 14.2 Competitive Landscape
- Overview on criticality of inputs and factors of differentiation
- 14.3 Landscape disruption
- Overview on factors of disruption
- 14.4 Industry risks
- Impact of key risks on business
15 Competitive Analysis
- 15.1 Companies profiled
- Companies covered
- 15.2 Company ranking index
- Company ranking index
- 15.3 Market positioning of companies
- Matrix on companies position and classification
- 15.4 BASF SE
- BASF SE - Overview
- BASF SE - Business segments
- BASF SE - Key news
- BASF SE - Key offerings
- BASF SE - Segment focus
- SWOT
- 15.5 Celanese Corp.
- Celanese Corp. - Overview
- Celanese Corp. - Business segments
- Celanese Corp. - Key news
- Celanese Corp. - Key offerings
- Celanese Corp. - Segment focus
- SWOT
- 15.6 Coogee
- Coogee - Overview
- Coogee - Product / Service
- Coogee - Key offerings
- SWOT
- 15.7 ENERKEM Inc.
- ENERKEM Inc. - Overview
- ENERKEM Inc. - Product / Service
- ENERKEM Inc. - Key offerings
- SWOT
- 15.8 Eni SpA
- Eni SpA - Overview
- Eni SpA - Business segments
- Eni SpA - Key news
- Eni SpA - Key offerings
- Eni SpA - Segment focus
- SWOT
- 15.9 GNFC Ltd.
- GNFC Ltd. - Overview
- GNFC Ltd. - Business segments
- GNFC Ltd. - Key offerings
- GNFC Ltd. - Segment focus
- SWOT
- 15.10 INEOS Group Holdings S.A.
- INEOS Group Holdings S.A. - Overview
- INEOS Group Holdings S.A. - Product / Service
- INEOS Group Holdings S.A. - Key news
- INEOS Group Holdings S.A. - Key offerings
- SWOT
- 15.11 LyondellBasell Industries NV
- LyondellBasell Industries NV - Overview
- LyondellBasell Industries NV - Business segments
- LyondellBasell Industries NV - Key news
- LyondellBasell Industries NV - Key offerings
- LyondellBasell Industries NV - Segment focus
- SWOT
- 15.12 Methanex Corp.
- Methanex Corp. - Overview
- Methanex Corp. - Product / Service
- Methanex Corp. - Key offerings
- SWOT
- 15.13 Mitsubishi Gas Chemical Co. Inc.
- Mitsubishi Gas Chemical Co. Inc. - Overview
- Mitsubishi Gas Chemical Co. Inc. - Business segments
- Mitsubishi Gas Chemical Co. Inc. - Key news
- Mitsubishi Gas Chemical Co. Inc. - Key offerings
- Mitsubishi Gas Chemical Co. Inc. - Segment focus
- SWOT
- 15.14 Mitsui and Co. Ltd.
- Mitsui and Co. Ltd. - Overview
- Mitsui and Co. Ltd. - Business segments
- Mitsui and Co. Ltd. - Key news
- Mitsui and Co. Ltd. - Key offerings
- Mitsui and Co. Ltd. - Segment focus
- SWOT
- 15.15 OCI NV
- OCI NV - Overview
- OCI NV - Business segments
- OCI NV - Key offerings
- OCI NV - Segment focus
- SWOT
- 15.16 PETRONAS Chemicals Group Berhad
- PETRONAS Chemicals Group Berhad - Overview
- PETRONAS Chemicals Group Berhad - Business segments
- PETRONAS Chemicals Group Berhad - Key offerings
- PETRONAS Chemicals Group Berhad - Segment focus
- SWOT
- 15.17 Proman GmbH
- Proman GmbH - Overview
- Proman GmbH - Product / Service
- Proman GmbH - Key offerings
- SWOT
- 15.18 Thermo Fisher Scientific Inc.
- Thermo Fisher Scientific Inc. - Overview
- Thermo Fisher Scientific Inc. - Business segments
- Thermo Fisher Scientific Inc. - Key news
- Thermo Fisher Scientific Inc. - Key offerings
- Thermo Fisher Scientific Inc. - Segment focus
- SWOT
16 Appendix
- 16.1 Scope of the report
- 16.2 Inclusions and exclusions checklist
- Inclusions checklist
- Exclusions checklist
- 16.3 Currency conversion rates for US$
- Currency conversion rates for US$
- 16.4 Research methodology
- Research methodology
- 16.5 Data procurement
- Information sources
- 16.6 Data validation
- Data validation
- 16.7 Validation techniques employed for market sizing
- Validation techniques employed for market sizing
- 16.8 Data synthesis
- Data synthesis
- 16.9 360 degree market analysis
- 360 degree market analysis
- 16.10 List of abbreviations
- List of abbreviations

