|
|
市場調査レポート
商品コード
1517143
保管・倉庫リースの世界市場 2024-2028Global storage and warehousing leasing market 2024-2028 |
||||||
|
|||||||
カスタマイズ可能
|
|||||||

| 保管・倉庫リースの世界市場 2024-2028 |
|
出版日: 2024年06月12日
発行: TechNavio
ページ情報: 英文 175 Pages
納期: 即納可能
|

全表示
- 概要
- 図表
- 目次
保管・倉庫リース市場は2023-2028年に1,072億米ドル、予測期間中のCAGRは7.8%で成長すると予測されます。
当レポートでは、保管・倉庫リース市場の全体的な分析、市場規模・予測、動向、成長促進要因、課題、約25のベンダーを網羅したベンダー分析などを掲載しています。
現在の市場シナリオ、最新動向と促進要因、市場環境全体に関する最新分析を提供しています。倉庫・保管サービスに対する世界の需要の増加、世界のサードパーティロジスティクス(3PL)セクターの成長、冷凍食品保管用の冷蔵倉庫の需要拡大が市場を牽引しています。
| 市場範囲 | |
|---|---|
| 基準年 | 2024 |
| 終了年 | 2028 |
| 予測期間 | 2024-2028 |
| 成長モメンタム | 加速 |
| 前年比2024年 | 7.23% |
| CAGR | 7.8% |
| 増分額 | 1,072億米ドル |
本調査では、今後数年間の保管・倉庫リース市場の成長を促進する主な理由の1つとして、倉庫の近代化のためのテクノロジー利用の増加を挙げています。また、二酸化炭素排出量を削減するためのグリーン倉庫への需要の高まりや、サービスとしてのセルフストレージの出現も、市場の大きな需要につながると思われます。
目次
第1章 エグゼクティブサマリー
- 市場概要
第2章 市場情勢
- 市場エコシステム
- 市場の特徴
- バリューチェーン分析
第3章 市場規模の評価
- 市場の定義
- 市場セグメント分析
- 市場規模 2023
- 市場の見通し 2023-2028
第4章 市場規模実績
- 世界保管・倉庫リース市場 2018-2022
- タイプ別セグメント分析 2018-2022
- エンドユーザー別セグメント分析 2018-2022
- 地域別セグメント分析 2018-2022
- 国別セグメント分析 2018-2022
第5章 ファイブフォース分析
- ファイブフォースの要約
- 買い手の交渉力
- 供給企業の交渉力
- 新規参入業者の脅威
- 代替品の脅威
- 競争の脅威
- 市況
第6章 市場セグメンテーション:タイプ別
- 市場セグメンテーション
- 比較:タイプ別
- 環境制御なし:市場規模と予測 2023-2028
- 環境制御あり:市場規模と予測 2023-2028
- 市場機会:タイプ別
第7章 市場セグメンテーション:エンドユーザー別
- 市場セグメンテーション
- 比較:エンドユーザー別
- 製造業:市場規模と予測 2023-2028
- 小売り:市場規模と予測 2023-2028
- 消費財:市場規模と予測 2023-2028
- 飲食品:市場規模と予測 2023-2028
- その他:市場規模と予測 2023-2028
- 市場機会:エンドユーザー別
第8章 顧客情勢
- 顧客情勢の概要
第9章 地域別情勢
- 地域別セグメンテーション
- 地域別比較
- 北米:市場規模と予測 2023-2028
- アジア太平洋:市場規模と予測 2023-2028
- 欧州:市場規模と予測 2023-2028
- 南米:市場規模と予測 2023-2028
- 中東・アフリカ:市場規模と予測 2023-2028
- 米国:市場規模と予測 2023-2028
- 中国:市場規模と予測 2023-2028
- 日本:市場規模と予測 2023-2028
- インド:市場規模と予測 2023-2028
- 英国:市場規模と予測 2023-2028
- 市場機会:地域情勢別
第10章 促進要因・課題・機会・抑制要因
- 市場促進要因
- 市場の課題
- 促進要因と課題の影響
- 市場の機会・抑制要因
第11章 競合情勢
- 概要
- 競合情勢
- 混乱の状況
- 業界のリスク
第12章 競合分析
- 企業プロファイル
- 企業の市場ポジショニング
- Adwise Realty LLP
- Agility Public Warehousing Co. K.S.C.P
- Avison Young
- CBRE Group Inc.
- Central Storage and Warehouse Co.
- Colliers International Property Consultants Inc.
- CubeSmart LP
- Lee and Associates Licensing and Administration Co. LP
- Prologis Inc.
- Public Storage
- Radius Commercial Real Estate
- Royal Commercial Real Estate LLC
- Safestore Holdings plc
- Transwestern Commercial Services LLC
- W. T. Young LLC
第13章 付録
Exhibits:
- Exhibits1: Executive Summary - Chart on Market Overview
- Exhibits2: Executive Summary - Data Table on Market Overview
- Exhibits3: Executive Summary - Chart on Global Market Characteristics
- Exhibits4: Executive Summary - Chart on Market By Geographical Landscape
- Exhibits5: Executive Summary - Chart on Market Segmentation by Type
- Exhibits6: Executive Summary - Chart on Market Segmentation by End-user
- Exhibits7: Executive Summary - Chart on Incremental Growth
- Exhibits8: Executive Summary - Data Table on Incremental Growth
- Exhibits9: Executive Summary - Chart on Company Market Positioning
- Exhibits10: Parent Market
- Exhibits11: Data Table on - Parent Market
- Exhibits12: Market characteristics analysis
- Exhibits13: Value Chain Analysis
- Exhibits14: Offerings of companies included in the market definition
- Exhibits15: Market segments
- Exhibits16: Chart on Global - Market size and forecast 2023-2028 ($ billion)
- Exhibits17: Data Table on Global - Market size and forecast 2023-2028 ($ billion)
- Exhibits18: Chart on Global Market: Year-over-year growth 2023-2028 (%)
- Exhibits19: Data Table on Global Market: Year-over-year growth 2023-2028 (%)
- Exhibits20: Historic Market Size - Data Table on Global Storage And Warehousing Leasing Market 2018 - 2022 ($ billion)
- Exhibits21: Historic Market Size - Type Segment 2018 - 2022 ($ billion)
- Exhibits22: Historic Market Size - End-user Segment 2018 - 2022 ($ billion)
- Exhibits23: Historic Market Size - Geography Segment 2018 - 2022 ($ billion)
- Exhibits24: Historic Market Size - Country Segment 2018 - 2022 ($ billion)
- Exhibits25: Five forces analysis - Comparison between 2023 and 2028
- Exhibits26: Bargaining power of buyers - Impact of key factors 2023 and 2028
- Exhibits27: Bargaining power of suppliers - Impact of key factors in 2023 and 2028
- Exhibits28: Threat of new entrants - Impact of key factors in 2023 and 2028
- Exhibits29: Threat of substitutes - Impact of key factors in 2023 and 2028
- Exhibits30: Threat of rivalry - Impact of key factors in 2023 and 2028
- Exhibits31: Chart on Market condition - Five forces 2023 and 2028
- Exhibits32: Chart on Type - Market share 2023-2028 (%)
- Exhibits33: Data Table on Type - Market share 2023-2028 (%)
- Exhibits34: Chart on Comparison by Type
- Exhibits35: Data Table on Comparison by Type
- Exhibits36: Chart on Non-climate controlled - Market size and forecast 2023-2028 ($ billion)
- Exhibits37: Data Table on Non-climate controlled - Market size and forecast 2023-2028 ($ billion)
- Exhibits38: Chart on Non-climate controlled - Year-over-year growth 2023-2028 (%)
- Exhibits39: Data Table on Non-climate controlled - Year-over-year growth 2023-2028 (%)
- Exhibits40: Chart on Climate controlled - Market size and forecast 2023-2028 ($ billion)
- Exhibits41: Data Table on Climate controlled - Market size and forecast 2023-2028 ($ billion)
- Exhibits42: Chart on Climate controlled - Year-over-year growth 2023-2028 (%)
- Exhibits43: Data Table on Climate controlled - Year-over-year growth 2023-2028 (%)
- Exhibits44: Market opportunity by Type ($ billion)
- Exhibits45: Data Table on Market opportunity by Type ($ billion)
- Exhibits46: Chart on End-user - Market share 2023-2028 (%)
- Exhibits47: Data Table on End-user - Market share 2023-2028 (%)
- Exhibits48: Chart on Comparison by End-user
- Exhibits49: Data Table on Comparison by End-user
- Exhibits50: Chart on Manufacturing - Market size and forecast 2023-2028 ($ billion)
- Exhibits51: Data Table on Manufacturing - Market size and forecast 2023-2028 ($ billion)
- Exhibits52: Chart on Manufacturing - Year-over-year growth 2023-2028 (%)
- Exhibits53: Data Table on Manufacturing - Year-over-year growth 2023-2028 (%)
- Exhibits54: Chart on Retail - Market size and forecast 2023-2028 ($ billion)
- Exhibits55: Data Table on Retail - Market size and forecast 2023-2028 ($ billion)
- Exhibits56: Chart on Retail - Year-over-year growth 2023-2028 (%)
- Exhibits57: Data Table on Retail - Year-over-year growth 2023-2028 (%)
- Exhibits58: Chart on Consumer goods - Market size and forecast 2023-2028 ($ billion)
- Exhibits59: Data Table on Consumer goods - Market size and forecast 2023-2028 ($ billion)
- Exhibits60: Chart on Consumer goods - Year-over-year growth 2023-2028 (%)
- Exhibits61: Data Table on Consumer goods - Year-over-year growth 2023-2028 (%)
- Exhibits62: Chart on Food and beverages - Market size and forecast 2023-2028 ($ billion)
- Exhibits63: Data Table on Food and beverages - Market size and forecast 2023-2028 ($ billion)
- Exhibits64: Chart on Food and beverages - Year-over-year growth 2023-2028 (%)
- Exhibits65: Data Table on Food and beverages - Year-over-year growth 2023-2028 (%)
- Exhibits66: Chart on Others - Market size and forecast 2023-2028 ($ billion)
- Exhibits67: Data Table on Others - Market size and forecast 2023-2028 ($ billion)
- Exhibits68: Chart on Others - Year-over-year growth 2023-2028 (%)
- Exhibits69: Data Table on Others - Year-over-year growth 2023-2028 (%)
- Exhibits70: Market opportunity by End-user ($ billion)
- Exhibits71: Data Table on Market opportunity by End-user ($ billion)
- Exhibits72: Analysis of price sensitivity, lifecycle, customer purchase basket, adoption rates, and purchase criteria
- Exhibits73: Chart on Market share By Geographical Landscape 2023-2028 (%)
- Exhibits74: Data Table on Market share By Geographical Landscape 2023-2028 (%)
- Exhibits75: Chart on Geographic comparison
- Exhibits76: Data Table on Geographic comparison
- Exhibits77: Chart on North America - Market size and forecast 2023-2028 ($ billion)
- Exhibits78: Data Table on North America - Market size and forecast 2023-2028 ($ billion)
- Exhibits79: Chart on North America - Year-over-year growth 2023-2028 (%)
- Exhibits80: Data Table on North America - Year-over-year growth 2023-2028 (%)
- Exhibits81: Chart on APAC - Market size and forecast 2023-2028 ($ billion)
- Exhibits82: Data Table on APAC - Market size and forecast 2023-2028 ($ billion)
- Exhibits83: Chart on APAC - Year-over-year growth 2023-2028 (%)
- Exhibits84: Data Table on APAC - Year-over-year growth 2023-2028 (%)
- Exhibits85: Chart on Europe - Market size and forecast 2023-2028 ($ billion)
- Exhibits86: Data Table on Europe - Market size and forecast 2023-2028 ($ billion)
- Exhibits87: Chart on Europe - Year-over-year growth 2023-2028 (%)
- Exhibits88: Data Table on Europe - Year-over-year growth 2023-2028 (%)
- Exhibits89: Chart on South America - Market size and forecast 2023-2028 ($ billion)
- Exhibits90: Data Table on South America - Market size and forecast 2023-2028 ($ billion)
- Exhibits91: Chart on South America - Year-over-year growth 2023-2028 (%)
- Exhibits92: Data Table on South America - Year-over-year growth 2023-2028 (%)
- Exhibits93: Chart on Middle East and Africa - Market size and forecast 2023-2028 ($ billion)
- Exhibits94: Data Table on Middle East and Africa - Market size and forecast 2023-2028 ($ billion)
- Exhibits95: Chart on Middle East and Africa - Year-over-year growth 2023-2028 (%)
- Exhibits96: Data Table on Middle East and Africa - Year-over-year growth 2023-2028 (%)
- Exhibits97: Chart on US - Market size and forecast 2023-2028 ($ billion)
- Exhibits98: Data Table on US - Market size and forecast 2023-2028 ($ billion)
- Exhibits99: Chart on US - Year-over-year growth 2023-2028 (%)
- Exhibits100: Data Table on US - Year-over-year growth 2023-2028 (%)
- Exhibits101: Chart on China - Market size and forecast 2023-2028 ($ billion)
- Exhibits102: Data Table on China - Market size and forecast 2023-2028 ($ billion)
- Exhibits103: Chart on China - Year-over-year growth 2023-2028 (%)
- Exhibits104: Data Table on China - Year-over-year growth 2023-2028 (%)
- Exhibits105: Chart on Japan - Market size and forecast 2023-2028 ($ billion)
- Exhibits106: Data Table on Japan - Market size and forecast 2023-2028 ($ billion)
- Exhibits107: Chart on Japan - Year-over-year growth 2023-2028 (%)
- Exhibits108: Data Table on Japan - Year-over-year growth 2023-2028 (%)
- Exhibits109: Chart on India - Market size and forecast 2023-2028 ($ billion)
- Exhibits110: Data Table on India - Market size and forecast 2023-2028 ($ billion)
- Exhibits111: Chart on India - Year-over-year growth 2023-2028 (%)
- Exhibits112: Data Table on India - Year-over-year growth 2023-2028 (%)
- Exhibits113: Chart on UK - Market size and forecast 2023-2028 ($ billion)
- Exhibits114: Data Table on UK - Market size and forecast 2023-2028 ($ billion)
- Exhibits115: Chart on UK - Year-over-year growth 2023-2028 (%)
- Exhibits116: Data Table on UK - Year-over-year growth 2023-2028 (%)
- Exhibits117: Market opportunity By Geographical Landscape ($ billion)
- Exhibits118: Data Tables on Market opportunity By Geographical Landscape ($ billion)
- Exhibits119: Impact of drivers and challenges in 2023 and 2028
- Exhibits120: Overview on criticality of inputs and factors of differentiation
- Exhibits121: Overview on factors of disruption
- Exhibits122: Impact of key risks on business
- Exhibits123: Companies covered
- Exhibits124: Matrix on companies position and classification
- Exhibits125: Adwise Realty LLP - Overview
- Exhibits126: Adwise Realty LLP - Product / Service
- Exhibits127: Adwise Realty LLP - Key offerings
- Exhibits128: Agility Public Warehousing Co. K.S.C.P - Overview
- Exhibits129: Agility Public Warehousing Co. K.S.C.P - Business segments
- Exhibits130: Agility Public Warehousing Co. K.S.C.P - Key offerings
- Exhibits131: Agility Public Warehousing Co. K.S.C.P - Segment focus
- Exhibits132: Avison Young - Overview
- Exhibits133: Avison Young - Product / Service
- Exhibits134: Avison Young - Key offerings
- Exhibits135: CBRE Group Inc. - Overview
- Exhibits136: CBRE Group Inc. - Business segments
- Exhibits137: CBRE Group Inc. - Key news
- Exhibits138: CBRE Group Inc. - Key offerings
- Exhibits139: CBRE Group Inc. - Segment focus
- Exhibits140: Central Storage and Warehouse Co. - Overview
- Exhibits141: Central Storage and Warehouse Co. - Product / Service
- Exhibits142: Central Storage and Warehouse Co. - Key offerings
- Exhibits143: Colliers International Property Consultants Inc. - Overview
- Exhibits144: Colliers International Property Consultants Inc. - Product / Service
- Exhibits145: Colliers International Property Consultants Inc. - Key news
- Exhibits146: Colliers International Property Consultants Inc. - Key offerings
- Exhibits147: CubeSmart LP - Overview
- Exhibits148: CubeSmart LP - Product / Service
- Exhibits149: CubeSmart LP - Key offerings
- Exhibits150: Lee and Associates Licensing and Administration Co. LP - Overview
- Exhibits151: Lee and Associates Licensing and Administration Co. LP - Product / Service
- Exhibits152: Lee and Associates Licensing and Administration Co. LP - Key offerings
- Exhibits153: Prologis Inc. - Overview
- Exhibits154: Prologis Inc. - Business segments
- Exhibits155: Prologis Inc. - Key news
- Exhibits156: Prologis Inc. - Key offerings
- Exhibits157: Prologis Inc. - Segment focus
- Exhibits158: Public Storage - Overview
- Exhibits159: Public Storage - Business segments
- Exhibits160: Public Storage - Key offerings
- Exhibits161: Public Storage - Segment focus
- Exhibits162: Radius Commercial Real Estate - Overview
- Exhibits163: Radius Commercial Real Estate - Product / Service
- Exhibits164: Radius Commercial Real Estate - Key offerings
- Exhibits165: Royal Commercial Real Estate LLC - Overview
- Exhibits166: Royal Commercial Real Estate LLC - Product / Service
- Exhibits167: Royal Commercial Real Estate LLC - Key offerings
- Exhibits168: Safestore Holdings plc - Overview
- Exhibits169: Safestore Holdings plc - Business segments
- Exhibits170: Safestore Holdings plc - Key offerings
- Exhibits171: Safestore Holdings plc - Segment focus
- Exhibits172: Transwestern Commercial Services LLC - Overview
- Exhibits173: Transwestern Commercial Services LLC - Product / Service
- Exhibits174: Transwestern Commercial Services LLC - Key offerings
- Exhibits175: W. T. Young LLC - Overview
- Exhibits176: W. T. Young LLC - Product / Service
- Exhibits177: W. T. Young LLC - Key offerings
- Exhibits178: Inclusions checklist
- Exhibits179: Exclusions checklist
- Exhibits180: Currency conversion rates for US$
- Exhibits181: Research methodology
- Exhibits182: Information sources
- Exhibits183: Data validation
- Exhibits184: Validation techniques employed for market sizing
- Exhibits185: Data synthesis
- Exhibits186: 360 degree market analysis
- Exhibits187: List of abbreviations
The storage and warehousing leasing market is forecasted to grow by USD 107.2 bn during 2023-2028, accelerating at a CAGR of 7.8% during the forecast period. The report on the storage and warehousing leasing market provides a holistic analysis, market size and forecast, trends, growth drivers, and challenges, as well as vendor analysis covering around 25 vendors.
The report offers an up-to-date analysis regarding the current market scenario, the latest trends and drivers, and the overall market environment. The market is driven by increase in global demand for warehousing and storage services, growth of global third-party logistics (3PL) sector, and growing demand for refrigerated warehouses for storage of frozen food.
Technavio's storage and warehousing leasing market is segmented as below:
| Market Scope | |
|---|---|
| Base Year | 2024 |
| End Year | 2028 |
| Series Year | 2024-2028 |
| Growth Momentum | Accelerate |
| YOY 2024 | 7.23% |
| CAGR | 7.8% |
| Incremental Value | $107.2bn |
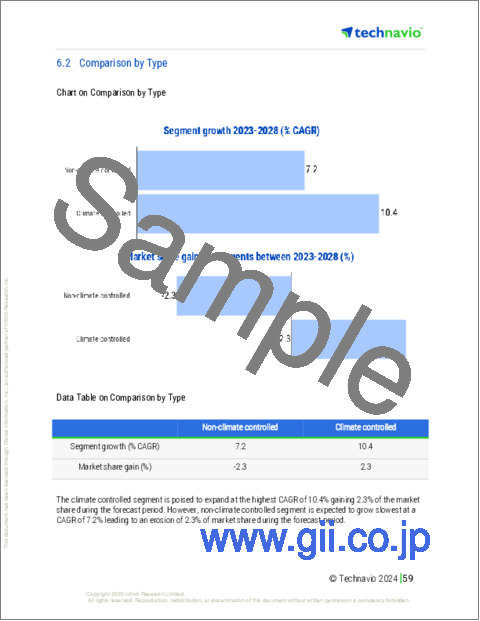
By Type
- Non-climate controlled
- Climate controlled
By End-user
- Manufacturing
- Retail
- Consumer goods
- Food and beverages
- Others
By Geographical Landscape
- North America
- APAC
- Europe
- South America
- Middle East and Africa
This study identifies the increased use of technology for the modernization of warehouses as one of the prime reasons driving the storage and warehousing leasing market growth during the next few years. Also, growth of demand for green warehouses to reduce carbon footprint and emergence of self-storage as a service will lead to sizable demand in the market.
The report on the storage and warehousing leasing market covers the following areas:
- Storage and warehousing leasing market sizing
- Storage and warehousing leasing market forecast
- Storage and warehousing leasing market industry analysis
The robust vendor analysis is designed to help clients improve their market position, and in line with this, this report provides a detailed analysis of several leading storage and warehousing leasing market vendors that include Adwise Realty LLP, Agility Public Warehousing Co. K.S.C.P, American Warehouses, Avison Young, CBRE Group Inc., Central Storage and Warehouse Co., Colliers International Property Consultants Inc., CubeSmart LP, Foster Van Lines, Lee and Associates Licensing and Administration Co. LP, Prologis Inc., Public Storage, Radius Commercial Real Estate, Royal Commercial Real Estate LLC, Safestore Holdings PLC, Saltbox, TransWestern Commercial Services LLC, W. T. Young LLC, Ward North American, and Warehouses Plus. Also, the storage and warehousing leasing market analysis report includes information on upcoming trends and challenges that will influence market growth. This is to help companies strategize and leverage all forthcoming growth opportunities.
The study was conducted using an objective combination of primary and secondary information including inputs from key participants in the industry. The report contains a comprehensive market and vendor landscape in addition to an analysis of the key vendors.
The publisher presents a detailed picture of the market by the way of study, synthesis, and summation of data from multiple sources by an analysis of key parameters such as profit, pricing, competition, and promotions. IT presents various market facets by identifying the key industry influencers. The data presented is comprehensive, reliable, and a result of extensive research - both primary and secondary. The market research reports provide a complete competitive landscape and an in-depth vendor selection methodology and analysis using qualitative and quantitative research to forecast the accurate market growth.
Table of Contents
1 Executive Summary
- 1.1 Market overview
- Executive Summary - Chart on Market Overview
- Executive Summary - Data Table on Market Overview
- Executive Summary - Chart on Global Market Characteristics
- Executive Summary - Chart on Market By Geographical Landscape
- Executive Summary - Chart on Market Segmentation by Type
- Executive Summary - Chart on Market Segmentation by End-user
- Executive Summary - Chart on Incremental Growth
- Executive Summary - Data Table on Incremental Growth
- Executive Summary - Chart on Company Market Positioning
2 Market Landscape
- 2.1 Market ecosystem
- Parent Market
- Data Table on - Parent Market
- 2.2 Market characteristics
- Market characteristics analysis
- 2.3 Value chain analysis
- Value Chain Analysis
3 Market Sizing
- 3.1 Market definition
- Offerings of companies included in the market definition
- 3.2 Market segment analysis
- Market segments
- 3.3 Market size 2023
- 3.4 Market outlook: Forecast for 2023-2028
- Chart on Global - Market size and forecast 2023-2028 ($ billion)
- Data Table on Global - Market size and forecast 2023-2028 ($ billion)
- Chart on Global Market: Year-over-year growth 2023-2028 (%)
- Data Table on Global Market: Year-over-year growth 2023-2028 (%)
4 Historic Market Size
- 4.1 Global Storage And Warehousing Leasing Market 2018 - 2022
- Historic Market Size - Data Table on Global Storage And Warehousing Leasing Market 2018 - 2022 ($ billion)
- 4.2 Type segment analysis 2018 - 2022
- Historic Market Size - Type Segment 2018 - 2022 ($ billion)
- 4.3 End-user segment analysis 2018 - 2022
- Historic Market Size - End-user Segment 2018 - 2022 ($ billion)
- 4.4 Geography segment analysis 2018 - 2022
- Historic Market Size - Geography Segment 2018 - 2022 ($ billion)
- 4.5 Country segment analysis 2018 - 2022
- Historic Market Size - Country Segment 2018 - 2022 ($ billion)
5 Five Forces Analysis
- 5.1 Five forces summary
- Five forces analysis - Comparison between 2023 and 2028
- 5.2 Bargaining power of buyers
- Bargaining power of buyers - Impact of key factors 2023 and 2028
- 5.3 Bargaining power of suppliers
- Bargaining power of suppliers - Impact of key factors in 2023 and 2028
- 5.4 Threat of new entrants
- Threat of new entrants - Impact of key factors in 2023 and 2028
- 5.5 Threat of substitutes
- Threat of substitutes - Impact of key factors in 2023 and 2028
- 5.6 Threat of rivalry
- Threat of rivalry - Impact of key factors in 2023 and 2028
- 5.7 Market condition
- Chart on Market condition - Five forces 2023 and 2028
6 Market Segmentation by Type
- 6.1 Market segments
- Chart on Type - Market share 2023-2028 (%)
- Data Table on Type - Market share 2023-2028 (%)
- 6.2 Comparison by Type
- Chart on Comparison by Type
- Data Table on Comparison by Type
- 6.3 Non-climate controlled - Market size and forecast 2023-2028
- Chart on Non-climate controlled - Market size and forecast 2023-2028 ($ billion)
- Data Table on Non-climate controlled - Market size and forecast 2023-2028 ($ billion)
- Chart on Non-climate controlled - Year-over-year growth 2023-2028 (%)
- Data Table on Non-climate controlled - Year-over-year growth 2023-2028 (%)
- 6.4 Climate controlled - Market size and forecast 2023-2028
- Chart on Climate controlled - Market size and forecast 2023-2028 ($ billion)
- Data Table on Climate controlled - Market size and forecast 2023-2028 ($ billion)
- Chart on Climate controlled - Year-over-year growth 2023-2028 (%)
- Data Table on Climate controlled - Year-over-year growth 2023-2028 (%)
- 6.5 Market opportunity by Type
- Market opportunity by Type ($ billion)
- Data Table on Market opportunity by Type ($ billion)
7 Market Segmentation by End-user
- 7.1 Market segments
- Chart on End-user - Market share 2023-2028 (%)
- Data Table on End-user - Market share 2023-2028 (%)
- 7.2 Comparison by End-user
- Chart on Comparison by End-user
- Data Table on Comparison by End-user
- 7.3 Manufacturing - Market size and forecast 2023-2028
- Chart on Manufacturing - Market size and forecast 2023-2028 ($ billion)
- Data Table on Manufacturing - Market size and forecast 2023-2028 ($ billion)
- Chart on Manufacturing - Year-over-year growth 2023-2028 (%)
- Data Table on Manufacturing - Year-over-year growth 2023-2028 (%)
- 7.4 Retail - Market size and forecast 2023-2028
- Chart on Retail - Market size and forecast 2023-2028 ($ billion)
- Data Table on Retail - Market size and forecast 2023-2028 ($ billion)
- Chart on Retail - Year-over-year growth 2023-2028 (%)
- Data Table on Retail - Year-over-year growth 2023-2028 (%)
- 7.5 Consumer goods - Market size and forecast 2023-2028
- Chart on Consumer goods - Market size and forecast 2023-2028 ($ billion)
- Data Table on Consumer goods - Market size and forecast 2023-2028 ($ billion)
- Chart on Consumer goods - Year-over-year growth 2023-2028 (%)
- Data Table on Consumer goods - Year-over-year growth 2023-2028 (%)
- 7.6 Food and beverages - Market size and forecast 2023-2028
- Chart on Food and beverages - Market size and forecast 2023-2028 ($ billion)
- Data Table on Food and beverages - Market size and forecast 2023-2028 ($ billion)
- Chart on Food and beverages - Year-over-year growth 2023-2028 (%)
- Data Table on Food and beverages - Year-over-year growth 2023-2028 (%)
- 7.7 Others - Market size and forecast 2023-2028
- Chart on Others - Market size and forecast 2023-2028 ($ billion)
- Data Table on Others - Market size and forecast 2023-2028 ($ billion)
- Chart on Others - Year-over-year growth 2023-2028 (%)
- Data Table on Others - Year-over-year growth 2023-2028 (%)
- 7.8 Market opportunity by End-user
- Market opportunity by End-user ($ billion)
- Data Table on Market opportunity by End-user ($ billion)
8 Customer Landscape
- 8.1 Customer landscape overview
- Analysis of price sensitivity, lifecycle, customer purchase basket, adoption rates, and purchase criteria
9 Geographic Landscape
- 9.1 Geographic segmentation
- Chart on Market share By Geographical Landscape 2023-2028 (%)
- Data Table on Market share By Geographical Landscape 2023-2028 (%)
- 9.2 Geographic comparison
- Chart on Geographic comparison
- Data Table on Geographic comparison
- 9.3 North America - Market size and forecast 2023-2028
- Chart on North America - Market size and forecast 2023-2028 ($ billion)
- Data Table on North America - Market size and forecast 2023-2028 ($ billion)
- Chart on North America - Year-over-year growth 2023-2028 (%)
- Data Table on North America - Year-over-year growth 2023-2028 (%)
- 9.4 APAC - Market size and forecast 2023-2028
- Chart on APAC - Market size and forecast 2023-2028 ($ billion)
- Data Table on APAC - Market size and forecast 2023-2028 ($ billion)
- Chart on APAC - Year-over-year growth 2023-2028 (%)
- Data Table on APAC - Year-over-year growth 2023-2028 (%)
- 9.5 Europe - Market size and forecast 2023-2028
- Chart on Europe - Market size and forecast 2023-2028 ($ billion)
- Data Table on Europe - Market size and forecast 2023-2028 ($ billion)
- Chart on Europe - Year-over-year growth 2023-2028 (%)
- Data Table on Europe - Year-over-year growth 2023-2028 (%)
- 9.6 South America - Market size and forecast 2023-2028
- Chart on South America - Market size and forecast 2023-2028 ($ billion)
- Data Table on South America - Market size and forecast 2023-2028 ($ billion)
- Chart on South America - Year-over-year growth 2023-2028 (%)
- Data Table on South America - Year-over-year growth 2023-2028 (%)
- 9.7 Middle East and Africa - Market size and forecast 2023-2028
- Chart on Middle East and Africa - Market size and forecast 2023-2028 ($ billion)
- Data Table on Middle East and Africa - Market size and forecast 2023-2028 ($ billion)
- Chart on Middle East and Africa - Year-over-year growth 2023-2028 (%)
- Data Table on Middle East and Africa - Year-over-year growth 2023-2028 (%)
- 9.8 US - Market size and forecast 2023-2028
- Chart on US - Market size and forecast 2023-2028 ($ billion)
- Data Table on US - Market size and forecast 2023-2028 ($ billion)
- Chart on US - Year-over-year growth 2023-2028 (%)
- Data Table on US - Year-over-year growth 2023-2028 (%)
- 9.9 China - Market size and forecast 2023-2028
- Chart on China - Market size and forecast 2023-2028 ($ billion)
- Data Table on China - Market size and forecast 2023-2028 ($ billion)
- Chart on China - Year-over-year growth 2023-2028 (%)
- Data Table on China - Year-over-year growth 2023-2028 (%)
- 9.10 Japan - Market size and forecast 2023-2028
- Chart on Japan - Market size and forecast 2023-2028 ($ billion)
- Data Table on Japan - Market size and forecast 2023-2028 ($ billion)
- Chart on Japan - Year-over-year growth 2023-2028 (%)
- Data Table on Japan - Year-over-year growth 2023-2028 (%)
- 9.11 India - Market size and forecast 2023-2028
- Chart on India - Market size and forecast 2023-2028 ($ billion)
- Data Table on India - Market size and forecast 2023-2028 ($ billion)
- Chart on India - Year-over-year growth 2023-2028 (%)
- Data Table on India - Year-over-year growth 2023-2028 (%)
- 9.12 UK - Market size and forecast 2023-2028
- Chart on UK - Market size and forecast 2023-2028 ($ billion)
- Data Table on UK - Market size and forecast 2023-2028 ($ billion)
- Chart on UK - Year-over-year growth 2023-2028 (%)
- Data Table on UK - Year-over-year growth 2023-2028 (%)
- 9.13 Market opportunity By Geographical Landscape
- Market opportunity By Geographical Landscape ($ billion)
- Data Tables on Market opportunity By Geographical Landscape ($ billion)
10 Drivers, Challenges, and Opportunity/Restraints
- 10.1 Market drivers
- 10.2 Market challenges
- 10.3 Impact of drivers and challenges
- Impact of drivers and challenges in 2023 and 2028
- 10.4 Market opportunities/restraints
11 Competitive Landscape
- 11.1 Overview
- 11.2 Competitive Landscape
- Overview on criticality of inputs and factors of differentiation
- 11.3 Landscape disruption
- Overview on factors of disruption
- 11.4 Industry risks
- Impact of key risks on business
12 Competitive Analysis
- 12.1 Companies profiled
- Companies covered
- 12.2 Market positioning of companies
- Matrix on companies position and classification
- 12.3 Adwise Realty LLP
- Adwise Realty LLP - Overview
- Adwise Realty LLP - Product / Service
- Adwise Realty LLP - Key offerings
- 12.4 Agility Public Warehousing Co. K.S.C.P
- Agility Public Warehousing Co. K.S.C.P - Overview
- Agility Public Warehousing Co. K.S.C.P - Business segments
- Agility Public Warehousing Co. K.S.C.P - Key offerings
- Agility Public Warehousing Co. K.S.C.P - Segment focus
- 12.5 Avison Young
- Avison Young - Overview
- Avison Young - Product / Service
- Avison Young - Key offerings
- 12.6 CBRE Group Inc.
- CBRE Group Inc. - Overview
- CBRE Group Inc. - Business segments
- CBRE Group Inc. - Key news
- CBRE Group Inc. - Key offerings
- CBRE Group Inc. - Segment focus
- 12.7 Central Storage and Warehouse Co.
- Central Storage and Warehouse Co. - Overview
- Central Storage and Warehouse Co. - Product / Service
- Central Storage and Warehouse Co. - Key offerings
- 12.8 Colliers International Property Consultants Inc.
- Colliers International Property Consultants Inc. - Overview
- Colliers International Property Consultants Inc. - Product / Service
- Colliers International Property Consultants Inc. - Key news
- Colliers International Property Consultants Inc. - Key offerings
- 12.9 CubeSmart LP
- CubeSmart LP - Overview
- CubeSmart LP - Product / Service
- CubeSmart LP - Key offerings
- 12.10 Lee and Associates Licensing and Administration Co. LP
- Lee and Associates Licensing and Administration Co. LP - Overview
- Lee and Associates Licensing and Administration Co. LP - Product / Service
- Lee and Associates Licensing and Administration Co. LP - Key offerings
- 12.11 Prologis Inc.
- Prologis Inc. - Overview
- Prologis Inc. - Business segments
- Prologis Inc. - Key news
- Prologis Inc. - Key offerings
- Prologis Inc. - Segment focus
- 12.12 Public Storage
- Public Storage - Overview
- Public Storage - Business segments
- Public Storage - Key offerings
- Public Storage - Segment focus
- 12.13 Radius Commercial Real Estate
- Radius Commercial Real Estate - Overview
- Radius Commercial Real Estate - Product / Service
- Radius Commercial Real Estate - Key offerings
- 12.14 Royal Commercial Real Estate LLC
- Royal Commercial Real Estate LLC - Overview
- Royal Commercial Real Estate LLC - Product / Service
- Royal Commercial Real Estate LLC - Key offerings
- 12.15 Safestore Holdings plc
- Safestore Holdings plc - Overview
- Safestore Holdings plc - Business segments
- Safestore Holdings plc - Key offerings
- Safestore Holdings plc - Segment focus
- 12.16 Transwestern Commercial Services LLC
- Transwestern Commercial Services LLC - Overview
- Transwestern Commercial Services LLC - Product / Service
- Transwestern Commercial Services LLC - Key offerings
- 12.17 W. T. Young LLC
- W. T. Young LLC - Overview
- W. T. Young LLC - Product / Service
- W. T. Young LLC - Key offerings
13 Appendix
- 13.1 Scope of the report
- 13.2 Inclusions and exclusions checklist
- Inclusions checklist
- Exclusions checklist
- 13.3 Currency conversion rates for US$
- Currency conversion rates for US$
- 13.4 Research methodology
- Research methodology
- 13.5 Data procurement
- Information sources
- 13.6 Data validation
- Data validation
- 13.7 Validation techniques employed for market sizing
- Validation techniques employed for market sizing
- 13.8 Data synthesis
- Data synthesis
- 13.9 360 degree market analysis
- 360 degree market analysis
- 13.10 List of abbreviations
- List of abbreviations

