|
|
市場調査レポート
商品コード
1517135
マルチビタミンとミネラルのサプリメントの世界市場 2024-2028Global multivitamin and mineral supplements market 2024-2028 |
||||||

|
|||||||
カスタマイズ可能
|
|||||||


| マルチビタミンとミネラルのサプリメントの世界市場 2024-2028 |
|
出版日: 2024年06月12日
発行: TechNavio
ページ情報: 英文 152 Pages
納期: 即納可能
|

全表示
- 概要
- 図表
- 目次
マルチビタミンとミネラルのサプリメント市場は2023年から2028年にかけて29億7,880万米ドル、予測期間中のCAGRは4.5%で成長すると予測されています。
当レポートでは、マルチビタミンとミネラルのサプリメント市場の全体的な分析、市場規模・予測、動向、成長促進要因、課題、約25のベンダーを網羅したベンダー分析などを掲載しています。
現在の市場シナリオ、最新動向と促進要因、市場環境全体に関する最新分析を提供しています。市場は、高齢化人口の増加によるマルチビタミンとミネラルのサプリメントの採用増加、生活習慣病予防策の採用増加、小売スペースの拡大などが牽引しています。
| 市場範囲 | |
|---|---|
| 基準年 | 2024 |
| 終了年 | 2028 |
| 予測期間 | 2024-2028 |
| 成長モメンタム | 加速 |
| 前年比2024年 | 4.23% |
| CAGR | 4.5% |
| 増分額 | 29億7,880万米ドル |
本調査では、今後数年間のマルチビタミンとミネラルのサプリメント市場成長を牽引する主な要因の一つとして、製品発売数の増加を挙げています。また、プライベートブランド製品の人気の高まりや、カスタマイズされたマルチビタミンとミネラルサプリメントの出現は、市場の大きな需要につながります。
目次
第1章 エグゼクティブサマリー
- 市場概要
第2章 市場情勢
- 市場エコシステム
- 市場の特徴
- バリューチェーン分析
第3章 市場規模の評価
- 市場の定義
- 市場セグメント分析
- 市場規模 2023
- 市場の見通し 2023-2028
第4章 市場規模実績
- 世界マルチビタミンとミネラルのサプリメント市場 2018-2022
- 用途別セグメント分析 2018-2022
- 地域別セグメント分析 2018-2022
- 国別セグメント分析 2018-2022
第5章 ファイブフォース分析
- ファイブフォースの要約
- 買い手の交渉力
- 供給企業の交渉力
- 新規参入業者の脅威
- 代替品の脅威
- 競争の脅威
- 市況
第6章 市場セグメンテーション:用途別
- 市場セグメンテーション
- 比較:用途別
- 目の健康サプリメント:市場規模と予測 2023-2028
- 骨と関節のサプリメント:市場規模と予測 2023-2028
- 心臓の健康サプリメント:市場規模と予測 2023-2028
- その他のサプリメント:市場規模と予測 2023-2028
- 市場機会:用途別
第7章 顧客情勢
- 顧客情勢の概要
第8章 地域別情勢
- 地域別セグメンテーション
- 地域別比較
- 北米:市場規模と予測 2023-2028
- 欧州:市場規模と予測 2023-2028
- アジア:市場規模と予測 2023-2028
- 世界のその他の地域:市場規模と予測 2023-2028
- 米国:市場規模と予測 2023-2028
- 英国:市場規模と予測 2023-2028
- ドイツ:市場規模と予測 2023-2028
- 中国:市場規模と予測 2023-2028
- 日本:市場規模と予測 2023-2028
- 市場機会:地域情勢別
第9章 促進要因・課題・機会・抑制要因
- 市場促進要因
- 市場の課題
- 促進要因と課題の影響
- 市場の機会・抑制要因
第10章 競合情勢
- 概要
- 競合情勢
- 混乱の状況
- 業界のリスク
第11章 競合分析
- 企業プロファイル
- 企業の市場ポジショニング
- Abbott Laboratories
- Amway Corp.
- Archer Daniels Midland Co.
- BASF SE
- Bayer AG
- Glanbia plc
- International Flavors and Fragrances Inc.
- Otsuka Pharmaceutical Co. Ltd.
- Pfizer Inc.
- Pharmavite LLC
第12章 付録
Exhibits:
- Exhibits1: Executive Summary - Chart on Market Overview
- Exhibits2: Executive Summary - Data Table on Market Overview
- Exhibits3: Executive Summary - Chart on Global Market Characteristics
- Exhibits4: Executive Summary - Chart on Market By Geographical Landscape
- Exhibits5: Executive Summary - Chart on Market Segmentation by Application
- Exhibits6: Executive Summary - Chart on Incremental Growth
- Exhibits7: Executive Summary - Data Table on Incremental Growth
- Exhibits8: Executive Summary - Chart on Company Market Positioning
- Exhibits9: Parent Market
- Exhibits10: Data Table on - Parent Market
- Exhibits11: Market characteristics analysis
- Exhibits12: Value Chain Analysis
- Exhibits13: Offerings of companies included in the market definition
- Exhibits14: Market segments
- Exhibits15: Chart on Global - Market size and forecast 2023-2028 ($ million)
- Exhibits16: Data Table on Global - Market size and forecast 2023-2028 ($ million)
- Exhibits17: Chart on Global Market: Year-over-year growth 2023-2028 (%)
- Exhibits18: Data Table on Global Market: Year-over-year growth 2023-2028 (%)
- Exhibits19: Historic Market Size - Data Table on Global Multivitamin And Mineral Supplements Market 2018 - 2022 ($ million)
- Exhibits20: Historic Market Size - Application Segment 2018 - 2022 ($ million)
- Exhibits21: Historic Market Size - Geography Segment 2018 - 2022 ($ million)
- Exhibits22: Historic Market Size - Country Segment 2018 - 2022 ($ million)
- Exhibits23: Five forces analysis - Comparison between 2023 and 2028
- Exhibits24: Bargaining power of buyers - Impact of key factors 2023 and 2028
- Exhibits25: Bargaining power of suppliers - Impact of key factors in 2023 and 2028
- Exhibits26: Threat of new entrants - Impact of key factors in 2023 and 2028
- Exhibits27: Threat of substitutes - Impact of key factors in 2023 and 2028
- Exhibits28: Threat of rivalry - Impact of key factors in 2023 and 2028
- Exhibits29: Chart on Market condition - Five forces 2023 and 2028
- Exhibits30: Chart on Application - Market share 2023-2028 (%)
- Exhibits31: Data Table on Application - Market share 2023-2028 (%)
- Exhibits32: Chart on Comparison by Application
- Exhibits33: Data Table on Comparison by Application
- Exhibits34: Chart on Eye health supplements - Market size and forecast 2023-2028 ($ million)
- Exhibits35: Data Table on Eye health supplements - Market size and forecast 2023-2028 ($ million)
- Exhibits36: Chart on Eye health supplements - Year-over-year growth 2023-2028 (%)
- Exhibits37: Data Table on Eye health supplements - Year-over-year growth 2023-2028 (%)
- Exhibits38: Chart on Bone and joint supplements - Market size and forecast 2023-2028 ($ million)
- Exhibits39: Data Table on Bone and joint supplements - Market size and forecast 2023-2028 ($ million)
- Exhibits40: Chart on Bone and joint supplements - Year-over-year growth 2023-2028 (%)
- Exhibits41: Data Table on Bone and joint supplements - Year-over-year growth 2023-2028 (%)
- Exhibits42: Chart on Heart health supplements - Market size and forecast 2023-2028 ($ million)
- Exhibits43: Data Table on Heart health supplements - Market size and forecast 2023-2028 ($ million)
- Exhibits44: Chart on Heart health supplements - Year-over-year growth 2023-2028 (%)
- Exhibits45: Data Table on Heart health supplements - Year-over-year growth 2023-2028 (%)
- Exhibits46: Chart on Other supplements - Market size and forecast 2023-2028 ($ million)
- Exhibits47: Data Table on Other supplements - Market size and forecast 2023-2028 ($ million)
- Exhibits48: Chart on Other supplements - Year-over-year growth 2023-2028 (%)
- Exhibits49: Data Table on Other supplements - Year-over-year growth 2023-2028 (%)
- Exhibits50: Market opportunity by Application ($ million)
- Exhibits51: Data Table on Market opportunity by Application ($ million)
- Exhibits52: Analysis of price sensitivity, lifecycle, customer purchase basket, adoption rates, and purchase criteria
- Exhibits53: Chart on Market share By Geographical Landscape 2023-2028 (%)
- Exhibits54: Data Table on Market share By Geographical Landscape 2023-2028 (%)
- Exhibits55: Chart on Geographic comparison
- Exhibits56: Data Table on Geographic comparison
- Exhibits57: Chart on North America - Market size and forecast 2023-2028 ($ million)
- Exhibits58: Data Table on North America - Market size and forecast 2023-2028 ($ million)
- Exhibits59: Chart on North America - Year-over-year growth 2023-2028 (%)
- Exhibits60: Data Table on North America - Year-over-year growth 2023-2028 (%)
- Exhibits61: Chart on Europe - Market size and forecast 2023-2028 ($ million)
- Exhibits62: Data Table on Europe - Market size and forecast 2023-2028 ($ million)
- Exhibits63: Chart on Europe - Year-over-year growth 2023-2028 (%)
- Exhibits64: Data Table on Europe - Year-over-year growth 2023-2028 (%)
- Exhibits65: Chart on Asia - Market size and forecast 2023-2028 ($ million)
- Exhibits66: Data Table on Asia - Market size and forecast 2023-2028 ($ million)
- Exhibits67: Chart on Asia - Year-over-year growth 2023-2028 (%)
- Exhibits68: Data Table on Asia - Year-over-year growth 2023-2028 (%)
- Exhibits69: Chart on Rest of World (ROW) - Market size and forecast 2023-2028 ($ million)
- Exhibits70: Data Table on Rest of World (ROW) - Market size and forecast 2023-2028 ($ million)
- Exhibits71: Chart on Rest of World (ROW) - Year-over-year growth 2023-2028 (%)
- Exhibits72: Data Table on Rest of World (ROW) - Year-over-year growth 2023-2028 (%)
- Exhibits73: Chart on US - Market size and forecast 2023-2028 ($ million)
- Exhibits74: Data Table on US - Market size and forecast 2023-2028 ($ million)
- Exhibits75: Chart on US - Year-over-year growth 2023-2028 (%)
- Exhibits76: Data Table on US - Year-over-year growth 2023-2028 (%)
- Exhibits77: Chart on UK - Market size and forecast 2023-2028 ($ million)
- Exhibits78: Data Table on UK - Market size and forecast 2023-2028 ($ million)
- Exhibits79: Chart on UK - Year-over-year growth 2023-2028 (%)
- Exhibits80: Data Table on UK - Year-over-year growth 2023-2028 (%)
- Exhibits81: Chart on Germany - Market size and forecast 2023-2028 ($ million)
- Exhibits82: Data Table on Germany - Market size and forecast 2023-2028 ($ million)
- Exhibits83: Chart on Germany - Year-over-year growth 2023-2028 (%)
- Exhibits84: Data Table on Germany - Year-over-year growth 2023-2028 (%)
- Exhibits85: Chart on China - Market size and forecast 2023-2028 ($ million)
- Exhibits86: Data Table on China - Market size and forecast 2023-2028 ($ million)
- Exhibits87: Chart on China - Year-over-year growth 2023-2028 (%)
- Exhibits88: Data Table on China - Year-over-year growth 2023-2028 (%)
- Exhibits89: Chart on Japan - Market size and forecast 2023-2028 ($ million)
- Exhibits90: Data Table on Japan - Market size and forecast 2023-2028 ($ million)
- Exhibits91: Chart on Japan - Year-over-year growth 2023-2028 (%)
- Exhibits92: Data Table on Japan - Year-over-year growth 2023-2028 (%)
- Exhibits93: Market opportunity By Geographical Landscape ($ million)
- Exhibits94: Data Tables on Market opportunity By Geographical Landscape ($ million)
- Exhibits95: Impact of drivers and challenges in 2023 and 2028
- Exhibits96: Overview on criticality of inputs and factors of differentiation
- Exhibits97: Overview on factors of disruption
- Exhibits98: Impact of key risks on business
- Exhibits99: Companies covered
- Exhibits100: Matrix on companies position and classification
- Exhibits101: Abbott Laboratories - Overview
- Exhibits102: Abbott Laboratories - Business segments
- Exhibits103: Abbott Laboratories - Key news
- Exhibits104: Abbott Laboratories - Key offerings
- Exhibits105: Abbott Laboratories - Segment focus
- Exhibits106: Amway Corp. - Overview
- Exhibits107: Amway Corp. - Product / Service
- Exhibits108: Amway Corp. - Key news
- Exhibits109: Amway Corp. - Key offerings
- Exhibits110: Archer Daniels Midland Co. - Overview
- Exhibits111: Archer Daniels Midland Co. - Business segments
- Exhibits112: Archer Daniels Midland Co. - Key news
- Exhibits113: Archer Daniels Midland Co. - Key offerings
- Exhibits114: Archer Daniels Midland Co. - Segment focus
- Exhibits115: BASF SE - Overview
- Exhibits116: BASF SE - Business segments
- Exhibits117: BASF SE - Key news
- Exhibits118: BASF SE - Key offerings
- Exhibits119: BASF SE - Segment focus
- Exhibits120: Bayer AG - Overview
- Exhibits121: Bayer AG - Business segments
- Exhibits122: Bayer AG - Key news
- Exhibits123: Bayer AG - Key offerings
- Exhibits124: Bayer AG - Segment focus
- Exhibits125: Glanbia plc - Overview
- Exhibits126: Glanbia plc - Business segments
- Exhibits127: Glanbia plc - Key news
- Exhibits128: Glanbia plc - Key offerings
- Exhibits129: Glanbia plc - Segment focus
- Exhibits130: International Flavors and Fragrances Inc. - Overview
- Exhibits131: International Flavors and Fragrances Inc. - Business segments
- Exhibits132: International Flavors and Fragrances Inc. - Key news
- Exhibits133: International Flavors and Fragrances Inc. - Key offerings
- Exhibits134: International Flavors and Fragrances Inc. - Segment focus
- Exhibits135: Otsuka Pharmaceutical Co. Ltd. - Overview
- Exhibits136: Otsuka Pharmaceutical Co. Ltd. - Product / Service
- Exhibits137: Otsuka Pharmaceutical Co. Ltd. - Key offerings
- Exhibits138: Pfizer Inc. - Overview
- Exhibits139: Pfizer Inc. - Product / Service
- Exhibits140: Pfizer Inc. - Key news
- Exhibits141: Pfizer Inc. - Key offerings
- Exhibits142: Pharmavite LLC - Overview
- Exhibits143: Pharmavite LLC - Product / Service
- Exhibits144: Pharmavite LLC - Key offerings
- Exhibits145: Inclusions checklist
- Exhibits146: Exclusions checklist
- Exhibits147: Currency conversion rates for US$
- Exhibits148: Research methodology
- Exhibits149: Information sources
- Exhibits150: Data validation
- Exhibits151: Validation techniques employed for market sizing
- Exhibits152: Data synthesis
- Exhibits153: 360 degree market analysis
- Exhibits154: List of abbreviations
The multivitamin and mineral supplements market is forecasted to grow by USD 2978.8 mn during 2023-2028, accelerating at a CAGR of 4.5% during the forecast period. The report on the multivitamin and mineral supplements market provides a holistic analysis, market size and forecast, trends, growth drivers, and challenges, as well as vendor analysis covering around 25 vendors.
The report offers an up-to-date analysis regarding the current market scenario, the latest trends and drivers, and the overall market environment. The market is driven by increasing adoption of multivitamin and mineral supplements by growing aging population, increasing adoption of preventive measures for lifestyle-related diseases, and expanding retail space.
Technavio's multivitamin and mineral supplements market is segmented as below:
| Market Scope | |
|---|---|
| Base Year | 2024 |
| End Year | 2028 |
| Series Year | 2024-2028 |
| Growth Momentum | Accelerate |
| YOY 2024 | 4.23% |
| CAGR | 4.5% |
| Incremental Value | $2978.8mn |
By Application
- Eye health supplements
- Bone and joint supplements
- Heart health supplements
- Other supplements
By Geographical Landscape
- North America
- Europe
- Asia
- Rest of World (ROW)
This study identifies the increasing number of product launches as one of the prime reasons driving the multivitamin and mineral supplements market growth during the next few years. Also, growing popularity of private-label brands and emergence of customized multivitamin and mineral supplement offerings will lead to sizable demand in the market.
The report on the multivitamin and mineral supplements market covers the following areas:
- Multivitamin and mineral supplements market sizing
- Multivitamin and mineral supplements market forecast
- Multivitamin and mineral supplements market industry analysis
The robust vendor analysis is designed to help clients improve their market position, and in line with this, this report provides a detailed analysis of several leading multivitamin and mineral supplements market vendors that include Abbott Laboratories, Amway Corp., Archer Daniels Midland Co., BASF SE, Bausch Health Companies Inc., Bayer AG, Cargill Inc., Glanbia plc, Innophos Holdings Inc., International Flavors and Fragrances Inc., Kappa Ingredients GmbH, Natures Bounty, New Chapter Inc., Otsuka Pharmaceutical Co. Ltd., Pfizer Inc., Pharmavite LLC, Pinnacle Health Nutrition Ltd., Reckitt Benckiser Group Plc, Swisse Wellness Pty Ltd., and ZeaVision LLC. Also, the multivitamin and mineral supplements market analysis report includes information on upcoming trends and challenges that will influence market growth. This is to help companies strategize and leverage all forthcoming growth opportunities.
The study was conducted using an objective combination of primary and secondary information including inputs from key participants in the industry. The report contains a comprehensive market and vendor landscape in addition to an analysis of the key vendors.
The publisher presents a detailed picture of the market by the way of study, synthesis, and summation of data from multiple sources by an analysis of key parameters such as profit, pricing, competition, and promotions. It presents various market facets by identifying the key industry influencers. The data presented is comprehensive, reliable, and a result of extensive research - both primary and secondary. The market research reports provide a complete competitive landscape and an in-depth vendor selection methodology and analysis using qualitative and quantitative research to forecast the accurate market growth.
Table of Contents
1 Executive Summary
- 1.1 Market overview
- Executive Summary - Chart on Market Overview
- Executive Summary - Data Table on Market Overview
- Executive Summary - Chart on Global Market Characteristics
- Executive Summary - Chart on Market By Geographical Landscape
- Executive Summary - Chart on Market Segmentation by Application
- Executive Summary - Chart on Incremental Growth
- Executive Summary - Data Table on Incremental Growth
- Executive Summary - Chart on Company Market Positioning
2 Market Landscape
- 2.1 Market ecosystem
- Parent Market
- Data Table on - Parent Market
- 2.2 Market characteristics
- Market characteristics analysis
- 2.3 Value chain analysis
- Value Chain Analysis
3 Market Sizing
- 3.1 Market definition
- Offerings of companies included in the market definition
- 3.2 Market segment analysis
- Market segments
- 3.3 Market size 2023
- 3.4 Market outlook: Forecast for 2023-2028
- Chart on Global - Market size and forecast 2023-2028 ($ million)
- Data Table on Global - Market size and forecast 2023-2028 ($ million)
- Chart on Global Market: Year-over-year growth 2023-2028 (%)
- Data Table on Global Market: Year-over-year growth 2023-2028 (%)
4 Historic Market Size
- 4.1 Global Multivitamin And Mineral Supplements Market 2018 - 2022
- Historic Market Size - Data Table on Global Multivitamin And Mineral Supplements Market 2018 - 2022 ($ million)
- 4.2 Application segment analysis 2018 - 2022
- Historic Market Size - Application Segment 2018 - 2022 ($ million)
- 4.3 Geography segment analysis 2018 - 2022
- Historic Market Size - Geography Segment 2018 - 2022 ($ million)
- 4.4 Country segment analysis 2018 - 2022
- Historic Market Size - Country Segment 2018 - 2022 ($ million)
5 Five Forces Analysis
- 5.1 Five forces summary
- Five forces analysis - Comparison between 2023 and 2028
- 5.2 Bargaining power of buyers
- Bargaining power of buyers - Impact of key factors 2023 and 2028
- 5.3 Bargaining power of suppliers
- Bargaining power of suppliers - Impact of key factors in 2023 and 2028
- 5.4 Threat of new entrants
- Threat of new entrants - Impact of key factors in 2023 and 2028
- 5.5 Threat of substitutes
- Threat of substitutes - Impact of key factors in 2023 and 2028
- 5.6 Threat of rivalry
- Threat of rivalry - Impact of key factors in 2023 and 2028
- 5.7 Market condition
- Chart on Market condition - Five forces 2023 and 2028
6 Market Segmentation by Application
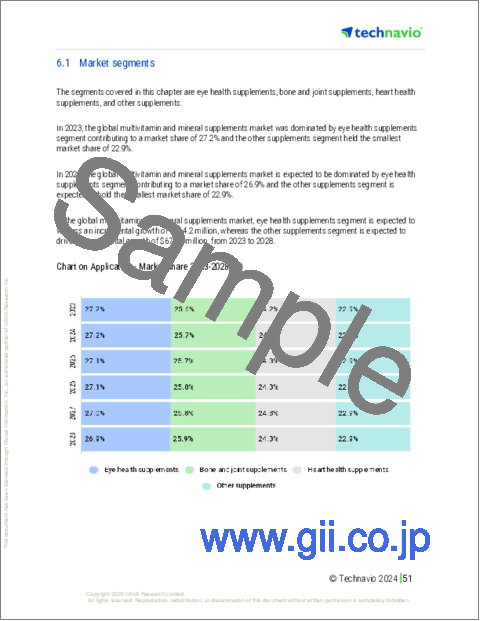
- 6.1 Market segments
- Chart on Application - Market share 2023-2028 (%)
- Data Table on Application - Market share 2023-2028 (%)
- 6.2 Comparison by Application
- Chart on Comparison by Application
- Data Table on Comparison by Application
- 6.3 Eye health supplements - Market size and forecast 2023-2028
- Chart on Eye health supplements - Market size and forecast 2023-2028 ($ million)
- Data Table on Eye health supplements - Market size and forecast 2023-2028 ($ million)
- Chart on Eye health supplements - Year-over-year growth 2023-2028 (%)
- Data Table on Eye health supplements - Year-over-year growth 2023-2028 (%)
- 6.4 Bone and joint supplements - Market size and forecast 2023-2028
- Chart on Bone and joint supplements - Market size and forecast 2023-2028 ($ million)
- Data Table on Bone and joint supplements - Market size and forecast 2023-2028 ($ million)
- Chart on Bone and joint supplements - Year-over-year growth 2023-2028 (%)
- Data Table on Bone and joint supplements - Year-over-year growth 2023-2028 (%)
- 6.5 Heart health supplements - Market size and forecast 2023-2028
- Chart on Heart health supplements - Market size and forecast 2023-2028 ($ million)
- Data Table on Heart health supplements - Market size and forecast 2023-2028 ($ million)
- Chart on Heart health supplements - Year-over-year growth 2023-2028 (%)
- Data Table on Heart health supplements - Year-over-year growth 2023-2028 (%)
- 6.6 Other supplements - Market size and forecast 2023-2028
- Chart on Other supplements - Market size and forecast 2023-2028 ($ million)
- Data Table on Other supplements - Market size and forecast 2023-2028 ($ million)
- Chart on Other supplements - Year-over-year growth 2023-2028 (%)
- Data Table on Other supplements - Year-over-year growth 2023-2028 (%)
- 6.7 Market opportunity by Application
- Market opportunity by Application ($ million)
- Data Table on Market opportunity by Application ($ million)
7 Customer Landscape
- 7.1 Customer landscape overview
- Analysis of price sensitivity, lifecycle, customer purchase basket, adoption rates, and purchase criteria
8 Geographic Landscape
- 8.1 Geographic segmentation
- Chart on Market share By Geographical Landscape 2023-2028 (%)
- Data Table on Market share By Geographical Landscape 2023-2028 (%)
- 8.2 Geographic comparison
- Chart on Geographic comparison
- Data Table on Geographic comparison
- 8.3 North America - Market size and forecast 2023-2028
- Chart on North America - Market size and forecast 2023-2028 ($ million)
- Data Table on North America - Market size and forecast 2023-2028 ($ million)
- Chart on North America - Year-over-year growth 2023-2028 (%)
- Data Table on North America - Year-over-year growth 2023-2028 (%)
- 8.4 Europe - Market size and forecast 2023-2028
- Chart on Europe - Market size and forecast 2023-2028 ($ million)
- Data Table on Europe - Market size and forecast 2023-2028 ($ million)
- Chart on Europe - Year-over-year growth 2023-2028 (%)
- Data Table on Europe - Year-over-year growth 2023-2028 (%)
- 8.5 Asia - Market size and forecast 2023-2028
- Chart on Asia - Market size and forecast 2023-2028 ($ million)
- Data Table on Asia - Market size and forecast 2023-2028 ($ million)
- Chart on Asia - Year-over-year growth 2023-2028 (%)
- Data Table on Asia - Year-over-year growth 2023-2028 (%)
- 8.6 Rest of World (ROW) - Market size and forecast 2023-2028
- Chart on Rest of World (ROW) - Market size and forecast 2023-2028 ($ million)
- Data Table on Rest of World (ROW) - Market size and forecast 2023-2028 ($ million)
- Chart on Rest of World (ROW) - Year-over-year growth 2023-2028 (%)
- Data Table on Rest of World (ROW) - Year-over-year growth 2023-2028 (%)
- 8.7 US - Market size and forecast 2023-2028
- Chart on US - Market size and forecast 2023-2028 ($ million)
- Data Table on US - Market size and forecast 2023-2028 ($ million)
- Chart on US - Year-over-year growth 2023-2028 (%)
- Data Table on US - Year-over-year growth 2023-2028 (%)
- 8.8 UK - Market size and forecast 2023-2028
- Chart on UK - Market size and forecast 2023-2028 ($ million)
- Data Table on UK - Market size and forecast 2023-2028 ($ million)
- Chart on UK - Year-over-year growth 2023-2028 (%)
- Data Table on UK - Year-over-year growth 2023-2028 (%)
- 8.9 Germany - Market size and forecast 2023-2028
- Chart on Germany - Market size and forecast 2023-2028 ($ million)
- Data Table on Germany - Market size and forecast 2023-2028 ($ million)
- Chart on Germany - Year-over-year growth 2023-2028 (%)
- Data Table on Germany - Year-over-year growth 2023-2028 (%)
- 8.10 China - Market size and forecast 2023-2028
- Chart on China - Market size and forecast 2023-2028 ($ million)
- Data Table on China - Market size and forecast 2023-2028 ($ million)
- Chart on China - Year-over-year growth 2023-2028 (%)
- Data Table on China - Year-over-year growth 2023-2028 (%)
- 8.11 Japan - Market size and forecast 2023-2028
- Chart on Japan - Market size and forecast 2023-2028 ($ million)
- Data Table on Japan - Market size and forecast 2023-2028 ($ million)
- Chart on Japan - Year-over-year growth 2023-2028 (%)
- Data Table on Japan - Year-over-year growth 2023-2028 (%)
- 8.12 Market opportunity By Geographical Landscape
- Market opportunity By Geographical Landscape ($ million)
- Data Tables on Market opportunity By Geographical Landscape ($ million)
9 Drivers, Challenges, and Opportunity/Restraints
- 9.1 Market drivers
- 9.2 Market challenges
- 9.3 Impact of drivers and challenges
- Impact of drivers and challenges in 2023 and 2028
- 9.4 Market opportunities/restraints
10 Competitive Landscape
- 10.1 Overview
- 10.2 Competitive Landscape
- Overview on criticality of inputs and factors of differentiation
- 10.3 Landscape disruption
- Overview on factors of disruption
- 10.4 Industry risks
- Impact of key risks on business
11 Competitive Analysis
- 11.1 Companies profiled
- Companies covered
- 11.2 Market positioning of companies
- Matrix on companies position and classification
- 11.3 Abbott Laboratories
- Abbott Laboratories - Overview
- Abbott Laboratories - Business segments
- Abbott Laboratories - Key news
- Abbott Laboratories - Key offerings
- Abbott Laboratories - Segment focus
- 11.4 Amway Corp.
- Amway Corp. - Overview
- Amway Corp. - Product / Service
- Amway Corp. - Key news
- Amway Corp. - Key offerings
- 11.5 Archer Daniels Midland Co.
- Archer Daniels Midland Co. - Overview
- Archer Daniels Midland Co. - Business segments
- Archer Daniels Midland Co. - Key news
- Archer Daniels Midland Co. - Key offerings
- Archer Daniels Midland Co. - Segment focus
- 11.6 BASF SE
- BASF SE - Overview
- BASF SE - Business segments
- BASF SE - Key news
- BASF SE - Key offerings
- BASF SE - Segment focus
- 11.7 Bayer AG
- Bayer AG - Overview
- Bayer AG - Business segments
- Bayer AG - Key news
- Bayer AG - Key offerings
- Bayer AG - Segment focus
- 11.8 Glanbia plc
- Glanbia plc - Overview
- Glanbia plc - Business segments
- Glanbia plc - Key news
- Glanbia plc - Key offerings
- Glanbia plc - Segment focus
- 11.9 International Flavors and Fragrances Inc.
- International Flavors and Fragrances Inc. - Overview
- International Flavors and Fragrances Inc. - Business segments
- International Flavors and Fragrances Inc. - Key news
- International Flavors and Fragrances Inc. - Key offerings
- International Flavors and Fragrances Inc. - Segment focus
- 11.10 Otsuka Pharmaceutical Co. Ltd.
- Otsuka Pharmaceutical Co. Ltd. - Overview
- Otsuka Pharmaceutical Co. Ltd. - Product / Service
- Otsuka Pharmaceutical Co. Ltd. - Key offerings
- 11.11 Pfizer Inc.
- Pfizer Inc. - Overview
- Pfizer Inc. - Product / Service
- Pfizer Inc. - Key news
- Pfizer Inc. - Key offerings
- 11.12 Pharmavite LLC
- Pharmavite LLC - Overview
- Pharmavite LLC - Product / Service
- Pharmavite LLC - Key offerings
12 Appendix
- 12.1 Scope of the report
- 12.2 Inclusions and exclusions checklist
- Inclusions checklist
- Exclusions checklist
- 12.3 Currency conversion rates for US$
- Currency conversion rates for US$
- 12.4 Research methodology
- Research methodology
- 12.5 Data procurement
- Information sources
- 12.6 Data validation
- Data validation
- 12.7 Validation techniques employed for market sizing
- Validation techniques employed for market sizing
- 12.8 Data synthesis
- Data synthesis
- 12.9 360 degree market analysis
- 360 degree market analysis
- 12.10 List of abbreviations
- List of abbreviations
