|
|
市場調査レポート
商品コード
1517084
電子臨床ソリューションの世界市場 2024-2028Global eClinical solutions market 2024-2028 |
||||||

|
|||||||
カスタマイズ可能
|
|||||||


| 電子臨床ソリューションの世界市場 2024-2028 |
|
出版日: 2024年07月03日
発行: TechNavio
ページ情報: 英文 175 Pages
納期: 即納可能
|

全表示
- 概要
- 図表
- 目次
電子臨床ソリューションの世界市場2024-2028
電子臨床ソリューション市場は2023-2028年に127億6,830万米ドル、予測期間中のCAGRは15.26%で成長すると予測されます。当レポートでは、電子臨床ソリューション市場の全体的な分析、市場規模・予測、動向、成長促進要因、課題、約25のベンダーを網羅したベンダー分析などを掲載しています。
現在の市場シナリオ、最新動向と促進要因、市場環境全体に関する最新分析を提供しています。市場は、医薬品の臨床試験の増加、臨床試験管理システムの採用増加、ヘルスケア向けの統合サービス提供によって牽引されています。
| 市場範囲 | |
|---|---|
| 基準年 | 2024 |
| 終了年 | 2028 |
| 予測期間 | 2024-2028 |
| 成長モメンタム | 加速 |
| 前年比2024年 | 13.43% |
| CAGR | 15.26% |
| 増分額 | 127億6,830万米ドル |
本調査では、今後数年間における電子臨床ソリューション市場の成長を促進する主な要因の1つとして、臨床試験プロセスのアウトソーシングの増加を挙げています。また、クラウドコンピューティングの高い採用率や市場成長を後押しする臨床試験の分散化も、市場の大きな需要につながります。
目次
第1章 エグゼクティブサマリー
- 市場概要
第2章 市場情勢
- 市場エコシステム
- 市場の特徴
- バリューチェーン分析
第3章 市場規模の評価
- 市場の定義
- 市場セグメント分析
- 市場規模 2023
- 市場の見通し 2023-2028
第4章 市場規模実績
- 世界電子臨床ソリューション市場 2018-2022
- エンドユーザー別セグメント分析 2018-2022
- 展開別セグメント分析 2018-2022
- 地域別セグメント分析 2018-2022
- 国別セグメント分析 2018-2022
第5章 ファイブフォース分析
- ファイブフォースの要約
- 買い手の交渉力
- 供給企業の交渉力
- 新規参入業者の脅威
- 代替品の脅威
- 競争の脅威
- 市況
第6章 市場セグメンテーション:エンドユーザー別
- 市場セグメンテーション
- 比較:エンドユーザー別
- 製薬・バイオテクノロジー企業:市場規模と予測 2023-2028
- 委託調査機関:市場規模と予測 2023-2028
- コンサルティングサービス会社:市場規模と予測 2023-2028
- 医療機器メーカー:市場規模と予測 2023-2028
- その他:市場規模と予測 2023-2028
- 市場機会:エンドユーザー別
第7章 市場セグメンテーション:展開別
- 市場セグメンテーション
- 比較:展開別
- クラウドベース:市場規模と予測 2023-2028
- オンプレミス:市場規模と予測 2023-2028
- 市場機会:展開別
第8章 顧客情勢
- 顧客情勢の概要
第9章 地域別情勢
- 地域別セグメンテーション
- 地域別比較
- 北米:市場規模と予測 2023-2028
- 欧州:市場規模と予測 2023-2028
- アジア:市場規模と予測 2023-2028
- 世界のその他の地域:市場規模と予測 2023-2028
- 米国:市場規模と予測 2023-2028
- ドイツ:市場規模と予測 2023-2028
- 英国:市場規模と予測 2023-2028
- 中国:市場規模と予測 2023-2028
- 日本:市場規模と予測 2023-2028
- 市場機会:地域情勢別
第10章 促進要因・課題・機会・抑制要因
- 市場促進要因
- 市場の課題
- 促進要因と課題の影響
- 市場の機会・抑制要因
第11章 競合情勢
- 概要
- 競合情勢
- 混乱の状況
- 業界のリスク
第12章 競合分析
- 企業プロファイル
- 企業の市場ポジショニング
- Anju Software Inc.
- ArisGlobal LLC
- Castor Research Inc.
- Dassault Systemes SE
- DATATRAK International Inc.
- eClinical Solutions LLC.
- eClinicalWorks LLC
- eResearchTechnology GmbH
- International Business Machines Corp.
- MedNet
- Oracle Corp.
- Parexel International Corp.
- Saama Technologies Inc.
- Signant Health
- Veeva Systems Inc.
第13章 付録
Exhibits:
- Exhibits1: Executive Summary - Chart on Market Overview
- Exhibits2: Executive Summary - Data Table on Market Overview
- Exhibits3: Executive Summary - Chart on Global Market Characteristics
- Exhibits4: Executive Summary - Chart on Market By Geographical Landscape
- Exhibits5: Executive Summary - Chart on Market Segmentation by End-user
- Exhibits6: Executive Summary - Chart on Market Segmentation by Deployment
- Exhibits7: Executive Summary - Chart on Incremental Growth
- Exhibits8: Executive Summary - Data Table on Incremental Growth
- Exhibits9: Executive Summary - Chart on Company Market Positioning
- Exhibits10: Parent Market
- Exhibits11: Data Table on - Parent Market
- Exhibits12: Market characteristics analysis
- Exhibits13: Value Chain Analysis
- Exhibits14: Offerings of companies included in the market definition
- Exhibits15: Market segments
- Exhibits16: Chart on Global - Market size and forecast 2023-2028 ($ million)
- Exhibits17: Data Table on Global - Market size and forecast 2023-2028 ($ million)
- Exhibits18: Chart on Global Market: Year-over-year growth 2023-2028 (%)
- Exhibits19: Data Table on Global Market: Year-over-year growth 2023-2028 (%)
- Exhibits20: Historic Market Size - Data Table on Global EClinical Solutions Market 2018 - 2022 ($ million)
- Exhibits21: Historic Market Size - End-user Segment 2018 - 2022 ($ million)
- Exhibits22: Historic Market Size - Deployment Segment 2018 - 2022 ($ million)
- Exhibits23: Historic Market Size - Geography Segment 2018 - 2022 ($ million)
- Exhibits24: Historic Market Size - Country Segment 2018 - 2022 ($ million)
- Exhibits25: Five forces analysis - Comparison between 2023 and 2028
- Exhibits26: Bargaining power of buyers - Impact of key factors 2023 and 2028
- Exhibits27: Bargaining power of suppliers - Impact of key factors in 2023 and 2028
- Exhibits28: Threat of new entrants - Impact of key factors in 2023 and 2028
- Exhibits29: Threat of substitutes - Impact of key factors in 2023 and 2028
- Exhibits30: Threat of rivalry - Impact of key factors in 2023 and 2028
- Exhibits31: Chart on Market condition - Five forces 2023 and 2028
- Exhibits32: Chart on End-user - Market share 2023-2028 (%)
- Exhibits33: Data Table on End-user - Market share 2023-2028 (%)
- Exhibits34: Chart on Comparison by End-user
- Exhibits35: Data Table on Comparison by End-user
- Exhibits36: Chart on Pharmaceutical and biotechnology companies - Market size and forecast 2023-2028 ($ million)
- Exhibits37: Data Table on Pharmaceutical and biotechnology companies - Market size and forecast 2023-2028 ($ million)
- Exhibits38: Chart on Pharmaceutical and biotechnology companies - Year-over-year growth 2023-2028 (%)
- Exhibits39: Data Table on Pharmaceutical and biotechnology companies - Year-over-year growth 2023-2028 (%)
- Exhibits40: Chart on Contract research organizations - Market size and forecast 2023-2028 ($ million)
- Exhibits41: Data Table on Contract research organizations - Market size and forecast 2023-2028 ($ million)
- Exhibits42: Chart on Contract research organizations - Year-over-year growth 2023-2028 (%)
- Exhibits43: Data Table on Contract research organizations - Year-over-year growth 2023-2028 (%)
- Exhibits44: Chart on Consulting service companies - Market size and forecast 2023-2028 ($ million)
- Exhibits45: Data Table on Consulting service companies - Market size and forecast 2023-2028 ($ million)
- Exhibits46: Chart on Consulting service companies - Year-over-year growth 2023-2028 (%)
- Exhibits47: Data Table on Consulting service companies - Year-over-year growth 2023-2028 (%)
- Exhibits48: Chart on Medical device manufacturers - Market size and forecast 2023-2028 ($ million)
- Exhibits49: Data Table on Medical device manufacturers - Market size and forecast 2023-2028 ($ million)
- Exhibits50: Chart on Medical device manufacturers - Year-over-year growth 2023-2028 (%)
- Exhibits51: Data Table on Medical device manufacturers - Year-over-year growth 2023-2028 (%)
- Exhibits52: Chart on Others - Market size and forecast 2023-2028 ($ million)
- Exhibits53: Data Table on Others - Market size and forecast 2023-2028 ($ million)
- Exhibits54: Chart on Others - Year-over-year growth 2023-2028 (%)
- Exhibits55: Data Table on Others - Year-over-year growth 2023-2028 (%)
- Exhibits56: Market opportunity by End-user ($ million)
- Exhibits57: Data Table on Market opportunity by End-user ($ million)
- Exhibits58: Chart on Deployment - Market share 2023-2028 (%)
- Exhibits59: Data Table on Deployment - Market share 2023-2028 (%)
- Exhibits60: Chart on Comparison by Deployment
- Exhibits61: Data Table on Comparison by Deployment
- Exhibits62: Chart on Cloud-based - Market size and forecast 2023-2028 ($ million)
- Exhibits63: Data Table on Cloud-based - Market size and forecast 2023-2028 ($ million)
- Exhibits64: Chart on Cloud-based - Year-over-year growth 2023-2028 (%)
- Exhibits65: Data Table on Cloud-based - Year-over-year growth 2023-2028 (%)
- Exhibits66: Chart on On-premises - Market size and forecast 2023-2028 ($ million)
- Exhibits67: Data Table on On-premises - Market size and forecast 2023-2028 ($ million)
- Exhibits68: Chart on On-premises - Year-over-year growth 2023-2028 (%)
- Exhibits69: Data Table on On-premises - Year-over-year growth 2023-2028 (%)
- Exhibits70: Market opportunity by Deployment ($ million)
- Exhibits71: Data Table on Market opportunity by Deployment ($ million)
- Exhibits72: Analysis of price sensitivity, lifecycle, customer purchase basket, adoption rates, and purchase criteria
- Exhibits73: Chart on Market share By Geographical Landscape 2023-2028 (%)
- Exhibits74: Data Table on Market share By Geographical Landscape 2023-2028 (%)
- Exhibits75: Chart on Geographic comparison
- Exhibits76: Data Table on Geographic comparison
- Exhibits77: Chart on North America - Market size and forecast 2023-2028 ($ million)
- Exhibits78: Data Table on North America - Market size and forecast 2023-2028 ($ million)
- Exhibits79: Chart on North America - Year-over-year growth 2023-2028 (%)
- Exhibits80: Data Table on North America - Year-over-year growth 2023-2028 (%)
- Exhibits81: Chart on Europe - Market size and forecast 2023-2028 ($ million)
- Exhibits82: Data Table on Europe - Market size and forecast 2023-2028 ($ million)
- Exhibits83: Chart on Europe - Year-over-year growth 2023-2028 (%)
- Exhibits84: Data Table on Europe - Year-over-year growth 2023-2028 (%)
- Exhibits85: Chart on Asia - Market size and forecast 2023-2028 ($ million)
- Exhibits86: Data Table on Asia - Market size and forecast 2023-2028 ($ million)
- Exhibits87: Chart on Asia - Year-over-year growth 2023-2028 (%)
- Exhibits88: Data Table on Asia - Year-over-year growth 2023-2028 (%)
- Exhibits89: Chart on Rest of World (ROW) - Market size and forecast 2023-2028 ($ million)
- Exhibits90: Data Table on Rest of World (ROW) - Market size and forecast 2023-2028 ($ million)
- Exhibits91: Chart on Rest of World (ROW) - Year-over-year growth 2023-2028 (%)
- Exhibits92: Data Table on Rest of World (ROW) - Year-over-year growth 2023-2028 (%)
- Exhibits93: Chart on US - Market size and forecast 2023-2028 ($ million)
- Exhibits94: Data Table on US - Market size and forecast 2023-2028 ($ million)
- Exhibits95: Chart on US - Year-over-year growth 2023-2028 (%)
- Exhibits96: Data Table on US - Year-over-year growth 2023-2028 (%)
- Exhibits97: Chart on Germany - Market size and forecast 2023-2028 ($ million)
- Exhibits98: Data Table on Germany - Market size and forecast 2023-2028 ($ million)
- Exhibits99: Chart on Germany - Year-over-year growth 2023-2028 (%)
- Exhibits100: Data Table on Germany - Year-over-year growth 2023-2028 (%)
- Exhibits101: Chart on UK - Market size and forecast 2023-2028 ($ million)
- Exhibits102: Data Table on UK - Market size and forecast 2023-2028 ($ million)
- Exhibits103: Chart on UK - Year-over-year growth 2023-2028 (%)
- Exhibits104: Data Table on UK - Year-over-year growth 2023-2028 (%)
- Exhibits105: Chart on China - Market size and forecast 2023-2028 ($ million)
- Exhibits106: Data Table on China - Market size and forecast 2023-2028 ($ million)
- Exhibits107: Chart on China - Year-over-year growth 2023-2028 (%)
- Exhibits108: Data Table on China - Year-over-year growth 2023-2028 (%)
- Exhibits109: Chart on Japan - Market size and forecast 2023-2028 ($ million)
- Exhibits110: Data Table on Japan - Market size and forecast 2023-2028 ($ million)
- Exhibits111: Chart on Japan - Year-over-year growth 2023-2028 (%)
- Exhibits112: Data Table on Japan - Year-over-year growth 2023-2028 (%)
- Exhibits113: Market opportunity By Geographical Landscape ($ million)
- Exhibits114: Data Tables on Market opportunity By Geographical Landscape ($ million)
- Exhibits115: Impact of drivers and challenges in 2023 and 2028
- Exhibits116: Overview on criticality of inputs and factors of differentiation
- Exhibits117: Overview on factors of disruption
- Exhibits118: Impact of key risks on business
- Exhibits119: Companies covered
- Exhibits120: Matrix on companies position and classification
- Exhibits121: Anju Software Inc. - Overview
- Exhibits122: Anju Software Inc. - Product / Service
- Exhibits123: Anju Software Inc. - Key offerings
- Exhibits124: ArisGlobal LLC - Overview
- Exhibits125: ArisGlobal LLC - Product / Service
- Exhibits126: ArisGlobal LLC - Key offerings
- Exhibits127: Castor Research Inc. - Overview
- Exhibits128: Castor Research Inc. - Product / Service
- Exhibits129: Castor Research Inc. - Key offerings
- Exhibits130: Dassault Systemes SE - Overview
- Exhibits131: Dassault Systemes SE - Product / Service
- Exhibits132: Dassault Systemes SE - Key news
- Exhibits133: Dassault Systemes SE - Key offerings
- Exhibits134: DATATRAK International Inc. - Overview
- Exhibits135: DATATRAK International Inc. - Product / Service
- Exhibits136: DATATRAK International Inc. - Key offerings
- Exhibits137: eClinical Solutions LLC. - Overview
- Exhibits138: eClinical Solutions LLC. - Product / Service
- Exhibits139: eClinical Solutions LLC. - Key offerings
- Exhibits140: eClinicalWorks LLC - Overview
- Exhibits141: eClinicalWorks LLC - Product / Service
- Exhibits142: eClinicalWorks LLC - Key offerings
- Exhibits143: eResearchTechnology GmbH - Overview
- Exhibits144: eResearchTechnology GmbH - Product / Service
- Exhibits145: eResearchTechnology GmbH - Key offerings
- Exhibits146: International Business Machines Corp. - Overview
- Exhibits147: International Business Machines Corp. - Business segments
- Exhibits148: International Business Machines Corp. - Key news
- Exhibits149: International Business Machines Corp. - Key offerings
- Exhibits150: International Business Machines Corp. - Segment focus
- Exhibits151: MedNet - Overview
- Exhibits152: MedNet - Product / Service
- Exhibits153: MedNet - Key offerings
- Exhibits154: Oracle Corp. - Overview
- Exhibits155: Oracle Corp. - Business segments
- Exhibits156: Oracle Corp. - Key news
- Exhibits157: Oracle Corp. - Key offerings
- Exhibits158: Oracle Corp. - Segment focus
- Exhibits159: Parexel International Corp. - Overview
- Exhibits160: Parexel International Corp. - Product / Service
- Exhibits161: Parexel International Corp. - Key offerings
- Exhibits162: Saama Technologies Inc. - Overview
- Exhibits163: Saama Technologies Inc. - Product / Service
- Exhibits164: Saama Technologies Inc. - Key offerings
- Exhibits165: Signant Health - Overview
- Exhibits166: Signant Health - Product / Service
- Exhibits167: Signant Health - Key offerings
- Exhibits168: Veeva Systems Inc. - Overview
- Exhibits169: Veeva Systems Inc. - Business segments
- Exhibits170: Veeva Systems Inc. - Key offerings
- Exhibits171: Veeva Systems Inc. - Segment focus
- Exhibits172: Inclusions checklist
- Exhibits173: Exclusions checklist
- Exhibits174: Currency conversion rates for US$
- Exhibits175: Research methodology
- Exhibits176: Information sources
- Exhibits177: Data validation
- Exhibits178: Validation techniques employed for market sizing
- Exhibits179: Data synthesis
- Exhibits180: 360 degree market analysis
- Exhibits181: List of abbreviations
Global E-clinical Solutions Market 2024-2028
The eclinical solutions market is forecasted to grow by USD 12768.3 mn during 2023-2028, accelerating at a CAGR of 15.26% during the forecast period. The report on the eclinical solutions market provides a holistic analysis, market size and forecast, trends, growth drivers, and challenges, as well as vendor analysis covering around 25 vendors.
The report offers an up-to-date analysis regarding the current market scenario, the latest trends and drivers, and the overall market environment. The market is driven by rise in clinical trials for drugs, increased adoption of clinical trial management systems, and integrated service offerings for healthcare.
| Market Scope | |
|---|---|
| Base Year | 2024 |
| End Year | 2028 |
| Series Year | 2024-2028 |
| Growth Momentum | Accelerate |
| YOY 2024 | 13.43% |
| CAGR | 15.26% |
| Incremental Value | $12768.3mn |
Technavio's eclinical solutions market is segmented as below:
By End-user
- Pharmaceutical and biotechnology companies
- Contract research organizations
- Consulting service companies
- Medical device manufacturers
- Others
By Deployment
- Cloud-based
- On-premises
By Geographical Landscape
- North America
- Europe
- Asia
- Rest of World (ROW)
This study identifies the increasing outsourcing of clinical trial processes as one of the prime reasons driving the eclinical solutions market growth during the next few years. Also, high adoption of cloud computing and increasing decentralized clinical trials boosting market growth will lead to sizable demand in the market.
The report on the eclinical solutions market covers the following areas:
- Eclinical solutions market sizing
- Eclinical solutions market forecast
- Eclinical solutions market industry analysis
The robust vendor analysis is designed to help clients improve their market position, and in line with this, this report provides a detailed analysis of several leading eclinical solutions market vendors that include Advarra Inc., Aixial, Anju Software Inc., ArisGlobal LLC, Castor Research Inc., Dassault Systemes SE, DATATRAK International Inc., eClinical Solutions LLC., eClinicalWorks LLC, eResearchTechnology GmbH, International Business Machines Corp., MedNet, Medrio Inc., OpenClinica LLC, Oracle Corp., Parexel International Corp., Saama Technologies Inc., Signant Health, Veeva Systems Inc., and YPrime LLC. Also, the eclinical solutions market analysis report includes information on upcoming trends and challenges that will influence market growth. This is to help companies strategize and leverage all forthcoming growth opportunities.
The study was conducted using an objective combination of primary and secondary information including inputs from key participants in the industry. The report contains a comprehensive market and vendor landscape in addition to an analysis of the key vendors.
The publisher presents a detailed picture of the market by the way of study, synthesis, and summation of data from multiple sources by an analysis of key parameters such as profit, pricing, competition, and promotions. IT presents various market facets by identifying the key industry influencers. The data presented is comprehensive, reliable, and a result of extensive research - both primary and secondary. The market research reports provide a complete competitive landscape and an in-depth vendor selection methodology and analysis using qualitative and quantitative research to forecast the accurate market growth.
Table of Contents
1 Executive Summary
- 1.1 Market overview
- Executive Summary - Chart on Market Overview
- Executive Summary - Data Table on Market Overview
- Executive Summary - Chart on Global Market Characteristics
- Executive Summary - Chart on Market By Geographical Landscape
- Executive Summary - Chart on Market Segmentation by End-user
- Executive Summary - Chart on Market Segmentation by Deployment
- Executive Summary - Chart on Incremental Growth
- Executive Summary - Data Table on Incremental Growth
- Executive Summary - Chart on Company Market Positioning
2 Market Landscape
- 2.1 Market ecosystem
- Parent Market
- Data Table on - Parent Market
- 2.2 Market characteristics
- Market characteristics analysis
- 2.3 Value chain analysis
- Value Chain Analysis
3 Market Sizing
- 3.1 Market definition
- Offerings of companies included in the market definition
- 3.2 Market segment analysis
- Market segments
- 3.3 Market size 2023
- 3.4 Market outlook: Forecast for 2023-2028
- Chart on Global - Market size and forecast 2023-2028 ($ million)
- Data Table on Global - Market size and forecast 2023-2028 ($ million)
- Chart on Global Market: Year-over-year growth 2023-2028 (%)
- Data Table on Global Market: Year-over-year growth 2023-2028 (%)
4 Historic Market Size
- 4.1 Global EClinical Solutions Market 2018 - 2022
- Historic Market Size - Data Table on Global EClinical Solutions Market 2018 - 2022 ($ million)
- 4.2 End-user segment analysis 2018 - 2022
- Historic Market Size - End-user Segment 2018 - 2022 ($ million)
- 4.3 Deployment segment analysis 2018 - 2022
- Historic Market Size - Deployment Segment 2018 - 2022 ($ million)
- 4.4 Geography segment analysis 2018 - 2022
- Historic Market Size - Geography Segment 2018 - 2022 ($ million)
- 4.5 Country segment analysis 2018 - 2022
- Historic Market Size - Country Segment 2018 - 2022 ($ million)
5 Five Forces Analysis
- 5.1 Five forces summary
- Five forces analysis - Comparison between 2023 and 2028
- 5.2 Bargaining power of buyers
- Bargaining power of buyers - Impact of key factors 2023 and 2028
- 5.3 Bargaining power of suppliers
- Bargaining power of suppliers - Impact of key factors in 2023 and 2028
- 5.4 Threat of new entrants
- Threat of new entrants - Impact of key factors in 2023 and 2028
- 5.5 Threat of substitutes
- Threat of substitutes - Impact of key factors in 2023 and 2028
- 5.6 Threat of rivalry
- Threat of rivalry - Impact of key factors in 2023 and 2028
- 5.7 Market condition
- Chart on Market condition - Five forces 2023 and 2028
6 Market Segmentation by End-user
- 6.1 Market segments
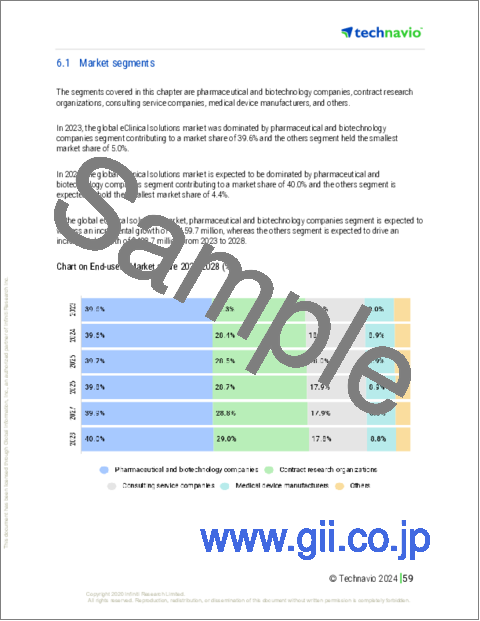
- Chart on End-user - Market share 2023-2028 (%)
- Data Table on End-user - Market share 2023-2028 (%)
- 6.2 Comparison by End-user
- Chart on Comparison by End-user
- Data Table on Comparison by End-user
- 6.3 Pharmaceutical and biotechnology companies - Market size and forecast 2023-2028
- Chart on Pharmaceutical and biotechnology companies - Market size and forecast 2023-2028 ($ million)
- Data Table on Pharmaceutical and biotechnology companies - Market size and forecast 2023-2028 ($ million)
- Chart on Pharmaceutical and biotechnology companies - Year-over-year growth 2023-2028 (%)
- Data Table on Pharmaceutical and biotechnology companies - Year-over-year growth 2023-2028 (%)
- 6.4 Contract research organizations - Market size and forecast 2023-2028
- Chart on Contract research organizations - Market size and forecast 2023-2028 ($ million)
- Data Table on Contract research organizations - Market size and forecast 2023-2028 ($ million)
- Chart on Contract research organizations - Year-over-year growth 2023-2028 (%)
- Data Table on Contract research organizations - Year-over-year growth 2023-2028 (%)
- 6.5 Consulting service companies - Market size and forecast 2023-2028
- Chart on Consulting service companies - Market size and forecast 2023-2028 ($ million)
- Data Table on Consulting service companies - Market size and forecast 2023-2028 ($ million)
- Chart on Consulting service companies - Year-over-year growth 2023-2028 (%)
- Data Table on Consulting service companies - Year-over-year growth 2023-2028 (%)
- 6.6 Medical device manufacturers - Market size and forecast 2023-2028
- Chart on Medical device manufacturers - Market size and forecast 2023-2028 ($ million)
- Data Table on Medical device manufacturers - Market size and forecast 2023-2028 ($ million)
- Chart on Medical device manufacturers - Year-over-year growth 2023-2028 (%)
- Data Table on Medical device manufacturers - Year-over-year growth 2023-2028 (%)
- 6.7 Others - Market size and forecast 2023-2028
- Chart on Others - Market size and forecast 2023-2028 ($ million)
- Data Table on Others - Market size and forecast 2023-2028 ($ million)
- Chart on Others - Year-over-year growth 2023-2028 (%)
- Data Table on Others - Year-over-year growth 2023-2028 (%)
- 6.8 Market opportunity by End-user
- Market opportunity by End-user ($ million)
- Data Table on Market opportunity by End-user ($ million)
7 Market Segmentation by Deployment
- 7.1 Market segments
- Chart on Deployment - Market share 2023-2028 (%)
- Data Table on Deployment - Market share 2023-2028 (%)
- 7.2 Comparison by Deployment
- Chart on Comparison by Deployment
- Data Table on Comparison by Deployment
- 7.3 Cloud-based - Market size and forecast 2023-2028
- Chart on Cloud-based - Market size and forecast 2023-2028 ($ million)
- Data Table on Cloud-based - Market size and forecast 2023-2028 ($ million)
- Chart on Cloud-based - Year-over-year growth 2023-2028 (%)
- Data Table on Cloud-based - Year-over-year growth 2023-2028 (%)
- 7.4 On-premises - Market size and forecast 2023-2028
- Chart on On-premises - Market size and forecast 2023-2028 ($ million)
- Data Table on On-premises - Market size and forecast 2023-2028 ($ million)
- Chart on On-premises - Year-over-year growth 2023-2028 (%)
- Data Table on On-premises - Year-over-year growth 2023-2028 (%)
- 7.5 Market opportunity by Deployment
- Market opportunity by Deployment ($ million)
- Data Table on Market opportunity by Deployment ($ million)
8 Customer Landscape
- 8.1 Customer landscape overview
- Analysis of price sensitivity, lifecycle, customer purchase basket, adoption rates, and purchase criteria
9 Geographic Landscape
- 9.1 Geographic segmentation
- Chart on Market share By Geographical Landscape 2023-2028 (%)
- Data Table on Market share By Geographical Landscape 2023-2028 (%)
- 9.2 Geographic comparison
- Chart on Geographic comparison
- Data Table on Geographic comparison
- 9.3 North America - Market size and forecast 2023-2028
- Chart on North America - Market size and forecast 2023-2028 ($ million)
- Data Table on North America - Market size and forecast 2023-2028 ($ million)
- Chart on North America - Year-over-year growth 2023-2028 (%)
- Data Table on North America - Year-over-year growth 2023-2028 (%)
- 9.4 Europe - Market size and forecast 2023-2028
- Chart on Europe - Market size and forecast 2023-2028 ($ million)
- Data Table on Europe - Market size and forecast 2023-2028 ($ million)
- Chart on Europe - Year-over-year growth 2023-2028 (%)
- Data Table on Europe - Year-over-year growth 2023-2028 (%)
- 9.5 Asia - Market size and forecast 2023-2028
- Chart on Asia - Market size and forecast 2023-2028 ($ million)
- Data Table on Asia - Market size and forecast 2023-2028 ($ million)
- Chart on Asia - Year-over-year growth 2023-2028 (%)
- Data Table on Asia - Year-over-year growth 2023-2028 (%)
- 9.6 Rest of World (ROW) - Market size and forecast 2023-2028
- Chart on Rest of World (ROW) - Market size and forecast 2023-2028 ($ million)
- Data Table on Rest of World (ROW) - Market size and forecast 2023-2028 ($ million)
- Chart on Rest of World (ROW) - Year-over-year growth 2023-2028 (%)
- Data Table on Rest of World (ROW) - Year-over-year growth 2023-2028 (%)
- 9.7 US - Market size and forecast 2023-2028
- Chart on US - Market size and forecast 2023-2028 ($ million)
- Data Table on US - Market size and forecast 2023-2028 ($ million)
- Chart on US - Year-over-year growth 2023-2028 (%)
- Data Table on US - Year-over-year growth 2023-2028 (%)
- 9.8 Germany - Market size and forecast 2023-2028
- Chart on Germany - Market size and forecast 2023-2028 ($ million)
- Data Table on Germany - Market size and forecast 2023-2028 ($ million)
- Chart on Germany - Year-over-year growth 2023-2028 (%)
- Data Table on Germany - Year-over-year growth 2023-2028 (%)
- 9.9 UK - Market size and forecast 2023-2028
- Chart on UK - Market size and forecast 2023-2028 ($ million)
- Data Table on UK - Market size and forecast 2023-2028 ($ million)
- Chart on UK - Year-over-year growth 2023-2028 (%)
- Data Table on UK - Year-over-year growth 2023-2028 (%)
- 9.10 China - Market size and forecast 2023-2028
- Chart on China - Market size and forecast 2023-2028 ($ million)
- Data Table on China - Market size and forecast 2023-2028 ($ million)
- Chart on China - Year-over-year growth 2023-2028 (%)
- Data Table on China - Year-over-year growth 2023-2028 (%)
- 9.11 Japan - Market size and forecast 2023-2028
- Chart on Japan - Market size and forecast 2023-2028 ($ million)
- Data Table on Japan - Market size and forecast 2023-2028 ($ million)
- Chart on Japan - Year-over-year growth 2023-2028 (%)
- Data Table on Japan - Year-over-year growth 2023-2028 (%)
- 9.12 Market opportunity By Geographical Landscape
- Market opportunity By Geographical Landscape ($ million)
- Data Tables on Market opportunity By Geographical Landscape ($ million)
10 Drivers, Challenges, and Opportunity/Restraints
- 10.1 Market drivers
- 10.2 Market challenges
- 10.3 Impact of drivers and challenges
- Impact of drivers and challenges in 2023 and 2028
- 10.4 Market opportunities/restraints
11 Competitive Landscape
- 11.1 Overview
- 11.2 Competitive Landscape
- Overview on criticality of inputs and factors of differentiation
- 11.3 Landscape disruption
- Overview on factors of disruption
- 11.4 Industry risks
- Impact of key risks on business
12 Competitive Analysis
- 12.1 Companies profiled
- Companies covered
- 12.2 Market positioning of companies
- Matrix on companies position and classification
- 12.3 Anju Software Inc.
- Anju Software Inc. - Overview
- Anju Software Inc. - Product / Service
- Anju Software Inc. - Key offerings
- 12.4 ArisGlobal LLC
- ArisGlobal LLC - Overview
- ArisGlobal LLC - Product / Service
- ArisGlobal LLC - Key offerings
- 12.5 Castor Research Inc.
- Castor Research Inc. - Overview
- Castor Research Inc. - Product / Service
- Castor Research Inc. - Key offerings
- 12.6 Dassault Systemes SE
- Dassault Systemes SE - Overview
- Dassault Systemes SE - Product / Service
- Dassault Systemes SE - Key news
- Dassault Systemes SE - Key offerings
- 12.7 DATATRAK International Inc.
- DATATRAK International Inc. - Overview
- DATATRAK International Inc. - Product / Service
- DATATRAK International Inc. - Key offerings
- 12.8 eClinical Solutions LLC.
- eClinical Solutions LLC. - Overview
- eClinical Solutions LLC. - Product / Service
- eClinical Solutions LLC. - Key offerings
- 12.9 eClinicalWorks LLC
- eClinicalWorks LLC - Overview
- eClinicalWorks LLC - Product / Service
- eClinicalWorks LLC - Key offerings
- 12.10 eResearchTechnology GmbH
- eResearchTechnology GmbH - Overview
- eResearchTechnology GmbH - Product / Service
- eResearchTechnology GmbH - Key offerings
- 12.11 International Business Machines Corp.
- International Business Machines Corp. - Overview
- International Business Machines Corp. - Business segments
- International Business Machines Corp. - Key news
- International Business Machines Corp. - Key offerings
- International Business Machines Corp. - Segment focus
- 12.12 MedNet
- MedNet - Overview
- MedNet - Product / Service
- MedNet - Key offerings
- 12.13 Oracle Corp.
- Oracle Corp. - Overview
- Oracle Corp. - Business segments
- Oracle Corp. - Key news
- Oracle Corp. - Key offerings
- Oracle Corp. - Segment focus
- 12.14 Parexel International Corp.
- Parexel International Corp. - Overview
- Parexel International Corp. - Product / Service
- Parexel International Corp. - Key offerings
- 12.15 Saama Technologies Inc.
- Saama Technologies Inc. - Overview
- Saama Technologies Inc. - Product / Service
- Saama Technologies Inc. - Key offerings
- 12.16 Signant Health
- Signant Health - Overview
- Signant Health - Product / Service
- Signant Health - Key offerings
- 12.17 Veeva Systems Inc.
- Veeva Systems Inc. - Overview
- Veeva Systems Inc. - Business segments
- Veeva Systems Inc. - Key offerings
- Veeva Systems Inc. - Segment focus
13 Appendix
- 13.1 Scope of the report
- 13.2 Inclusions and exclusions checklist
- Inclusions checklist
- Exclusions checklist
- 13.3 Currency conversion rates for US$
- Currency conversion rates for US$
- 13.4 Research methodology
- Research methodology
- 13.5 Data procurement
- Information sources
- 13.6 Data validation
- Data validation
- 13.7 Validation techniques employed for market sizing
- Validation techniques employed for market sizing
- 13.8 Data synthesis
- Data synthesis
- 13.9 360 degree market analysis
- 360 degree market analysis
- 13.10 List of abbreviations
- List of abbreviations

