|
|
市場調査レポート
商品コード
1516307
産業用マルチプロトコルゲートウェイの世界市場 2024-2028Global industrial multiprotocol gateways market 2024-2028 |
||||||
|
|||||||
カスタマイズ可能
|
|||||||


| 産業用マルチプロトコルゲートウェイの世界市場 2024-2028 |
|
出版日: 2024年06月12日
発行: TechNavio
ページ情報: 英文 179 Pages
納期: 即納可能
|

全表示
- 概要
- 図表
- 目次
産業用マルチプロトコルゲートウェイ市場2024-2028
産業用マルチプロトコルゲートウェイ市場は2023-2028年に2億3,050万米ドル、予測期間中のCAGRは11.22%で成長すると予測されます。当レポートでは、産業用マルチプロトコルゲートウェイ市場の全体的な分析、市場規模・予測、動向、成長促進要因、課題、約25のベンダーを網羅したベンダー分析などを掲載しています。
現在の市場シナリオ、最新動向と促進要因、市場環境全体に関する最新分析を提供しています。市場は、IoTゲートウェイの注目度の高まり、複数の通信デバイスを扱う必要性の高まり、遠隔監視と予防保守の需要の高まりによって牽引されています。
| 市場範囲 | |
|---|---|
| 基準年 | 2024 |
| 終了年 | 2028 |
| 予測期間 | 2024-2028 |
| 成長モメンタム | 加速 |
| 前年比2024年 | 9.8% |
| CAGR | 11.22% |
| 増分額 | 2億3,050万米ドル |
本調査では、マルチプロトコル通信用システムオンチップの開発が、今後数年間の産業用マルチプロトコルゲートウェイ市場成長を牽引する主要因の1つであると分析しています。また、スマートグリッドにおけるゲートウェイの利用拡大、ワイヤレスセンサネットワークの普及拡大も市場の大きな需要につながります。
目次
第1章 エグゼクティブサマリー
- 市場概要
第2章 市場情勢
- 市場エコシステム
- 市場の特徴
- バリューチェーン分析
第3章 市場規模の評価
- 市場の定義
- 市場セグメント分析
- 市場規模 2023
- 市場の見通し 2023-2028
第4章 市場規模実績
- 世界産業用マルチプロトコルゲートウェイ市場 2018-2022
- 用途別セグメント分析 2018-2022
- エンドユーザー別セグメント分析 2018-2022
- 地域別セグメント分析 2018-2022
- 国別セグメント分析 2018-2022
第5章 ファイブフォース分析
- ファイブフォースの要約
- 買い手の交渉力
- 供給企業の交渉力
- 新規参入業者の脅威
- 代替品の脅威
- 競争の脅威
- 市況
第6章 市場セグメンテーション:用途別
- 市場セグメンテーション
- 比較:用途別
- 遠隔モニタリング:市場規模と予測 2023-2028
- 製品の最適化:市場規模と予測 2023-2028
- 予防保守:市場規模と予測 2023-2028
- 市場機会:用途別
第7章 市場セグメンテーション:エンドユーザー別
- 市場セグメンテーション
- 比較:エンドユーザー別
- プロセス産業:市場規模と予測 2023-2028
- 個別産業:市場規模と予測 2023-2028
- 市場機会:エンドユーザー別
第8章 顧客情勢
- 顧客情勢の概要
第9章 地域別情勢
- 地域別セグメンテーション
- 地域別比較
- 北米:市場規模と予測 2023-2028
- 欧州:市場規模と予測 2023-2028
- アジア太平洋:市場規模と予測 2023-2028
- 南米:市場規模と予測 2023-2028
- 中東・アフリカ:市場規模と予測 2023-2028
- 米国:市場規模と予測 2023-2028
- 中国:市場規模と予測 2023-2028
- ドイツ:市場規模と予測 2023-2028
- 英国:市場規模と予測 2023-2028
- 日本:市場規模と予測 2023-2028
- 市場機会:地域別
第10章 促進要因・課題・機会・抑制要因
- 市場促進要因
- 市場の課題
- 促進要因と課題の影響
- 市場の機会・抑制要因
第11章 競合情勢
- 概要
- 競合情勢
- 混乱の状況
- 業界のリスク
第12章 競合分析
- 企業プロファイル
- 企業の市場ポジショニング
- ABB Ltd.
- Advantech Co. Ltd.
- Artila Electronics Co. Ltd
- Atop Technologies
- HMS Networks AB
- Honeywell International Inc.
- Intel Corp.
- International Business Machines Corp.
- Kessler Ellis Products
- Larsen and Toubro Ltd.
- Moxa Inc.
- MSA Safety Inc.
- Multi Tech Systems Inc.
- Pepperl and Fuchs SE
- San Telequip Pvt. Ltd.
第13章 付録
Exhibits:
- Exhibits1: Executive Summary - Chart on Market Overview
- Exhibits2: Executive Summary - Data Table on Market Overview
- Exhibits3: Executive Summary - Chart on Global Market Characteristics
- Exhibits4: Executive Summary - Chart on Market by Geography
- Exhibits5: Executive Summary - Chart on Market Segmentation by Application
- Exhibits6: Executive Summary - Chart on Market Segmentation by End-user
- Exhibits7: Executive Summary - Chart on Incremental Growth
- Exhibits8: Executive Summary - Data Table on Incremental Growth
- Exhibits9: Executive Summary - Chart on Company Market Positioning
- Exhibits10: Parent Market
- Exhibits11: Data Table on - Parent Market
- Exhibits12: Market characteristics analysis
- Exhibits13: Value Chain Analysis
- Exhibits14: Offerings of companies included in the market definition
- Exhibits15: Market segments
- Exhibits16: Chart on Global - Market size and forecast 2023-2028 ($ million)
- Exhibits17: Data Table on Global - Market size and forecast 2023-2028 ($ million)
- Exhibits18: Chart on Global Market: Year-over-year growth 2023-2028 (%)
- Exhibits19: Data Table on Global Market: Year-over-year growth 2023-2028 (%)
- Exhibits20: Historic Market Size - Data Table on Global Industrial Multiprotocol Gateways Market 2018 - 2022 ($ million)
- Exhibits21: Historic Market Size - Application Segment 2018 - 2022 ($ million)
- Exhibits22: Historic Market Size - End-user Segment 2018 - 2022 ($ million)
- Exhibits23: Historic Market Size - Geography Segment 2018 - 2022 ($ million)
- Exhibits24: Historic Market Size - Country Segment 2018 - 2022 ($ million)
- Exhibits25: Five forces analysis - Comparison between 2023 and 2028
- Exhibits26: Bargaining power of buyers - Impact of key factors 2023 and 2028
- Exhibits27: Bargaining power of suppliers - Impact of key factors in 2023 and 2028
- Exhibits28: Threat of new entrants - Impact of key factors in 2023 and 2028
- Exhibits29: Threat of substitutes - Impact of key factors in 2023 and 2028
- Exhibits30: Threat of rivalry - Impact of key factors in 2023 and 2028
- Exhibits31: Chart on Market condition - Five forces 2023 and 2028
- Exhibits32: Chart on Application - Market share 2023-2028 (%)
- Exhibits33: Data Table on Application - Market share 2023-2028 (%)
- Exhibits34: Chart on Comparison by Application
- Exhibits35: Data Table on Comparison by Application
- Exhibits36: Chart on Remote monitoring - Market size and forecast 2023-2028 ($ million)
- Exhibits37: Data Table on Remote monitoring - Market size and forecast 2023-2028 ($ million)
- Exhibits38: Chart on Remote monitoring - Year-over-year growth 2023-2028 (%)
- Exhibits39: Data Table on Remote monitoring - Year-over-year growth 2023-2028 (%)
- Exhibits40: Chart on Product optimization - Market size and forecast 2023-2028 ($ million)
- Exhibits41: Data Table on Product optimization - Market size and forecast 2023-2028 ($ million)
- Exhibits42: Chart on Product optimization - Year-over-year growth 2023-2028 (%)
- Exhibits43: Data Table on Product optimization - Year-over-year growth 2023-2028 (%)
- Exhibits44: Chart on Preventive maintenance - Market size and forecast 2023-2028 ($ million)
- Exhibits45: Data Table on Preventive maintenance - Market size and forecast 2023-2028 ($ million)
- Exhibits46: Chart on Preventive maintenance - Year-over-year growth 2023-2028 (%)
- Exhibits47: Data Table on Preventive maintenance - Year-over-year growth 2023-2028 (%)
- Exhibits48: Market opportunity by Application ($ million)
- Exhibits49: Data Table on Market opportunity by Application ($ million)
- Exhibits50: Chart on End-user - Market share 2023-2028 (%)
- Exhibits51: Data Table on End-user - Market share 2023-2028 (%)
- Exhibits52: Chart on Comparison by End-user
- Exhibits53: Data Table on Comparison by End-user
- Exhibits54: Chart on Process industries - Market size and forecast 2023-2028 ($ million)
- Exhibits55: Data Table on Process industries - Market size and forecast 2023-2028 ($ million)
- Exhibits56: Chart on Process industries - Year-over-year growth 2023-2028 (%)
- Exhibits57: Data Table on Process industries - Year-over-year growth 2023-2028 (%)
- Exhibits58: Chart on Discrete industries - Market size and forecast 2023-2028 ($ million)
- Exhibits59: Data Table on Discrete industries - Market size and forecast 2023-2028 ($ million)
- Exhibits60: Chart on Discrete industries - Year-over-year growth 2023-2028 (%)
- Exhibits61: Data Table on Discrete industries - Year-over-year growth 2023-2028 (%)
- Exhibits62: Market opportunity by End-user ($ million)
- Exhibits63: Data Table on Market opportunity by End-user ($ million)
- Exhibits64: Analysis of price sensitivity, lifecycle, customer purchase basket, adoption rates, and purchase criteria
- Exhibits65: Chart on Market share by geography 2023-2028 (%)
- Exhibits66: Data Table on Market share by geography 2023-2028 (%)
- Exhibits67: Chart on Geographic comparison
- Exhibits68: Data Table on Geographic comparison
- Exhibits69: Chart on North America - Market size and forecast 2023-2028 ($ million)
- Exhibits70: Data Table on North America - Market size and forecast 2023-2028 ($ million)
- Exhibits71: Chart on North America - Year-over-year growth 2023-2028 (%)
- Exhibits72: Data Table on North America - Year-over-year growth 2023-2028 (%)
- Exhibits73: Chart on Europe - Market size and forecast 2023-2028 ($ million)
- Exhibits74: Data Table on Europe - Market size and forecast 2023-2028 ($ million)
- Exhibits75: Chart on Europe - Year-over-year growth 2023-2028 (%)
- Exhibits76: Data Table on Europe - Year-over-year growth 2023-2028 (%)
- Exhibits77: Chart on APAC - Market size and forecast 2023-2028 ($ million)
- Exhibits78: Data Table on APAC - Market size and forecast 2023-2028 ($ million)
- Exhibits79: Chart on APAC - Year-over-year growth 2023-2028 (%)
- Exhibits80: Data Table on APAC - Year-over-year growth 2023-2028 (%)
- Exhibits81: Chart on South America - Market size and forecast 2023-2028 ($ million)
- Exhibits82: Data Table on South America - Market size and forecast 2023-2028 ($ million)
- Exhibits83: Chart on South America - Year-over-year growth 2023-2028 (%)
- Exhibits84: Data Table on South America - Year-over-year growth 2023-2028 (%)
- Exhibits85: Chart on Middle East and Africa - Market size and forecast 2023-2028 ($ million)
- Exhibits86: Data Table on Middle East and Africa - Market size and forecast 2023-2028 ($ million)
- Exhibits87: Chart on Middle East and Africa - Year-over-year growth 2023-2028 (%)
- Exhibits88: Data Table on Middle East and Africa - Year-over-year growth 2023-2028 (%)
- Exhibits89: Chart on US - Market size and forecast 2023-2028 ($ million)
- Exhibits90: Data Table on US - Market size and forecast 2023-2028 ($ million)
- Exhibits91: Chart on US - Year-over-year growth 2023-2028 (%)
- Exhibits92: Data Table on US - Year-over-year growth 2023-2028 (%)
- Exhibits93: Chart on China - Market size and forecast 2023-2028 ($ million)
- Exhibits94: Data Table on China - Market size and forecast 2023-2028 ($ million)
- Exhibits95: Chart on China - Year-over-year growth 2023-2028 (%)
- Exhibits96: Data Table on China - Year-over-year growth 2023-2028 (%)
- Exhibits97: Chart on Germany - Market size and forecast 2023-2028 ($ million)
- Exhibits98: Data Table on Germany - Market size and forecast 2023-2028 ($ million)
- Exhibits99: Chart on Germany - Year-over-year growth 2023-2028 (%)
- Exhibits100: Data Table on Germany - Year-over-year growth 2023-2028 (%)
- Exhibits101: Chart on UK - Market size and forecast 2023-2028 ($ million)
- Exhibits102: Data Table on UK - Market size and forecast 2023-2028 ($ million)
- Exhibits103: Chart on UK - Year-over-year growth 2023-2028 (%)
- Exhibits104: Data Table on UK - Year-over-year growth 2023-2028 (%)
- Exhibits105: Chart on Japan - Market size and forecast 2023-2028 ($ million)
- Exhibits106: Data Table on Japan - Market size and forecast 2023-2028 ($ million)
- Exhibits107: Chart on Japan - Year-over-year growth 2023-2028 (%)
- Exhibits108: Data Table on Japan - Year-over-year growth 2023-2028 (%)
- Exhibits109: Market opportunity by geography ($ million)
- Exhibits110: Data Tables on Market opportunity by geography ($ million)
- Exhibits111: Impact of drivers and challenges in 2023 and 2028
- Exhibits112: Overview on criticality of inputs and factors of differentiation
- Exhibits113: Overview on factors of disruption
- Exhibits114: Impact of key risks on business
- Exhibits115: Companies covered
- Exhibits116: Matrix on companies position and classification
- Exhibits117: ABB Ltd. - Overview
- Exhibits118: ABB Ltd. - Business segments
- Exhibits119: ABB Ltd. - Key news
- Exhibits120: ABB Ltd. - Key offerings
- Exhibits121: ABB Ltd. - Segment focus
- Exhibits122: Advantech Co. Ltd. - Overview
- Exhibits123: Advantech Co. Ltd. - Business segments
- Exhibits124: Advantech Co. Ltd. - Key news
- Exhibits125: Advantech Co. Ltd. - Key offerings
- Exhibits126: Advantech Co. Ltd. - Segment focus
- Exhibits127: Artila Electronics Co. Ltd - Overview
- Exhibits128: Artila Electronics Co. Ltd - Product / Service
- Exhibits129: Artila Electronics Co. Ltd - Key offerings
- Exhibits130: Atop Technologies - Overview
- Exhibits131: Atop Technologies - Product / Service
- Exhibits132: Atop Technologies - Key offerings
- Exhibits133: HMS Networks AB - Overview
- Exhibits134: HMS Networks AB - Product / Service
- Exhibits135: HMS Networks AB - Key news
- Exhibits136: HMS Networks AB - Key offerings
- Exhibits137: Honeywell International Inc. - Overview
- Exhibits138: Honeywell International Inc. - Business segments
- Exhibits139: Honeywell International Inc. - Key news
- Exhibits140: Honeywell International Inc. - Key offerings
- Exhibits141: Honeywell International Inc. - Segment focus
- Exhibits142: Intel Corp. - Overview
- Exhibits143: Intel Corp. - Business segments
- Exhibits144: Intel Corp. - Key news
- Exhibits145: Intel Corp. - Key offerings
- Exhibits146: Intel Corp. - Segment focus
- Exhibits147: International Business Machines Corp. - Overview
- Exhibits148: International Business Machines Corp. - Business segments
- Exhibits149: International Business Machines Corp. - Key news
- Exhibits150: International Business Machines Corp. - Key offerings
- Exhibits151: International Business Machines Corp. - Segment focus
- Exhibits152: Kessler Ellis Products - Overview
- Exhibits153: Kessler Ellis Products - Product / Service
- Exhibits154: Kessler Ellis Products - Key offerings
- Exhibits155: Larsen and Toubro Ltd. - Overview
- Exhibits156: Larsen and Toubro Ltd. - Business segments
- Exhibits157: Larsen and Toubro Ltd. - Key news
- Exhibits158: Larsen and Toubro Ltd. - Key offerings
- Exhibits159: Larsen and Toubro Ltd. - Segment focus
- Exhibits160: Moxa Inc. - Overview
- Exhibits161: Moxa Inc. - Product / Service
- Exhibits162: Moxa Inc. - Key offerings
- Exhibits163: MSA Safety Inc. - Overview
- Exhibits164: MSA Safety Inc. - Business segments
- Exhibits165: MSA Safety Inc. - Key news
- Exhibits166: MSA Safety Inc. - Key offerings
- Exhibits167: MSA Safety Inc. - Segment focus
- Exhibits168: Multi Tech Systems Inc. - Overview
- Exhibits169: Multi Tech Systems Inc. - Product / Service
- Exhibits170: Multi Tech Systems Inc. - Key offerings
- Exhibits171: Pepperl and Fuchs SE - Overview
- Exhibits172: Pepperl and Fuchs SE - Product / Service
- Exhibits173: Pepperl and Fuchs SE - Key news
- Exhibits174: Pepperl and Fuchs SE - Key offerings
- Exhibits175: San Telequip Pvt. Ltd. - Overview
- Exhibits176: San Telequip Pvt. Ltd. - Product / Service
- Exhibits177: San Telequip Pvt. Ltd. - Key offerings
- Exhibits178: Inclusions checklist
- Exhibits179: Exclusions checklist
- Exhibits180: Currency conversion rates for US$
- Exhibits181: Research methodology
- Exhibits182: Information sources
- Exhibits183: Data validation
- Exhibits184: Validation techniques employed for market sizing
- Exhibits185: Data synthesis
- Exhibits186: 360 degree market analysis
- Exhibits187: List of abbreviations
Industrial Multiprotocol Gateways Market 2024-2028
The industrial multiprotocol gateways market is forecasted to grow by USD 230.5 mn during 2023-2028, accelerating at a CAGR of 11.22% during the forecast period. The report on the industrial multiprotocol gateways market provides a holistic analysis, market size and forecast, trends, growth drivers, and challenges, as well as vendor analysis covering around 25 vendors.
The report offers an up-to-date analysis regarding the current market scenario, the latest trends and drivers, and the overall market environment. The market is driven by growing prominence of iot gateways, growing need to handle multiple communication devices, and increasing demand for remote monitoring and preventive maintenance.
| Market Scope | |
|---|---|
| Base Year | 2024 |
| End Year | 2028 |
| Series Year | 2024-2028 |
| Growth Momentum | Accelerate |
| YOY 2024 | 9.8% |
| CAGR | 11.22% |
| Incremental Value | $230.5mn |
Technavio's industrial multiprotocol gateways market is segmented as below:
By Application
- Remote monitoring
- Product optimization
- Preventive maintenance
By End-user
- Process industries
- Discrete industries
By Geography
- North America
- Europe
- APAC
- South America
- Middle East and Africa
This study identifies the development of system-on-chip for multiprotocol communication as one of the prime reasons driving the industrial multiprotocol gateways market growth during the next few years. Also, growing use of gateways in smart grids and growing popularity of wireless sensor networks will lead to sizable demand in the market.
The report on the industrial multiprotocol gateways market covers the following areas:
- Industrial multiprotocol gateways market sizing
- Industrial multiprotocol gateways market forecast
- Industrial multiprotocol gateways market industry analysis
The robust vendor analysis is designed to help clients improve their market position, and in line with this, this report provides a detailed analysis of several leading industrial multiprotocol gateways market vendors that include ABB Ltd., Advantech Co. Ltd., Artila Electronics Co. Ltd, Atop Technologies, Cisco Systems Inc., HMS Networks AB, Honeywell International Inc., Intel Corp., International Business Machines Corp., Kessler Ellis Products, Larsen and Toubro Ltd., Moxa Inc., MSA Safety Inc., Multi Tech Systems Inc., Novus International Inc., Pepperl and Fuchs SE, Samsara Inc., San Telequip Pvt. Ltd., Softing AG, and SWYCS. Also, the industrial multiprotocol gateways market analysis report includes information on upcoming trends and challenges that will influence market growth. This is to help companies strategize and leverage all forthcoming growth opportunities.
The study was conducted using an objective combination of primary and secondary information including inputs from key participants in the industry. The report contains a comprehensive market and vendor landscape in addition to an analysis of the key vendors.
The publisher presents a detailed picture of the market by the way of study, synthesis, and summation of data from multiple sources by an analysis of key parameters such as profit, pricing, competition, and promotions. It presents various market facets by identifying the key industry influencers. The data presented is comprehensive, reliable, and a result of extensive research - both primary and secondary. The market research reports provide a complete competitive landscape and an in-depth vendor selection methodology and analysis using qualitative and quantitative research to forecast the accurate market growth.
Table of Contents
1 Executive Summary
- 1.1 Market overview
- Executive Summary - Chart on Market Overview
- Executive Summary - Data Table on Market Overview
- Executive Summary - Chart on Global Market Characteristics
- Executive Summary - Chart on Market by Geography
- Executive Summary - Chart on Market Segmentation by Application
- Executive Summary - Chart on Market Segmentation by End-user
- Executive Summary - Chart on Incremental Growth
- Executive Summary - Data Table on Incremental Growth
- Executive Summary - Chart on Company Market Positioning
2 Market Landscape
- 2.1 Market ecosystem
- Parent Market
- Data Table on - Parent Market
- 2.2 Market characteristics
- Market characteristics analysis
- 2.3 Value chain analysis
- Value Chain Analysis
3 Market Sizing
- 3.1 Market definition
- Offerings of companies included in the market definition
- 3.2 Market segment analysis
- Market segments
- 3.3 Market size 2023
- 3.4 Market outlook: Forecast for 2023-2028
- Chart on Global - Market size and forecast 2023-2028 ($ million)
- Data Table on Global - Market size and forecast 2023-2028 ($ million)
- Chart on Global Market: Year-over-year growth 2023-2028 (%)
- Data Table on Global Market: Year-over-year growth 2023-2028 (%)
4 Historic Market Size
- 4.1 Global Industrial Multiprotocol Gateways Market 2018 - 2022
- Historic Market Size - Data Table on Global Industrial Multiprotocol Gateways Market 2018 - 2022 ($ million)
- 4.2 Application segment analysis 2018 - 2022
- Historic Market Size - Application Segment 2018 - 2022 ($ million)
- 4.3 End-user segment analysis 2018 - 2022
- Historic Market Size - End-user Segment 2018 - 2022 ($ million)
- 4.4 Geography segment analysis 2018 - 2022
- Historic Market Size - Geography Segment 2018 - 2022 ($ million)
- 4.5 Country segment analysis 2018 - 2022
- Historic Market Size - Country Segment 2018 - 2022 ($ million)
5 Five Forces Analysis
- 5.1 Five forces summary
- Five forces analysis - Comparison between 2023 and 2028
- 5.2 Bargaining power of buyers
- Bargaining power of buyers - Impact of key factors 2023 and 2028
- 5.3 Bargaining power of suppliers
- Bargaining power of suppliers - Impact of key factors in 2023 and 2028
- 5.4 Threat of new entrants
- Threat of new entrants - Impact of key factors in 2023 and 2028
- 5.5 Threat of substitutes
- Threat of substitutes - Impact of key factors in 2023 and 2028
- 5.6 Threat of rivalry
- Threat of rivalry - Impact of key factors in 2023 and 2028
- 5.7 Market condition
- Chart on Market condition - Five forces 2023 and 2028
6 Market Segmentation by Application
- 6.1 Market segments
- Chart on Application - Market share 2023-2028 (%)
- Data Table on Application - Market share 2023-2028 (%)
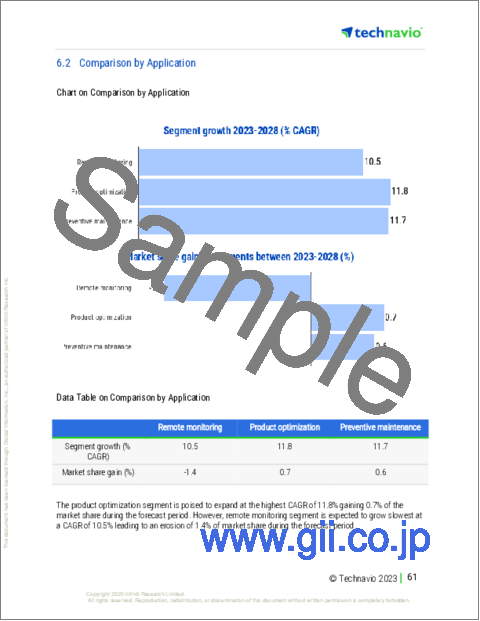
- 6.2 Comparison by Application
- Chart on Comparison by Application
- Data Table on Comparison by Application
- 6.3 Remote monitoring - Market size and forecast 2023-2028
- Chart on Remote monitoring - Market size and forecast 2023-2028 ($ million)
- Data Table on Remote monitoring - Market size and forecast 2023-2028 ($ million)
- Chart on Remote monitoring - Year-over-year growth 2023-2028 (%)
- Data Table on Remote monitoring - Year-over-year growth 2023-2028 (%)
- 6.4 Product optimization - Market size and forecast 2023-2028
- Chart on Product optimization - Market size and forecast 2023-2028 ($ million)
- Data Table on Product optimization - Market size and forecast 2023-2028 ($ million)
- Chart on Product optimization - Year-over-year growth 2023-2028 (%)
- Data Table on Product optimization - Year-over-year growth 2023-2028 (%)
- 6.5 Preventive maintenance - Market size and forecast 2023-2028
- Chart on Preventive maintenance - Market size and forecast 2023-2028 ($ million)
- Data Table on Preventive maintenance - Market size and forecast 2023-2028 ($ million)
- Chart on Preventive maintenance - Year-over-year growth 2023-2028 (%)
- Data Table on Preventive maintenance - Year-over-year growth 2023-2028 (%)
- 6.6 Market opportunity by Application
- Market opportunity by Application ($ million)
- Data Table on Market opportunity by Application ($ million)
7 Market Segmentation by End-user
- 7.1 Market segments
- Chart on End-user - Market share 2023-2028 (%)
- Data Table on End-user - Market share 2023-2028 (%)
- 7.2 Comparison by End-user
- Chart on Comparison by End-user
- Data Table on Comparison by End-user
- 7.3 Process industries - Market size and forecast 2023-2028
- Chart on Process industries - Market size and forecast 2023-2028 ($ million)
- Data Table on Process industries - Market size and forecast 2023-2028 ($ million)
- Chart on Process industries - Year-over-year growth 2023-2028 (%)
- Data Table on Process industries - Year-over-year growth 2023-2028 (%)
- 7.4 Discrete industries - Market size and forecast 2023-2028
- Chart on Discrete industries - Market size and forecast 2023-2028 ($ million)
- Data Table on Discrete industries - Market size and forecast 2023-2028 ($ million)
- Chart on Discrete industries - Year-over-year growth 2023-2028 (%)
- Data Table on Discrete industries - Year-over-year growth 2023-2028 (%)
- 7.5 Market opportunity by End-user
- Market opportunity by End-user ($ million)
- Data Table on Market opportunity by End-user ($ million)
8 Customer Landscape
- 8.1 Customer landscape overview
- Analysis of price sensitivity, lifecycle, customer purchase basket, adoption rates, and purchase criteria
9 Geographic Landscape
- 9.1 Geographic segmentation
- Chart on Market share by geography 2023-2028 (%)
- Data Table on Market share by geography 2023-2028 (%)
- 9.2 Geographic comparison
- Chart on Geographic comparison
- Data Table on Geographic comparison
- 9.3 North America - Market size and forecast 2023-2028
- Chart on North America - Market size and forecast 2023-2028 ($ million)
- Data Table on North America - Market size and forecast 2023-2028 ($ million)
- Chart on North America - Year-over-year growth 2023-2028 (%)
- Data Table on North America - Year-over-year growth 2023-2028 (%)
- 9.4 Europe - Market size and forecast 2023-2028
- Chart on Europe - Market size and forecast 2023-2028 ($ million)
- Data Table on Europe - Market size and forecast 2023-2028 ($ million)
- Chart on Europe - Year-over-year growth 2023-2028 (%)
- Data Table on Europe - Year-over-year growth 2023-2028 (%)
- 9.5 APAC - Market size and forecast 2023-2028
- Chart on APAC - Market size and forecast 2023-2028 ($ million)
- Data Table on APAC - Market size and forecast 2023-2028 ($ million)
- Chart on APAC - Year-over-year growth 2023-2028 (%)
- Data Table on APAC - Year-over-year growth 2023-2028 (%)
- 9.6 South America - Market size and forecast 2023-2028
- Chart on South America - Market size and forecast 2023-2028 ($ million)
- Data Table on South America - Market size and forecast 2023-2028 ($ million)
- Chart on South America - Year-over-year growth 2023-2028 (%)
- Data Table on South America - Year-over-year growth 2023-2028 (%)
- 9.7 Middle East and Africa - Market size and forecast 2023-2028
- Chart on Middle East and Africa - Market size and forecast 2023-2028 ($ million)
- Data Table on Middle East and Africa - Market size and forecast 2023-2028 ($ million)
- Chart on Middle East and Africa - Year-over-year growth 2023-2028 (%)
- Data Table on Middle East and Africa - Year-over-year growth 2023-2028 (%)
- 9.8 US - Market size and forecast 2023-2028
- Chart on US - Market size and forecast 2023-2028 ($ million)
- Data Table on US - Market size and forecast 2023-2028 ($ million)
- Chart on US - Year-over-year growth 2023-2028 (%)
- Data Table on US - Year-over-year growth 2023-2028 (%)
- 9.9 China - Market size and forecast 2023-2028
- Chart on China - Market size and forecast 2023-2028 ($ million)
- Data Table on China - Market size and forecast 2023-2028 ($ million)
- Chart on China - Year-over-year growth 2023-2028 (%)
- Data Table on China - Year-over-year growth 2023-2028 (%)
- 9.10 Germany - Market size and forecast 2023-2028
- Chart on Germany - Market size and forecast 2023-2028 ($ million)
- Data Table on Germany - Market size and forecast 2023-2028 ($ million)
- Chart on Germany - Year-over-year growth 2023-2028 (%)
- Data Table on Germany - Year-over-year growth 2023-2028 (%)
- 9.11 UK - Market size and forecast 2023-2028
- Chart on UK - Market size and forecast 2023-2028 ($ million)
- Data Table on UK - Market size and forecast 2023-2028 ($ million)
- Chart on UK - Year-over-year growth 2023-2028 (%)
- Data Table on UK - Year-over-year growth 2023-2028 (%)
- 9.12 Japan - Market size and forecast 2023-2028
- Chart on Japan - Market size and forecast 2023-2028 ($ million)
- Data Table on Japan - Market size and forecast 2023-2028 ($ million)
- Chart on Japan - Year-over-year growth 2023-2028 (%)
- Data Table on Japan - Year-over-year growth 2023-2028 (%)
- 9.13 Market opportunity by geography
- Market opportunity by geography ($ million)
- Data Tables on Market opportunity by geography ($ million)
10 Drivers, Challenges, and Opportunity/Restraints
- 10.1 Market drivers
- 10.2 Market challenges
- 10.3 Impact of drivers and challenges
- Impact of drivers and challenges in 2023 and 2028
- 10.4 Market opportunities/restraints
11 Competitive Landscape
- 11.1 Overview
- 11.2 Competitive Landscape
- Overview on criticality of inputs and factors of differentiation
- 11.3 Landscape disruption
- Overview on factors of disruption
- 11.4 Industry risks
- Impact of key risks on business
12 Competitive Analysis
- 12.1 Companies profiled
- Companies covered
- 12.2 Market positioning of companies
- Matrix on companies position and classification
- 12.3 ABB Ltd.
- ABB Ltd. - Overview
- ABB Ltd. - Business segments
- ABB Ltd. - Key news
- ABB Ltd. - Key offerings
- ABB Ltd. - Segment focus
- 12.4 Advantech Co. Ltd.
- Advantech Co. Ltd. - Overview
- Advantech Co. Ltd. - Business segments
- Advantech Co. Ltd. - Key news
- Advantech Co. Ltd. - Key offerings
- Advantech Co. Ltd. - Segment focus
- 12.5 Artila Electronics Co. Ltd
- Artila Electronics Co. Ltd - Overview
- Artila Electronics Co. Ltd - Product / Service
- Artila Electronics Co. Ltd - Key offerings
- 12.6 Atop Technologies
- Atop Technologies - Overview
- Atop Technologies - Product / Service
- Atop Technologies - Key offerings
- 12.7 HMS Networks AB
- HMS Networks AB - Overview
- HMS Networks AB - Product / Service
- HMS Networks AB - Key news
- HMS Networks AB - Key offerings
- 12.8 Honeywell International Inc.
- Honeywell International Inc. - Overview
- Honeywell International Inc. - Business segments
- Honeywell International Inc. - Key news
- Honeywell International Inc. - Key offerings
- Honeywell International Inc. - Segment focus
- 12.9 Intel Corp.
- Intel Corp. - Overview
- Intel Corp. - Business segments
- Intel Corp. - Key news
- Intel Corp. - Key offerings
- Intel Corp. - Segment focus
- 12.10 International Business Machines Corp.
- International Business Machines Corp. - Overview
- International Business Machines Corp. - Business segments
- International Business Machines Corp. - Key news
- International Business Machines Corp. - Key offerings
- International Business Machines Corp. - Segment focus
- 12.11 Kessler Ellis Products
- Kessler Ellis Products - Overview
- Kessler Ellis Products - Product / Service
- Kessler Ellis Products - Key offerings
- 12.12 Larsen and Toubro Ltd.
- Larsen and Toubro Ltd. - Overview
- Larsen and Toubro Ltd. - Business segments
- Larsen and Toubro Ltd. - Key news
- Larsen and Toubro Ltd. - Key offerings
- Larsen and Toubro Ltd. - Segment focus
- 12.13 Moxa Inc.
- Moxa Inc. - Overview
- Moxa Inc. - Product / Service
- Moxa Inc. - Key offerings
- 12.14 MSA Safety Inc.
- MSA Safety Inc. - Overview
- MSA Safety Inc. - Business segments
- MSA Safety Inc. - Key news
- MSA Safety Inc. - Key offerings
- MSA Safety Inc. - Segment focus
- 12.15 Multi Tech Systems Inc.
- Multi Tech Systems Inc. - Overview
- Multi Tech Systems Inc. - Product / Service
- Multi Tech Systems Inc. - Key offerings
- 12.16 Pepperl and Fuchs SE
- Pepperl and Fuchs SE - Overview
- Pepperl and Fuchs SE - Product / Service
- Pepperl and Fuchs SE - Key news
- Pepperl and Fuchs SE - Key offerings
- 12.17 San Telequip Pvt. Ltd.
- San Telequip Pvt. Ltd. - Overview
- San Telequip Pvt. Ltd. - Product / Service
- San Telequip Pvt. Ltd. - Key offerings
13 Appendix
- 13.1 Scope of the report
- 13.2 Inclusions and exclusions checklist
- Inclusions checklist
- Exclusions checklist
- 13.3 Currency conversion rates for US$
- Currency conversion rates for US$
- 13.4 Research methodology
- Research methodology
- 13.5 Data procurement
- Information sources
- 13.6 Data validation
- Data validation
- 13.7 Validation techniques employed for market sizing
- Validation techniques employed for market sizing
- 13.8 Data synthesis
- Data synthesis
- 13.9 360 degree market analysis
- 360 degree market analysis
- 13.10 List of abbreviations
- List of abbreviations
