|
|
市場調査レポート
商品コード
1975421
車両用リチウムイオン電池管理システム(BMS)の世界市場 2026年~2030年Global Lithium-Ion Battery Management Systems (BMS) For Vehicles Market 2026-2030 |
||||||
|
|||||||
カスタマイズ可能
|
|||||||

| 車両用リチウムイオン電池管理システム(BMS)の世界市場 2026年~2030年 |
|
出版日: 2026年03月09日
発行: TechNavio
ページ情報: 英文 308 Pages
納期: 即納可能
|

概要
世界の車両用リチウムイオン電池管理システム(BMS)市場は、2025年から2030年にかけて69億740万米ドルの成長が見込まれており、予測期間中のCAGRは23.5%と予測されています。
本報告書は、世界の自動車向けリチウムイオン電池管理システム(BMS)市場について、包括的な分析、市場規模と予測、動向、成長要因、課題、ならびに約25社のベンダー分析を提供します。
本レポートは、現在の市場状況、最新の動向と促進要因、市場環境全般に関する最新の分析を提供します。市場は、高電圧EVアーキテクチャと急速充電インフラの普及、無線通信プロトコルの加速と軽量化戦略、公共交通機関の電動化と商用物流フリートの拡大によって牽引されています。
本調査は、業界の主要関係者からの情報を含む一次情報と二次情報を客観的に組み合わせて実施されました。本レポートには、主要企業の分析に加え、包括的な市場規模データ、地域別分析を伴うセグメント、ベンダー情勢が含まれています。レポートには過去データと予測データが掲載されています。
| 市場範囲 | |
|---|---|
| 基準年 | 2026年 |
| 終了年 | 2030年 |
| 予測期間 | 2026年~2030年 |
| 成長モメンタム | 加速 |
| 前年比2026年 | 18.4% |
| CAGR | 23.5% |
| 増分額 | 69億740万米ドル |
本調査では、予測分析のためのAIとMLの統合が、今後数年間における世界の車両用リチウムイオン電池管理システム(BMS)市場の成長を牽引する主要な要因の一つであると特定しております。また、クラウドベースの管理およびデジタルツイン技術の採用、ならびにモジュール化・分散型管理アーキテクチャへの移行が、市場において相当な需要を生み出すものと見込まれます。
目次
第1章 エグゼクティブサマリー
第2章 Technavio分析
- 価格・ライフサイクル・顧客購入バスケット・採用率・購入基準の分析
- インプットの重要性と差別化の要因
- 混乱の要因
- 促進要因と課題の影響
第3章 市場情勢
- 市場エコシステム
- 市場の特徴
- バリューチェーン分析
第4章 市場規模
- 市場の定義
- 市場セグメント分析
- 市場規模、2025年
- 市場の見通し、2025年~2030年
第5章 市場規模実績
- 車両用リチウムイオン電池管理システム(BMS)の世界市場、2020年~2024年
- タイプセグメント分析、2020年~2024年
- 製品タイプセグメント分析、2020年~2024年
- 用途セグメント分析、2020年~2024年
- 地域別セグメント分析、2020年~2024年
- 国別セグメント分析、2020年~2024年
第6章 定性分析
- AIの影響:車両用リチウムイオン電池管理システム(BMS)の世界市場
第7章 ファイブフォース分析
- ファイブフォースの要約
- 買い手の交渉力
- 供給企業の交渉力
- 新規参入業者の脅威
- 代替品の脅威
- 競争の脅威
- 市況
第8章 市場セグメンテーション:タイプ別
- 比較:タイプ別
- 集中型BMS
- 分散型BMS
- モジュラーBMS
- 市場機会:タイプ別
第9章 市場セグメンテーション:製品タイプ別
- 比較:製品タイプ別
- リン酸鉄リチウム
- リチウムイオン電池
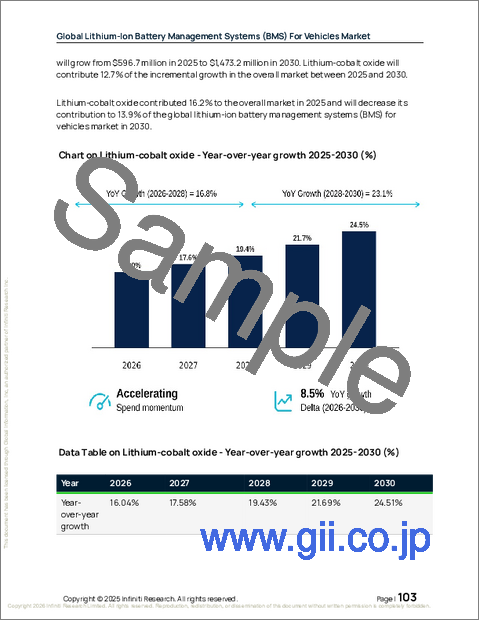
- コバルト酸リチウム
- リン酸鉄リチウム
- その他
- 市場機会:製品タイプ別
第10章 市場セグメンテーション:用途別
- 比較:用途別
- バッテリー電気自動車
- ハイブリッド電気自動車
- その他
- 市場機会:用途別
第11章 顧客情勢
第12章 地域別情勢
- 地域別セグメンテーション
- 比較:地域別
- アジア太平洋
- 中国
- 日本
- 韓国
- インド
- インドネシア
- オーストラリア
- 北米
- 米国
- カナダ
- メキシコ
- 欧州
- ドイツ
- 英国
- フランス
- イタリア
- スペイン
- オランダ
- 南米
- ブラジル
- アルゼンチン
- チリ
- 中東・アフリカ
- サウジアラビア
- アラブ首長国連邦
- 南アフリカ
- エジプト
- ナイジェリア
- 市場機会:地域別
第13章 促進要因・課題・機会
- 市場促進要因
- 市場の課題
- 促進要因と課題の影響
- 市場機会
第14章 競合情勢
- 概要
- 競合情勢
- 混乱の状況
- 業界のリスク
第15章 競合分析
- 企業プロファイル
- 企業ランキング指標
- 企業の市場ポジショニング
- Analog Devices Inc.
- AVL List GmbH
- Elithion Inc.
- Gentherm Inc.
- Infineon Technologies AG
- Johnson Matthey Plc
- Kurui New Energy Co. Ltd.
- LithiumHub
- Nuvation Energy
- Panasonic Holdings Corp.
- Renesas Electronics Corp.
- STAFL Systems LLC
- Texas Instruments Inc.
- Toshiba Corp.
- Victron Energy BV
