|
|
市場調査レポート
商品コード
1709659
静脈内輸液モニタリング装置の世界市場 2025-2029年Global Intravenous (IV) Fluid Monitoring Devices Market 2025-2029 |
||||||

|
|||||||
カスタマイズ可能
|
|||||||


| 静脈内輸液モニタリング装置の世界市場 2025-2029年 |
|
出版日: 2025年04月09日
発行: TechNavio
ページ情報: 英文 214 Pages
納期: 即納可能
|

全表示
- 概要
- 図表
- 目次
静脈内輸液モニタリング装置市場は2024-2029年に24億8,930万米ドル、予測期間中のCAGRは8.5%で成長すると予測されます。
当レポートでは、静脈内輸液モニタリング装置市場の全体的な分析、市場規模・予測、動向、成長促進要因、課題、約25のベンダーを網羅したベンダー分析などを掲載しています。
現在の市場シナリオ、最新動向と促進要因、市場環境全体に関する最新分析を提供しています。入院患者数の増加、在宅医療現場での輸液療法機器の使用増加、新興国への注目の高まりなどが市場を牽引しています。
| 市場範囲 | |
|---|---|
| 基準年 | 2025 |
| 終了年 | 2029 |
| 予測期間 | 2025-2029 |
| 成長モメンタム | 加速 |
| 前年比2025年 | 7.7% |
| CAGR | 8.5% |
| 増分額 | 24億8,930万米ドル |
本調査は、業界の主要参加者からのインプットを含め、一次情報と二次情報を客観的に組み合わせて実施しました。レポートには、主要企業の分析に加え、包括的な市場規模データ、地域別分析によるセグメント、ベンダー情勢が含まれています。レポートには履歴データと予測データがあります。
本調査では、今後数年間における静脈内輸液モニタリング装置市場の成長を促進する主な理由の1つとして、疾病の発生率の増加を挙げています。また、スマート輸液療法デバイスの出現と輸液モニタリングデバイスの技術的進歩は、市場の大きな需要につながります。
目次
第1章 エグゼクティブサマリー
- 市場概要
第2章 Technavio分析
- 価格・ライフサイクル・顧客購入バスケット・採用率・購入基準の分析
- インプットの重要性と差別化の要因
- 混乱の要因
- 促進要因と課題の影響
第3章 市場情勢
- 市場エコシステム
- 市場の特徴
- バリューチェーン分析
第4章 市場規模
- 市場の定義
- 市場セグメント分析
- 市場規模 2024
- 市場の見通し 2024-2029
第5章 市場規模実績
- 静脈内輸液モニタリング装置の世界市場 2019-2023
- エンドユーザーセグメント分析 2019-2023
- タイプセグメント分析 2019-2023
- 技術セグメント分析 2019-2023
- 地域別セグメント分析 2019-2023
- 国別セグメント分析 2019-2023
第6章 定性分析
- AIの影響:静脈内輸液モニタリング装置の世界市場
第7章 ファイブフォース分析
- ファイブフォースの要約
- 買い手の交渉力
- 供給企業の交渉力
- 新規参入業者の脅威
- 代替品の脅威
- 競争の脅威
- 市況
第8章 市場セグメンテーション:エンドユーザー別
- 市場セグメント
- 比較:エンドユーザー別
- 病院と診療所:市場規模と予測 2024-2029
- 外来手術センター:市場規模と予測 2024-2029
- ホームケア:市場規模と予測 2024-2029
- 市場機会:エンドユーザー別
第9章 市場セグメンテーション:タイプ別
- 市場セグメント
- 比較:タイプ別
- デスクトップ:市場規模と予測 2024-2029
- ポータブル:市場規模と予測 2024-2029
- 市場機会:タイプ別
第10章 市場セグメンテーション:技術別
- 市場セグメント
- 比較:技術別
- スマートデバイス:市場規模と予測 2024-2029
- 従来の監視システム:市場規模と予測 2024-2029
- 市場機会:技術別
第11章 顧客情勢
- 顧客情勢の概要
第12章 地域別情勢
- 地域別セグメンテーション
- 地域別比較
- 北米:市場規模と予測 2024-2029
- 欧州:市場規模と予測 2024-2029
- アジア:市場規模と予測 2024-2029
- 世界のその他の地域:市場規模と予測 2024-2029
- 米国:市場規模と予測 2024-2029
- カナダ:市場規模と予測 2024-2029
- ドイツ:市場規模と予測 2024-2029
- フランス:市場規模と予測 2024-2029
- 中国:市場規模と予測 2024-2029
- 英国:市場規模と予測 2024-2029
- 日本:市場規模と予測 2024-2029
- ブラジル:市場規模と予測 2024-2029
- インド:市場規模と予測 2024-2029
- イタリア:市場規模と予測 2024-2029
- 市場機会:地域情勢別
第13章 促進要因・課題・機会・抑制要因
- 市場促進要因
- 市場の課題
- 促進要因と課題の影響
- 市場の機会・抑制要因
第14章 競合情勢
- 概要
- 競合情勢
- 混乱の状況
- 業界のリスク
第15章 競合分析
- 企業プロファイル
- 企業ランキング指数
- 企業の市場ポジショニング
- B.Braun SE
- Baxter International Inc.
- BC Group International Inc.
- Becton Dickinson and Co.
- Datrend Systems Inc.
- EVELABS TECHNOLOGIES Pvt. Ltd.
- FIVAmed Inc.
- Fortive Corp.
- ICU Medical Inc.
- IRadimed Corp.
- ivWatch LLC
- Micrel Medical Devices SA
- Seaward Electronic Ltd.
- Shift Labs Inc.
- Sino Medical Device Technology Co. Ltd.
第16章 付録
Exhibits:
- Exhibits1: Executive Summary - Chart on Market Overview
- Exhibits2: Executive Summary - Data Table on Market Overview
- Exhibits3: Executive Summary - Chart on Global Market Characteristics
- Exhibits4: Executive Summary - Chart on Market By Geographical Landscape
- Exhibits5: Executive Summary - Chart on Market Segmentation by End-user
- Exhibits6: Executive Summary - Chart on Market Segmentation by Type
- Exhibits7: Executive Summary - Chart on Market Segmentation by Technology
- Exhibits8: Executive Summary - Chart on Incremental Growth
- Exhibits9: Executive Summary - Data Table on Incremental Growth
- Exhibits10: Executive Summary - Chart on Company Market Positioning
- Exhibits11: Analysis of price sensitivity, lifecycle, customer purchase basket, adoption rates, and purchase criteria
- Exhibits12: Overview on criticality of inputs and factors of differentiation
- Exhibits13: Overview on factors of disruption
- Exhibits14: Impact of drivers and challenges in 2024 and 2029
- Exhibits15: Parent Market
- Exhibits16: Data Table on - Parent Market
- Exhibits17: Market characteristics analysis
- Exhibits18: Value chain analysis
- Exhibits19: Offerings of companies included in the market definition
- Exhibits20: Market segments
- Exhibits21: Chart on Global - Market size and forecast 2024-2029 ($ million)
- Exhibits22: Data Table on Global - Market size and forecast 2024-2029 ($ million)
- Exhibits23: Chart on Global Market: Year-over-year growth 2024-2029 (%)
- Exhibits24: Data Table on Global Market: Year-over-year growth 2024-2029 (%)
- Exhibits25: Historic Market Size - Data Table on Global Intravenous (IV) Fluid Monitoring Devices Market 2019 - 2023 ($ million)
- Exhibits26: Historic Market Size - End-user Segment 2019 - 2023 ($ million)
- Exhibits27: Historic Market Size - Type Segment 2019 - 2023 ($ million)
- Exhibits28: Historic Market Size - Technology Segment 2019 - 2023 ($ million)
- Exhibits29: Historic Market Size - Geography Segment 2019 - 2023 ($ million)
- Exhibits30: Historic Market Size - Country Segment 2019 - 2023 ($ million)
- Exhibits31: Five forces analysis - Comparison between 2024 and 2029
- Exhibits32: Bargaining power of buyers - Impact of key factors 2024 and 2029
- Exhibits33: Bargaining power of suppliers - Impact of key factors in 2024 and 2029
- Exhibits34: Threat of new entrants - Impact of key factors in 2024 and 2029
- Exhibits35: Threat of substitutes - Impact of key factors in 2024 and 2029
- Exhibits36: Threat of rivalry - Impact of key factors in 2024 and 2029
- Exhibits37: Chart on Market condition - Five forces 2024 and 2029
- Exhibits38: Chart on End-user - Market share 2024-2029 (%)
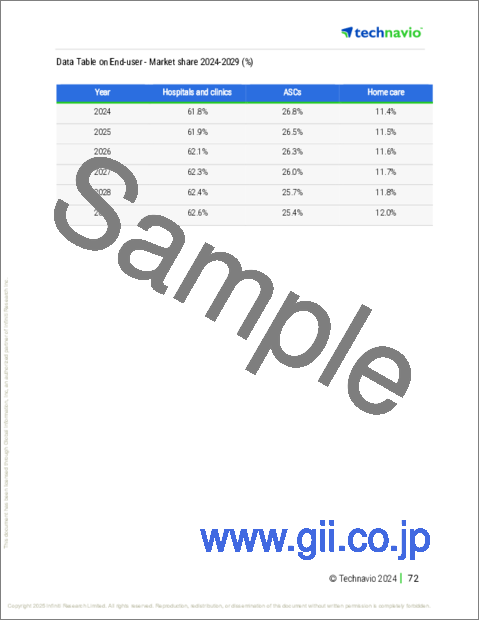
- Exhibits39: Data Table on End-user - Market share 2024-2029 (%)
- Exhibits40: Chart on Comparison by End-user
- Exhibits41: Data Table on Comparison by End-user
- Exhibits42: Chart on Hospitals and clinics - Market size and forecast 2024-2029 ($ million)
- Exhibits43: Data Table on Hospitals and clinics - Market size and forecast 2024-2029 ($ million)
- Exhibits44: Chart on Hospitals and clinics - Year-over-year growth 2024-2029 (%)
- Exhibits45: Data Table on Hospitals and clinics - Year-over-year growth 2024-2029 (%)
- Exhibits46: Chart on ASCs - Market size and forecast 2024-2029 ($ million)
- Exhibits47: Data Table on ASCs - Market size and forecast 2024-2029 ($ million)
- Exhibits48: Chart on ASCs - Year-over-year growth 2024-2029 (%)
- Exhibits49: Data Table on ASCs - Year-over-year growth 2024-2029 (%)
- Exhibits50: Chart on Home care - Market size and forecast 2024-2029 ($ million)
- Exhibits51: Data Table on Home care - Market size and forecast 2024-2029 ($ million)
- Exhibits52: Chart on Home care - Year-over-year growth 2024-2029 (%)
- Exhibits53: Data Table on Home care - Year-over-year growth 2024-2029 (%)
- Exhibits54: Market opportunity by End-user ($ million)
- Exhibits55: Data Table on Market opportunity by End-user ($ million)
- Exhibits56: Chart on Type - Market share 2024-2029 (%)
- Exhibits57: Data Table on Type - Market share 2024-2029 (%)
- Exhibits58: Chart on Comparison by Type
- Exhibits59: Data Table on Comparison by Type
- Exhibits60: Chart on Desktop - Market size and forecast 2024-2029 ($ million)
- Exhibits61: Data Table on Desktop - Market size and forecast 2024-2029 ($ million)
- Exhibits62: Chart on Desktop - Year-over-year growth 2024-2029 (%)
- Exhibits63: Data Table on Desktop - Year-over-year growth 2024-2029 (%)
- Exhibits64: Chart on Portable - Market size and forecast 2024-2029 ($ million)
- Exhibits65: Data Table on Portable - Market size and forecast 2024-2029 ($ million)
- Exhibits66: Chart on Portable - Year-over-year growth 2024-2029 (%)
- Exhibits67: Data Table on Portable - Year-over-year growth 2024-2029 (%)
- Exhibits68: Market opportunity by Type ($ million)
- Exhibits69: Data Table on Market opportunity by Type ($ million)
- Exhibits70: Chart on Technology - Market share 2024-2029 (%)
- Exhibits71: Data Table on Technology - Market share 2024-2029 (%)
- Exhibits72: Chart on Comparison by Technology
- Exhibits73: Data Table on Comparison by Technology
- Exhibits74: Chart on Smart devices - Market size and forecast 2024-2029 ($ million)
- Exhibits75: Data Table on Smart devices - Market size and forecast 2024-2029 ($ million)
- Exhibits76: Chart on Smart devices - Year-over-year growth 2024-2029 (%)
- Exhibits77: Data Table on Smart devices - Year-over-year growth 2024-2029 (%)
- Exhibits78: Chart on Traditional monitoring systems - Market size and forecast 2024-2029 ($ million)
- Exhibits79: Data Table on Traditional monitoring systems - Market size and forecast 2024-2029 ($ million)
- Exhibits80: Chart on Traditional monitoring systems - Year-over-year growth 2024-2029 (%)
- Exhibits81: Data Table on Traditional monitoring systems - Year-over-year growth 2024-2029 (%)
- Exhibits82: Market opportunity by Technology ($ million)
- Exhibits83: Data Table on Market opportunity by Technology ($ million)
- Exhibits84: Analysis of price sensitivity, lifecycle, customer purchase basket, adoption rates, and purchase criteria
- Exhibits85: Chart on Market share By Geographical Landscape 2024-2029 (%)
- Exhibits86: Data Table on Market share By Geographical Landscape 2024-2029 (%)
- Exhibits87: Chart on Geographic comparison
- Exhibits88: Data Table on Geographic comparison
- Exhibits89: Chart on North America - Market size and forecast 2024-2029 ($ million)
- Exhibits90: Data Table on North America - Market size and forecast 2024-2029 ($ million)
- Exhibits91: Chart on North America - Year-over-year growth 2024-2029 (%)
- Exhibits92: Data Table on North America - Year-over-year growth 2024-2029 (%)
- Exhibits93: Chart on Europe - Market size and forecast 2024-2029 ($ million)
- Exhibits94: Data Table on Europe - Market size and forecast 2024-2029 ($ million)
- Exhibits95: Chart on Europe - Year-over-year growth 2024-2029 (%)
- Exhibits96: Data Table on Europe - Year-over-year growth 2024-2029 (%)
- Exhibits97: Chart on Asia - Market size and forecast 2024-2029 ($ million)
- Exhibits98: Data Table on Asia - Market size and forecast 2024-2029 ($ million)
- Exhibits99: Chart on Asia - Year-over-year growth 2024-2029 (%)
- Exhibits100: Data Table on Asia - Year-over-year growth 2024-2029 (%)
- Exhibits101: Chart on Rest of World (ROW) - Market size and forecast 2024-2029 ($ million)
- Exhibits102: Data Table on Rest of World (ROW) - Market size and forecast 2024-2029 ($ million)
- Exhibits103: Chart on Rest of World (ROW) - Year-over-year growth 2024-2029 (%)
- Exhibits104: Data Table on Rest of World (ROW) - Year-over-year growth 2024-2029 (%)
- Exhibits105: Chart on US - Market size and forecast 2024-2029 ($ million)
- Exhibits106: Data Table on US - Market size and forecast 2024-2029 ($ million)
- Exhibits107: Chart on US - Year-over-year growth 2024-2029 (%)
- Exhibits108: Data Table on US - Year-over-year growth 2024-2029 (%)
- Exhibits109: Chart on Canada - Market size and forecast 2024-2029 ($ million)
- Exhibits110: Data Table on Canada - Market size and forecast 2024-2029 ($ million)
- Exhibits111: Chart on Canada - Year-over-year growth 2024-2029 (%)
- Exhibits112: Data Table on Canada - Year-over-year growth 2024-2029 (%)
- Exhibits113: Chart on Germany - Market size and forecast 2024-2029 ($ million)
- Exhibits114: Data Table on Germany - Market size and forecast 2024-2029 ($ million)
- Exhibits115: Chart on Germany - Year-over-year growth 2024-2029 (%)
- Exhibits116: Data Table on Germany - Year-over-year growth 2024-2029 (%)
- Exhibits117: Chart on France - Market size and forecast 2024-2029 ($ million)
- Exhibits118: Data Table on France - Market size and forecast 2024-2029 ($ million)
- Exhibits119: Chart on France - Year-over-year growth 2024-2029 (%)
- Exhibits120: Data Table on France - Year-over-year growth 2024-2029 (%)
- Exhibits121: Chart on China - Market size and forecast 2024-2029 ($ million)
- Exhibits122: Data Table on China - Market size and forecast 2024-2029 ($ million)
- Exhibits123: Chart on China - Year-over-year growth 2024-2029 (%)
- Exhibits124: Data Table on China - Year-over-year growth 2024-2029 (%)
- Exhibits125: Chart on UK - Market size and forecast 2024-2029 ($ million)
- Exhibits126: Data Table on UK - Market size and forecast 2024-2029 ($ million)
- Exhibits127: Chart on UK - Year-over-year growth 2024-2029 (%)
- Exhibits128: Data Table on UK - Year-over-year growth 2024-2029 (%)
- Exhibits129: Chart on Japan - Market size and forecast 2024-2029 ($ million)
- Exhibits130: Data Table on Japan - Market size and forecast 2024-2029 ($ million)
- Exhibits131: Chart on Japan - Year-over-year growth 2024-2029 (%)
- Exhibits132: Data Table on Japan - Year-over-year growth 2024-2029 (%)
- Exhibits133: Chart on Brazil - Market size and forecast 2024-2029 ($ million)
- Exhibits134: Data Table on Brazil - Market size and forecast 2024-2029 ($ million)
- Exhibits135: Chart on Brazil - Year-over-year growth 2024-2029 (%)
- Exhibits136: Data Table on Brazil - Year-over-year growth 2024-2029 (%)
- Exhibits137: Chart on India - Market size and forecast 2024-2029 ($ million)
- Exhibits138: Data Table on India - Market size and forecast 2024-2029 ($ million)
- Exhibits139: Chart on India - Year-over-year growth 2024-2029 (%)
- Exhibits140: Data Table on India - Year-over-year growth 2024-2029 (%)
- Exhibits141: Chart on Italy - Market size and forecast 2024-2029 ($ million)
- Exhibits142: Data Table on Italy - Market size and forecast 2024-2029 ($ million)
- Exhibits143: Chart on Italy - Year-over-year growth 2024-2029 (%)
- Exhibits144: Data Table on Italy - Year-over-year growth 2024-2029 (%)
- Exhibits145: Market opportunity By Geographical Landscape ($ million)
- Exhibits146: Data Tables on Market opportunity By Geographical Landscape ($ million)
- Exhibits147: Impact of drivers and challenges in 2024 and 2029
- Exhibits148: Overview on criticality of inputs and factors of differentiation
- Exhibits149: Overview on factors of disruption
- Exhibits150: Impact of key risks on business
- Exhibits151: Companies covered
- Exhibits152: Company ranking index
- Exhibits153: Matrix on companies position and classification
- Exhibits154: B.Braun SE - Overview
- Exhibits155: B.Braun SE - Product / Service
- Exhibits156: B.Braun SE - Key news
- Exhibits157: B.Braun SE - Key offerings
- Exhibits158: SWOT
- Exhibits159: Baxter International Inc. - Overview
- Exhibits160: Baxter International Inc. - Business segments
- Exhibits161: Baxter International Inc. - Key news
- Exhibits162: Baxter International Inc. - Key offerings
- Exhibits163: Baxter International Inc. - Segment focus
- Exhibits164: SWOT
- Exhibits165: BC Group International Inc. - Overview
- Exhibits166: BC Group International Inc. - Product / Service
- Exhibits167: BC Group International Inc. - Key offerings
- Exhibits168: SWOT
- Exhibits169: Becton Dickinson and Co. - Overview
- Exhibits170: Becton Dickinson and Co. - Business segments
- Exhibits171: Becton Dickinson and Co. - Key news
- Exhibits172: Becton Dickinson and Co. - Key offerings
- Exhibits173: Becton Dickinson and Co. - Segment focus
- Exhibits174: SWOT
- Exhibits175: Datrend Systems Inc. - Overview
- Exhibits176: Datrend Systems Inc. - Product / Service
- Exhibits177: Datrend Systems Inc. - Key offerings
- Exhibits178: SWOT
- Exhibits179: EVELABS TECHNOLOGIES Pvt. Ltd. - Overview
- Exhibits180: EVELABS TECHNOLOGIES Pvt. Ltd. - Product / Service
- Exhibits181: EVELABS TECHNOLOGIES Pvt. Ltd. - Key offerings
- Exhibits182: SWOT
- Exhibits183: FIVAmed Inc. - Overview
- Exhibits184: FIVAmed Inc. - Product / Service
- Exhibits185: FIVAmed Inc. - Key offerings
- Exhibits186: SWOT
- Exhibits187: Fortive Corp. - Overview
- Exhibits188: Fortive Corp. - Business segments
- Exhibits189: Fortive Corp. - Key news
- Exhibits190: Fortive Corp. - Key offerings
- Exhibits191: Fortive Corp. - Segment focus
- Exhibits192: SWOT
- Exhibits193: ICU Medical Inc. - Overview
- Exhibits194: ICU Medical Inc. - Product / Service
- Exhibits195: ICU Medical Inc. - Key offerings
- Exhibits196: SWOT
- Exhibits197: IRadimed Corp. - Overview
- Exhibits198: IRadimed Corp. - Product / Service
- Exhibits199: IRadimed Corp. - Key offerings
- Exhibits200: SWOT
- Exhibits201: ivWatch LLC - Overview
- Exhibits202: ivWatch LLC - Product / Service
- Exhibits203: ivWatch LLC - Key offerings
- Exhibits204: SWOT
- Exhibits205: Micrel Medical Devices SA - Overview
- Exhibits206: Micrel Medical Devices SA - Product / Service
- Exhibits207: Micrel Medical Devices SA - Key offerings
- Exhibits208: SWOT
- Exhibits209: Seaward Electronic Ltd. - Overview
- Exhibits210: Seaward Electronic Ltd. - Product / Service
- Exhibits211: Seaward Electronic Ltd. - Key offerings
- Exhibits212: SWOT
- Exhibits213: Shift Labs Inc. - Overview
- Exhibits214: Shift Labs Inc. - Product / Service
- Exhibits215: Shift Labs Inc. - Key offerings
- Exhibits216: SWOT
- Exhibits217: Sino Medical Device Technology Co. Ltd. - Overview
- Exhibits218: Sino Medical Device Technology Co. Ltd. - Product / Service
- Exhibits219: Sino Medical Device Technology Co. Ltd. - Key offerings
- Exhibits220: SWOT
- Exhibits221: Inclusions checklist
- Exhibits222: Exclusions checklist
- Exhibits223: Currency conversion rates for US$
- Exhibits224: Research methodology
- Exhibits225: Information sources
- Exhibits226: Data validation
- Exhibits227: Validation techniques employed for market sizing
- Exhibits228: Data synthesis
- Exhibits229: 360 degree market analysis
- Exhibits230: List of abbreviations
The intravenous (IV) fluid monitoring devices market is forecasted to grow by USD 2489.3 mn during 2024-2029, accelerating at a CAGR of 8.5% during the forecast period. The report on the intravenous (IV) fluid monitoring devices market provides a holistic analysis, market size and forecast, trends, growth drivers, and challenges, as well as vendor analysis covering around 25 vendors.
The report offers an up-to-date analysis regarding the current market scenario, the latest trends and drivers, and the overall market environment. The market is driven by increase in number of hospitalizations, increasing use of infusion therapy devices in home care settings, and increasing focus on emerging countries.
| Market Scope | |
|---|---|
| Base Year | 2025 |
| End Year | 2029 |
| Series Year | 2025-2029 |
| Growth Momentum | Accelerate |
| YOY 2025 | 7.7% |
| CAGR | 8.5% |
| Incremental Value | $2489.3 mn |
The study was conducted using an objective combination of primary and secondary information including inputs from key participants in the industry. The report contains a comprehensive market size data, segment with regional analysis and vendor landscape in addition to an analysis of the key companies. Reports have historic and forecast data.
Technavio's intravenous (IV) fluid monitoring devices market is segmented as below:
By End-user
- Hospitals and clinics
- ASCs
- Home care
By Type
- Desktop
- Portable
By Technology
- Smart devices
- Traditional monitoring systems
By Geographical Landscape
- North America
- Europe
- Asia
- Rest of World (ROW)
This study identifies the increasing incidence of diseases as one of the prime reasons driving the intravenous (IV) fluid monitoring devices market growth during the next few years. Also, emergence of smart infusion therapy devices and technological advancements in iv fluid monitoring devices will lead to sizable demand in the market.
The report on the intravenous (IV) fluid monitoring devices market covers the following areas:
- Intravenous (IV) Fluid Monitoring Devices Market sizing
- Intravenous (IV) Fluid Monitoring Devices Market forecast
- Intravenous (IV) Fluid Monitoring Devices Market industry analysis
The robust vendor analysis is designed to help clients improve their market position, and in line with this, this report provides a detailed analysis of several leading intravenous (IV) fluid monitoring devices market vendors that include B.Braun SE, Baxter International Inc., BC Group International Inc., Becton Dickinson and Co., Datrend Systems Inc., EVELABS TECHNOLOGIES Pvt. Ltd., FIVAmed Inc., Fortive Corp., Gossen Metrawatt GmbH, ICU Medical Inc., IRadimed Corp., ivWatch LLC, Micrel Medical Devices SA, MONIDOR Oy Ltd., NETECH Corp., Pentland Medical Ltd., Pronk Technologies Inc., Seaward Electronic Ltd., Shift Labs Inc., and Sino Medical Device Technology Co. Ltd.. Also, the intravenous (IV) fluid monitoring devices market analysis report includes information on upcoming trends and challenges that will influence market growth. This is to help companies strategize and leverage all forthcoming growth opportunities.
The publisher presents a detailed picture of the market by the way of study, synthesis, and summation of data from multiple sources by an analysis of key parameters such as profit, pricing, competition, and promotions. It presents various market facets by identifying the key industry influencers. The data presented is comprehensive, reliable, and a result of extensive primary and secondary research. The market research reports provide a complete competitive landscape and an in-depth vendor selection methodology and analysis using qualitative and quantitative research to forecast accurate market growth.
Table of Contents
1 Executive Summary
- 1.1 Market overview
- Executive Summary - Chart on Market Overview
- Executive Summary - Data Table on Market Overview
- Executive Summary - Chart on Global Market Characteristics
- Executive Summary - Chart on Market By Geographical Landscape
- Executive Summary - Chart on Market Segmentation by End-user
- Executive Summary - Chart on Market Segmentation by Type
- Executive Summary - Chart on Market Segmentation by Technology
- Executive Summary - Chart on Incremental Growth
- Executive Summary - Data Table on Incremental Growth
- Executive Summary - Chart on Company Market Positioning
2 Technavio Analysis
- 2.1 Analysis of price sensitivity, lifecycle, customer purchase basket, adoption rates, and purchase criteria
- Analysis of price sensitivity, lifecycle, customer purchase basket, adoption rates, and purchase criteria
- 2.2 Criticality of inputs and Factors of differentiation
- Overview on criticality of inputs and factors of differentiation
- 2.3 Factors of disruption
- Overview on factors of disruption
- 2.4 Impact of drivers and challenges
- Impact of drivers and challenges in 2024 and 2029
3 Market Landscape
- 3.1 Market ecosystem
- Parent Market
- Data Table on - Parent Market
- 3.2 Market characteristics
- Market characteristics analysis
- 3.3 Value chain analysis
- Value chain analysis
4 Market Sizing
- 4.1 Market definition
- Offerings of companies included in the market definition
- 4.2 Market segment analysis
- Market segments
- 4.3 Market size 2024
- 4.4 Market outlook: Forecast for 2024-2029
- Chart on Global - Market size and forecast 2024-2029 ($ million)
- Data Table on Global - Market size and forecast 2024-2029 ($ million)
- Chart on Global Market: Year-over-year growth 2024-2029 (%)
- Data Table on Global Market: Year-over-year growth 2024-2029 (%)
5 Historic Market Size
- 5.1 Global Intravenous (IV) Fluid Monitoring Devices Market 2019 - 2023
- Historic Market Size - Data Table on Global Intravenous (IV) Fluid Monitoring Devices Market 2019 - 2023 ($ million)
- 5.2 End-user segment analysis 2019 - 2023
- Historic Market Size - End-user Segment 2019 - 2023 ($ million)
- 5.3 Type segment analysis 2019 - 2023
- Historic Market Size - Type Segment 2019 - 2023 ($ million)
- 5.4 Technology segment analysis 2019 - 2023
- Historic Market Size - Technology Segment 2019 - 2023 ($ million)
- 5.5 Geography segment analysis 2019 - 2023
- Historic Market Size - Geography Segment 2019 - 2023 ($ million)
- 5.6 Country segment analysis 2019 - 2023
- Historic Market Size - Country Segment 2019 - 2023 ($ million)
6 Qualitative Analysis
- 6.1 Impact of AI on global intravenous (IV) fluid monitoring devices market
7 Five Forces Analysis
- 7.1 Five forces summary
- Five forces analysis - Comparison between 2024 and 2029
- 7.2 Bargaining power of buyers
- Bargaining power of buyers - Impact of key factors 2024 and 2029
- 7.3 Bargaining power of suppliers
- Bargaining power of suppliers - Impact of key factors in 2024 and 2029
- 7.4 Threat of new entrants
- Threat of new entrants - Impact of key factors in 2024 and 2029
- 7.5 Threat of substitutes
- Threat of substitutes - Impact of key factors in 2024 and 2029
- 7.6 Threat of rivalry
- Threat of rivalry - Impact of key factors in 2024 and 2029
- 7.7 Market condition
- Chart on Market condition - Five forces 2024 and 2029
8 Market Segmentation by End-user
- 8.1 Market segments
- Chart on End-user - Market share 2024-2029 (%)
- Data Table on End-user - Market share 2024-2029 (%)
- 8.2 Comparison by End-user
- Chart on Comparison by End-user
- Data Table on Comparison by End-user
- 8.3 Hospitals and clinics - Market size and forecast 2024-2029
- Chart on Hospitals and clinics - Market size and forecast 2024-2029 ($ million)
- Data Table on Hospitals and clinics - Market size and forecast 2024-2029 ($ million)
- Chart on Hospitals and clinics - Year-over-year growth 2024-2029 (%)
- Data Table on Hospitals and clinics - Year-over-year growth 2024-2029 (%)
- 8.4 ASCs - Market size and forecast 2024-2029
- Chart on ASCs - Market size and forecast 2024-2029 ($ million)
- Data Table on ASCs - Market size and forecast 2024-2029 ($ million)
- Chart on ASCs - Year-over-year growth 2024-2029 (%)
- Data Table on ASCs - Year-over-year growth 2024-2029 (%)
- 8.5 Home care - Market size and forecast 2024-2029
- Chart on Home care - Market size and forecast 2024-2029 ($ million)
- Data Table on Home care - Market size and forecast 2024-2029 ($ million)
- Chart on Home care - Year-over-year growth 2024-2029 (%)
- Data Table on Home care - Year-over-year growth 2024-2029 (%)
- 8.6 Market opportunity by End-user
- Market opportunity by End-user ($ million)
- Data Table on Market opportunity by End-user ($ million)
9 Market Segmentation by Type
- 9.1 Market segments
- Chart on Type - Market share 2024-2029 (%)
- Data Table on Type - Market share 2024-2029 (%)
- 9.2 Comparison by Type
- Chart on Comparison by Type
- Data Table on Comparison by Type
- 9.3 Desktop - Market size and forecast 2024-2029
- Chart on Desktop - Market size and forecast 2024-2029 ($ million)
- Data Table on Desktop - Market size and forecast 2024-2029 ($ million)
- Chart on Desktop - Year-over-year growth 2024-2029 (%)
- Data Table on Desktop - Year-over-year growth 2024-2029 (%)
- 9.4 Portable - Market size and forecast 2024-2029
- Chart on Portable - Market size and forecast 2024-2029 ($ million)
- Data Table on Portable - Market size and forecast 2024-2029 ($ million)
- Chart on Portable - Year-over-year growth 2024-2029 (%)
- Data Table on Portable - Year-over-year growth 2024-2029 (%)
- 9.5 Market opportunity by Type
- Market opportunity by Type ($ million)
- Data Table on Market opportunity by Type ($ million)
10 Market Segmentation by Technology
- 10.1 Market segments
- Chart on Technology - Market share 2024-2029 (%)
- Data Table on Technology - Market share 2024-2029 (%)
- 10.2 Comparison by Technology
- Chart on Comparison by Technology
- Data Table on Comparison by Technology
- 10.3 Smart devices - Market size and forecast 2024-2029
- Chart on Smart devices - Market size and forecast 2024-2029 ($ million)
- Data Table on Smart devices - Market size and forecast 2024-2029 ($ million)
- Chart on Smart devices - Year-over-year growth 2024-2029 (%)
- Data Table on Smart devices - Year-over-year growth 2024-2029 (%)
- 10.4 Traditional monitoring systems - Market size and forecast 2024-2029
- Chart on Traditional monitoring systems - Market size and forecast 2024-2029 ($ million)
- Data Table on Traditional monitoring systems - Market size and forecast 2024-2029 ($ million)
- Chart on Traditional monitoring systems - Year-over-year growth 2024-2029 (%)
- Data Table on Traditional monitoring systems - Year-over-year growth 2024-2029 (%)
- 10.5 Market opportunity by Technology
- Market opportunity by Technology ($ million)
- Data Table on Market opportunity by Technology ($ million)
11 Customer Landscape
- 11.1 Customer landscape overview
- Analysis of price sensitivity, lifecycle, customer purchase basket, adoption rates, and purchase criteria
12 Geographic Landscape
- 12.1 Geographic segmentation
- Chart on Market share By Geographical Landscape 2024-2029 (%)
- Data Table on Market share By Geographical Landscape 2024-2029 (%)
- 12.2 Geographic comparison
- Chart on Geographic comparison
- Data Table on Geographic comparison
- 12.3 North America - Market size and forecast 2024-2029
- Chart on North America - Market size and forecast 2024-2029 ($ million)
- Data Table on North America - Market size and forecast 2024-2029 ($ million)
- Chart on North America - Year-over-year growth 2024-2029 (%)
- Data Table on North America - Year-over-year growth 2024-2029 (%)
- 12.4 Europe - Market size and forecast 2024-2029
- Chart on Europe - Market size and forecast 2024-2029 ($ million)
- Data Table on Europe - Market size and forecast 2024-2029 ($ million)
- Chart on Europe - Year-over-year growth 2024-2029 (%)
- Data Table on Europe - Year-over-year growth 2024-2029 (%)
- 12.5 Asia - Market size and forecast 2024-2029
- Chart on Asia - Market size and forecast 2024-2029 ($ million)
- Data Table on Asia - Market size and forecast 2024-2029 ($ million)
- Chart on Asia - Year-over-year growth 2024-2029 (%)
- Data Table on Asia - Year-over-year growth 2024-2029 (%)
- 12.6 Rest of World (ROW) - Market size and forecast 2024-2029
- Chart on Rest of World (ROW) - Market size and forecast 2024-2029 ($ million)
- Data Table on Rest of World (ROW) - Market size and forecast 2024-2029 ($ million)
- Chart on Rest of World (ROW) - Year-over-year growth 2024-2029 (%)
- Data Table on Rest of World (ROW) - Year-over-year growth 2024-2029 (%)
- 12.7 US - Market size and forecast 2024-2029
- Chart on US - Market size and forecast 2024-2029 ($ million)
- Data Table on US - Market size and forecast 2024-2029 ($ million)
- Chart on US - Year-over-year growth 2024-2029 (%)
- Data Table on US - Year-over-year growth 2024-2029 (%)
- 12.8 Canada - Market size and forecast 2024-2029
- Chart on Canada - Market size and forecast 2024-2029 ($ million)
- Data Table on Canada - Market size and forecast 2024-2029 ($ million)
- Chart on Canada - Year-over-year growth 2024-2029 (%)
- Data Table on Canada - Year-over-year growth 2024-2029 (%)
- 12.9 Germany - Market size and forecast 2024-2029
- Chart on Germany - Market size and forecast 2024-2029 ($ million)
- Data Table on Germany - Market size and forecast 2024-2029 ($ million)
- Chart on Germany - Year-over-year growth 2024-2029 (%)
- Data Table on Germany - Year-over-year growth 2024-2029 (%)
- 12.10 France - Market size and forecast 2024-2029
- Chart on France - Market size and forecast 2024-2029 ($ million)
- Data Table on France - Market size and forecast 2024-2029 ($ million)
- Chart on France - Year-over-year growth 2024-2029 (%)
- Data Table on France - Year-over-year growth 2024-2029 (%)
- 12.11 China - Market size and forecast 2024-2029
- Chart on China - Market size and forecast 2024-2029 ($ million)
- Data Table on China - Market size and forecast 2024-2029 ($ million)
- Chart on China - Year-over-year growth 2024-2029 (%)
- Data Table on China - Year-over-year growth 2024-2029 (%)
- 12.12 UK - Market size and forecast 2024-2029
- Chart on UK - Market size and forecast 2024-2029 ($ million)
- Data Table on UK - Market size and forecast 2024-2029 ($ million)
- Chart on UK - Year-over-year growth 2024-2029 (%)
- Data Table on UK - Year-over-year growth 2024-2029 (%)
- 12.13 Japan - Market size and forecast 2024-2029
- Chart on Japan - Market size and forecast 2024-2029 ($ million)
- Data Table on Japan - Market size and forecast 2024-2029 ($ million)
- Chart on Japan - Year-over-year growth 2024-2029 (%)
- Data Table on Japan - Year-over-year growth 2024-2029 (%)
- 12.14 Brazil - Market size and forecast 2024-2029
- Chart on Brazil - Market size and forecast 2024-2029 ($ million)
- Data Table on Brazil - Market size and forecast 2024-2029 ($ million)
- Chart on Brazil - Year-over-year growth 2024-2029 (%)
- Data Table on Brazil - Year-over-year growth 2024-2029 (%)
- 12.15 India - Market size and forecast 2024-2029
- Chart on India - Market size and forecast 2024-2029 ($ million)
- Data Table on India - Market size and forecast 2024-2029 ($ million)
- Chart on India - Year-over-year growth 2024-2029 (%)
- Data Table on India - Year-over-year growth 2024-2029 (%)
- 12.16 Italy - Market size and forecast 2024-2029
- Chart on Italy - Market size and forecast 2024-2029 ($ million)
- Data Table on Italy - Market size and forecast 2024-2029 ($ million)
- Chart on Italy - Year-over-year growth 2024-2029 (%)
- Data Table on Italy - Year-over-year growth 2024-2029 (%)
- 12.17 Market opportunity By Geographical Landscape
- Market opportunity By Geographical Landscape ($ million)
- Data Tables on Market opportunity By Geographical Landscape ($ million)
13 Drivers, Challenges, and Opportunity/Restraints
- 13.1 Market drivers
- 13.2 Market challenges
- 13.3 Impact of drivers and challenges
- Impact of drivers and challenges in 2024 and 2029
- 13.4 Market opportunities/restraints
14 Competitive Landscape
- 14.1 Overview
- 14.2 Competitive Landscape
- Overview on criticality of inputs and factors of differentiation
- 14.3 Landscape disruption
- Overview on factors of disruption
- 14.4 Industry risks
- Impact of key risks on business
15 Competitive Analysis
- 15.1 Companies profiled
- Companies covered
- 15.2 Company ranking index
- Company ranking index
- 15.3 Market positioning of companies
- Matrix on companies position and classification
- 15.4 B.Braun SE
- B.Braun SE - Overview
- B.Braun SE - Product / Service
- B.Braun SE - Key news
- B.Braun SE - Key offerings
- SWOT
- 15.5 Baxter International Inc.
- Baxter International Inc. - Overview
- Baxter International Inc. - Business segments
- Baxter International Inc. - Key news
- Baxter International Inc. - Key offerings
- Baxter International Inc. - Segment focus
- SWOT
- 15.6 BC Group International Inc.
- BC Group International Inc. - Overview
- BC Group International Inc. - Product / Service
- BC Group International Inc. - Key offerings
- SWOT
- 15.7 Becton Dickinson and Co.
- Becton Dickinson and Co. - Overview
- Becton Dickinson and Co. - Business segments
- Becton Dickinson and Co. - Key news
- Becton Dickinson and Co. - Key offerings
- Becton Dickinson and Co. - Segment focus
- SWOT
- 15.8 Datrend Systems Inc.
- Datrend Systems Inc. - Overview
- Datrend Systems Inc. - Product / Service
- Datrend Systems Inc. - Key offerings
- SWOT
- 15.9 EVELABS TECHNOLOGIES Pvt. Ltd.
- EVELABS TECHNOLOGIES Pvt. Ltd. - Overview
- EVELABS TECHNOLOGIES Pvt. Ltd. - Product / Service
- EVELABS TECHNOLOGIES Pvt. Ltd. - Key offerings
- SWOT
- 15.10 FIVAmed Inc.
- FIVAmed Inc. - Overview
- FIVAmed Inc. - Product / Service
- FIVAmed Inc. - Key offerings
- SWOT
- 15.11 Fortive Corp.
- Fortive Corp. - Overview
- Fortive Corp. - Business segments
- Fortive Corp. - Key news
- Fortive Corp. - Key offerings
- Fortive Corp. - Segment focus
- SWOT
- 15.12 ICU Medical Inc.
- ICU Medical Inc. - Overview
- ICU Medical Inc. - Product / Service
- ICU Medical Inc. - Key offerings
- SWOT
- 15.13 IRadimed Corp.
- IRadimed Corp. - Overview
- IRadimed Corp. - Product / Service
- IRadimed Corp. - Key offerings
- SWOT
- 15.14 ivWatch LLC
- ivWatch LLC - Overview
- ivWatch LLC - Product / Service
- ivWatch LLC - Key offerings
- SWOT
- 15.15 Micrel Medical Devices SA
- Micrel Medical Devices SA - Overview
- Micrel Medical Devices SA - Product / Service
- Micrel Medical Devices SA - Key offerings
- SWOT
- 15.16 Seaward Electronic Ltd.
- Seaward Electronic Ltd. - Overview
- Seaward Electronic Ltd. - Product / Service
- Seaward Electronic Ltd. - Key offerings
- SWOT
- 15.17 Shift Labs Inc.
- Shift Labs Inc. - Overview
- Shift Labs Inc. - Product / Service
- Shift Labs Inc. - Key offerings
- SWOT
- 15.18 Sino Medical Device Technology Co. Ltd.
- Sino Medical Device Technology Co. Ltd. - Overview
- Sino Medical Device Technology Co. Ltd. - Product / Service
- Sino Medical Device Technology Co. Ltd. - Key offerings
- SWOT
16 Appendix
- 16.1 Scope of the report
- 16.2 Inclusions and exclusions checklist
- Inclusions checklist
- Exclusions checklist
- 16.3 Currency conversion rates for US$
- Currency conversion rates for US$
- 16.4 Research methodology
- Research methodology
- 16.5 Data procurement
- Information sources
- 16.6 Data validation
- Data validation
- 16.7 Validation techniques employed for market sizing
- Validation techniques employed for market sizing
- 16.8 Data synthesis
- Data synthesis
- 16.9 360 degree market analysis
- 360 degree market analysis
- 16.10 List of abbreviations
- List of abbreviations

