|
|
市場調査レポート
商品コード
1743405
HDMIケーブルの世界市場 2025~2029年Global HDMI Cable Market 2025-2029 |
||||||

|
|||||||
カスタマイズ可能
|
|||||||

| HDMIケーブルの世界市場 2025~2029年 |
|
出版日: 2025年05月31日
発行: TechNavio
ページ情報: 英文 224 Pages
納期: 即納可能
|

全表示
- 概要
- 図表
- 目次
HDMIケーブル市場は2024-2029年に8億9,880万米ドル、予測期間中のCAGRは4.9%で成長すると予測されます。
当レポートでは、HDMIケーブル市場の全体的な分析、市場規模・予測、動向、成長促進要因、課題、約25のベンダーを網羅したベンダー分析などを掲載しています。
現在の市場シナリオ、最新動向と促進要因、市場環境全体に関する最新分析を提供しています。市場を牽引しているのは、スマートデバイスの普及、HDMIケーブルのゲーム利用の増加、AR-VRアプリケーションとテレビでの4Kコンテンツ表示、経済的なHDMIケーブルの利用の増加などです。
| 市場範囲 | |
|---|---|
| 基準年 | 2025 |
| 終了年 | 2029 |
| 予測期間 | 2025-2029 |
| 成長モメンタム | 加速 |
| 前年比 | 4.6% |
| CAGR | 4.9% |
| 増分額 | 8億9,880万米ドル |
本調査は、業界の主要参加者からのインプットを含め、一次情報と二次情報を客観的に組み合わせて実施しました。レポートには、主要企業の分析に加え、包括的な市場規模データ、地域別分析によるセグメント、ベンダー情勢が含まれています。レポートには過去データと予測データがあります。
本調査では、今後数年間のHDMIケーブル市場成長を牽引する主な要因として、HDMI 2.1の普及拡大を挙げています。また、AR/VR/MRの採用が増加し、イーサネット付きHDMIの人気が高まっていることも、市場の大きな需要につながると思われます。
目次
第1章 エグゼクティブサマリー
- 市場概要
第2章 Technavio分析
- 価格・ライフサイクル・顧客購入バスケット・採用率・購入基準の分析
- インプットの重要性と差別化の要因
- 混乱の要因
- 促進要因と課題の影響
第3章 市場情勢
- 市場エコシステム
- 市場の特徴
- バリューチェーン分析
第4章 市場規模
- 市場の定義
- 市場セグメント分析
- 市場規模 2024
- 市場の見通し 2024-2029
第5章 市場規模実績
- HDMIケーブルの世界市場 2019-2023
- タイプ別セグメント分析 2019-2023
- 流通チャネル別セグメント分析 2019-2023
- グレードタイプ別タイプセグメント分析 2019-2023
- 地域別セグメント分析 2019-2023
- 国別セグメント分析 2019-2023
第6章 定性分析
- AIの影響: HDMIケーブルの世界市場
第7章 ファイブフォース分析
- ファイブフォースの要約
- 買い手の交渉力
- 供給企業の交渉力
- 新規参入業者の脅威
- 代替品の脅威
- 競争の脅威
- 市況
第8章 市場セグメンテーション:タイプ別
- 市場セグメント
- 比較:タイプ別
- 標準:市場規模と予測 2024-2029
- 高速:市場規模と予測 2024-2029
- 超高速:市場規模と予測 2024-2029
- 市場機会:タイプ別
第9章 市場セグメンテーション:流通チャネル別
- 市場セグメント
- 比較:流通チャネル別
- オフライン:市場規模と予測 2024-2029
- オンライン:市場規模と予測 2024-2029
- 市場機会:流通チャネル別
第10章 市場セグメンテーション:グレードタイプ別
- 市場セグメント
- 比較:グレードタイプ別
- HDMI 1.4:市場規模と予測 2024-2029
- HDMI 2.0:市場規模と予測 2024-2029
- HDMI 2.1:市場規模と予測 2024-2029
- 市場機会:グレードタイプ別
第11章 顧客情勢
- 顧客情勢の概要
第12章 地域別情勢
- 地域別セグメンテーション
- 地域別比較
- アジア太平洋:市場規模と予測 2024-2029
- 北米:市場規模と予測 2024-2029
- 欧州:市場規模と予測 2024-2029
- 南米:市場規模と予測 2024-2029
- 中東・アフリカ:市場規模と予測 2024-2029
- 米国:市場規模と予測 2024-2029
- 中国:市場規模と予測 2024-2029
- 日本:市場規模と予測 2024-2029
- インド:市場規模と予測 2024-2029
- 韓国:市場規模と予測 2024-2029
- ドイツ:市場規模と予測 2024-2029
- カナダ:市場規模と予測 2024-2029
- 英国:市場規模と予測 2024-2029
- フランス:市場規模と予測 2024-2029
- オーストラリア:市場規模と予測 2024-2029
- 市場機会:地域情勢別
第13章 促進要因・課題・機会・抑制要因
- 市場促進要因
- 市場の課題
- 促進要因と課題の影響
- 市場の機会・抑制要因
第14章 競合情勢
- 概要
- 競合情勢
- 混乱の状況
- 業界のリスク
第15章 競合分析
- 企業プロファイル
- 企業ランキング指数
- 企業の市場ポジショニング
- Amphenol Communications Solutions
- Belkin International Inc.
- Broadcom Inc.
- Ce Link
- Dell Technologies Inc.
- Eaton Corp. plc
- Hitachi Ltd.
- Honeywell International Inc.
- Intel Corp.
- Koninklijke Philips NV
- Molex LLC
- Nordost
- Panasonic Holdings Corp.
- RGB Systems Inc.
- Sony Group Corp.
第16章 付録
Exhibits:
- Exhibits1: Executive Summary - Chart on Market Overview
- Exhibits2: Executive Summary - Data Table on Market Overview
- Exhibits3: Executive Summary - Chart on Global Market Characteristics
- Exhibits4: Executive Summary - Chart on Market By Geographical Landscape
- Exhibits5: Executive Summary - Chart on Market Segmentation by Type
- Exhibits6: Executive Summary - Chart on Market Segmentation by Distribution Channel
- Exhibits7: Executive Summary - Chart on Market Segmentation by Grade Type
- Exhibits8: Executive Summary - Chart on Incremental Growth
- Exhibits9: Executive Summary - Data Table on Incremental Growth
- Exhibits10: Executive Summary - Chart on Company Market Positioning
- Exhibits11: Analysis of price sensitivity, lifecycle, customer purchase basket, adoption rates, and purchase criteria
- Exhibits12: Overview on criticality of inputs and factors of differentiation
- Exhibits13: Overview on factors of disruption
- Exhibits14: Impact of drivers and challenges in 2024 and 2029
- Exhibits15: Parent Market
- Exhibits16: Data Table on - Parent Market
- Exhibits17: Market characteristics analysis
- Exhibits18: Value chain analysis
- Exhibits19: Offerings of companies included in the market definition
- Exhibits20: Market segments
- Exhibits21: Chart on Global - Market size and forecast 2024-2029 ($ million)
- Exhibits22: Data Table on Global - Market size and forecast 2024-2029 ($ million)
- Exhibits23: Chart on Global Market: Year-over-year growth 2024-2029 (%)
- Exhibits24: Data Table on Global Market: Year-over-year growth 2024-2029 (%)
- Exhibits25: Historic Market Size - Data Table on Global HDMI Cable Market 2019 - 2023 ($ million)
- Exhibits26: Historic Market Size - Type Segment 2019 - 2023 ($ million)
- Exhibits27: Historic Market Size - Distribution Channel Segment 2019 - 2023 ($ million)
- Exhibits28: Historic Market Size - Grade Type Segment 2019 - 2023 ($ million)
- Exhibits29: Historic Market Size - Geography Segment 2019 - 2023 ($ million)
- Exhibits30: Historic Market Size - Country Segment 2019 - 2023 ($ million)
- Exhibits31: Five forces analysis - Comparison between 2024 and 2029
- Exhibits32: Bargaining power of buyers - Impact of key factors 2024 and 2029
- Exhibits33: Bargaining power of suppliers - Impact of key factors in 2024 and 2029
- Exhibits34: Threat of new entrants - Impact of key factors in 2024 and 2029
- Exhibits35: Threat of substitutes - Impact of key factors in 2024 and 2029
- Exhibits36: Threat of rivalry - Impact of key factors in 2024 and 2029
- Exhibits37: Chart on Market condition - Five forces 2024 and 2029
- Exhibits38: Chart on Type - Market share 2024-2029 (%)
- Exhibits39: Data Table on Type - Market share 2024-2029 (%)
- Exhibits40: Chart on Comparison by Type
- Exhibits41: Data Table on Comparison by Type
- Exhibits42: Chart on Standard - Market size and forecast 2024-2029 ($ million)
- Exhibits43: Data Table on Standard - Market size and forecast 2024-2029 ($ million)
- Exhibits44: Chart on Standard - Year-over-year growth 2024-2029 (%)
- Exhibits45: Data Table on Standard - Year-over-year growth 2024-2029 (%)
- Exhibits46: Chart on High-speed - Market size and forecast 2024-2029 ($ million)
- Exhibits47: Data Table on High-speed - Market size and forecast 2024-2029 ($ million)
- Exhibits48: Chart on High-speed - Year-over-year growth 2024-2029 (%)
- Exhibits49: Data Table on High-speed - Year-over-year growth 2024-2029 (%)
- Exhibits50: Chart on Ultra-high-speed - Market size and forecast 2024-2029 ($ million)
- Exhibits51: Data Table on Ultra-high-speed - Market size and forecast 2024-2029 ($ million)
- Exhibits52: Chart on Ultra-high-speed - Year-over-year growth 2024-2029 (%)
- Exhibits53: Data Table on Ultra-high-speed - Year-over-year growth 2024-2029 (%)
- Exhibits54: Market opportunity by Type ($ million)
- Exhibits55: Data Table on Market opportunity by Type ($ million)
- Exhibits56: Chart on Distribution Channel - Market share 2024-2029 (%)
- Exhibits57: Data Table on Distribution Channel - Market share 2024-2029 (%)
- Exhibits58: Chart on Comparison by Distribution Channel
- Exhibits59: Data Table on Comparison by Distribution Channel
- Exhibits60: Chart on Offline - Market size and forecast 2024-2029 ($ million)
- Exhibits61: Data Table on Offline - Market size and forecast 2024-2029 ($ million)
- Exhibits62: Chart on Offline - Year-over-year growth 2024-2029 (%)
- Exhibits63: Data Table on Offline - Year-over-year growth 2024-2029 (%)
- Exhibits64: Chart on Online - Market size and forecast 2024-2029 ($ million)
- Exhibits65: Data Table on Online - Market size and forecast 2024-2029 ($ million)
- Exhibits66: Chart on Online - Year-over-year growth 2024-2029 (%)
- Exhibits67: Data Table on Online - Year-over-year growth 2024-2029 (%)
- Exhibits68: Market opportunity by Distribution Channel ($ million)
- Exhibits69: Data Table on Market opportunity by Distribution Channel ($ million)
- Exhibits70: Chart on Grade Type - Market share 2024-2029 (%)
- Exhibits71: Data Table on Grade Type - Market share 2024-2029 (%)
- Exhibits72: Chart on Comparison by Grade Type
- Exhibits73: Data Table on Comparison by Grade Type
- Exhibits74: Chart on HDMI 1.4 - Market size and forecast 2024-2029 ($ million)
- Exhibits75: Data Table on HDMI 1.4 - Market size and forecast 2024-2029 ($ million)
- Exhibits76: Chart on HDMI 1.4 - Year-over-year growth 2024-2029 (%)
- Exhibits77: Data Table on HDMI 1.4 - Year-over-year growth 2024-2029 (%)
- Exhibits78: Chart on HDMI 2.0 - Market size and forecast 2024-2029 ($ million)
- Exhibits79: Data Table on HDMI 2.0 - Market size and forecast 2024-2029 ($ million)
- Exhibits80: Chart on HDMI 2.0 - Year-over-year growth 2024-2029 (%)
- Exhibits81: Data Table on HDMI 2.0 - Year-over-year growth 2024-2029 (%)
- Exhibits82: Chart on HDMI 2.1 - Market size and forecast 2024-2029 ($ million)
- Exhibits83: Data Table on HDMI 2.1 - Market size and forecast 2024-2029 ($ million)
- Exhibits84: Chart on HDMI 2.1 - Year-over-year growth 2024-2029 (%)
- Exhibits85: Data Table on HDMI 2.1 - Year-over-year growth 2024-2029 (%)
- Exhibits86: Market opportunity by Grade Type ($ million)
- Exhibits87: Data Table on Market opportunity by Grade Type ($ million)
- Exhibits88: Analysis of price sensitivity, lifecycle, customer purchase basket, adoption rates, and purchase criteria
- Exhibits89: Chart on Market share By Geographical Landscape 2024-2029 (%)
- Exhibits90: Data Table on Market share By Geographical Landscape 2024-2029 (%)
- Exhibits91: Chart on Geographic comparison
- Exhibits92: Data Table on Geographic comparison
- Exhibits93: Chart on APAC - Market size and forecast 2024-2029 ($ million)
- Exhibits94: Data Table on APAC - Market size and forecast 2024-2029 ($ million)
- Exhibits95: Chart on APAC - Year-over-year growth 2024-2029 (%)
- Exhibits96: Data Table on APAC - Year-over-year growth 2024-2029 (%)
- Exhibits97: Chart on North America - Market size and forecast 2024-2029 ($ million)
- Exhibits98: Data Table on North America - Market size and forecast 2024-2029 ($ million)
- Exhibits99: Chart on North America - Year-over-year growth 2024-2029 (%)
- Exhibits100: Data Table on North America - Year-over-year growth 2024-2029 (%)
- Exhibits101: Chart on Europe - Market size and forecast 2024-2029 ($ million)
- Exhibits102: Data Table on Europe - Market size and forecast 2024-2029 ($ million)
- Exhibits103: Chart on Europe - Year-over-year growth 2024-2029 (%)
- Exhibits104: Data Table on Europe - Year-over-year growth 2024-2029 (%)
- Exhibits105: Chart on South America - Market size and forecast 2024-2029 ($ million)
- Exhibits106: Data Table on South America - Market size and forecast 2024-2029 ($ million)
- Exhibits107: Chart on South America - Year-over-year growth 2024-2029 (%)
- Exhibits108: Data Table on South America - Year-over-year growth 2024-2029 (%)
- Exhibits109: Chart on Middle East and Africa - Market size and forecast 2024-2029 ($ million)
- Exhibits110: Data Table on Middle East and Africa - Market size and forecast 2024-2029 ($ million)
- Exhibits111: Chart on Middle East and Africa - Year-over-year growth 2024-2029 (%)
- Exhibits112: Data Table on Middle East and Africa - Year-over-year growth 2024-2029 (%)
- Exhibits113: Chart on US - Market size and forecast 2024-2029 ($ million)
- Exhibits114: Data Table on US - Market size and forecast 2024-2029 ($ million)
- Exhibits115: Chart on US - Year-over-year growth 2024-2029 (%)
- Exhibits116: Data Table on US - Year-over-year growth 2024-2029 (%)
- Exhibits117: Chart on China - Market size and forecast 2024-2029 ($ million)
- Exhibits118: Data Table on China - Market size and forecast 2024-2029 ($ million)
- Exhibits119: Chart on China - Year-over-year growth 2024-2029 (%)
- Exhibits120: Data Table on China - Year-over-year growth 2024-2029 (%)
- Exhibits121: Chart on Japan - Market size and forecast 2024-2029 ($ million)
- Exhibits122: Data Table on Japan - Market size and forecast 2024-2029 ($ million)
- Exhibits123: Chart on Japan - Year-over-year growth 2024-2029 (%)
- Exhibits124: Data Table on Japan - Year-over-year growth 2024-2029 (%)
- Exhibits125: Chart on India - Market size and forecast 2024-2029 ($ million)
- Exhibits126: Data Table on India - Market size and forecast 2024-2029 ($ million)
- Exhibits127: Chart on India - Year-over-year growth 2024-2029 (%)
- Exhibits128: Data Table on India - Year-over-year growth 2024-2029 (%)
- Exhibits129: Chart on South Korea - Market size and forecast 2024-2029 ($ million)
- Exhibits130: Data Table on South Korea - Market size and forecast 2024-2029 ($ million)
- Exhibits131: Chart on South Korea - Year-over-year growth 2024-2029 (%)
- Exhibits132: Data Table on South Korea - Year-over-year growth 2024-2029 (%)
- Exhibits133: Chart on Germany - Market size and forecast 2024-2029 ($ million)
- Exhibits134: Data Table on Germany - Market size and forecast 2024-2029 ($ million)
- Exhibits135: Chart on Germany - Year-over-year growth 2024-2029 (%)
- Exhibits136: Data Table on Germany - Year-over-year growth 2024-2029 (%)
- Exhibits137: Chart on Canada - Market size and forecast 2024-2029 ($ million)
- Exhibits138: Data Table on Canada - Market size and forecast 2024-2029 ($ million)
- Exhibits139: Chart on Canada - Year-over-year growth 2024-2029 (%)
- Exhibits140: Data Table on Canada - Year-over-year growth 2024-2029 (%)
- Exhibits141: Chart on UK - Market size and forecast 2024-2029 ($ million)
- Exhibits142: Data Table on UK - Market size and forecast 2024-2029 ($ million)
- Exhibits143: Chart on UK - Year-over-year growth 2024-2029 (%)
- Exhibits144: Data Table on UK - Year-over-year growth 2024-2029 (%)
- Exhibits145: Chart on France - Market size and forecast 2024-2029 ($ million)
- Exhibits146: Data Table on France - Market size and forecast 2024-2029 ($ million)
- Exhibits147: Chart on France - Year-over-year growth 2024-2029 (%)
- Exhibits148: Data Table on France - Year-over-year growth 2024-2029 (%)
- Exhibits149: Chart on Australia - Market size and forecast 2024-2029 ($ million)
- Exhibits150: Data Table on Australia - Market size and forecast 2024-2029 ($ million)
- Exhibits151: Chart on Australia - Year-over-year growth 2024-2029 (%)
- Exhibits152: Data Table on Australia - Year-over-year growth 2024-2029 (%)
- Exhibits153: Market opportunity By Geographical Landscape ($ million)
- Exhibits154: Data Tables on Market opportunity By Geographical Landscape ($ million)
- Exhibits155: Impact of drivers and challenges in 2024 and 2029
- Exhibits156: Overview on criticality of inputs and factors of differentiation
- Exhibits157: Overview on factors of disruption
- Exhibits158: Impact of key risks on business
- Exhibits159: Companies covered
- Exhibits160: Company ranking index
- Exhibits161: Matrix on companies position and classification
- Exhibits162: Amphenol Communications Solutions - Overview
- Exhibits163: Amphenol Communications Solutions - Product / Service
- Exhibits164: Amphenol Communications Solutions - Key offerings
- Exhibits165: SWOT
- Exhibits166: Belkin International Inc. - Overview
- Exhibits167: Belkin International Inc. - Product / Service
- Exhibits168: Belkin International Inc. - Key offerings
- Exhibits169: SWOT
- Exhibits170: Broadcom Inc. - Overview
- Exhibits171: Broadcom Inc. - Business segments
- Exhibits172: Broadcom Inc. - Key news
- Exhibits173: Broadcom Inc. - Key offerings
- Exhibits174: Broadcom Inc. - Segment focus
- Exhibits175: SWOT
- Exhibits176: Ce Link - Overview
- Exhibits177: Ce Link - Product / Service
- Exhibits178: Ce Link - Key offerings
- Exhibits179: SWOT
- Exhibits180: Dell Technologies Inc. - Overview
- Exhibits181: Dell Technologies Inc. - Business segments
- Exhibits182: Dell Technologies Inc. - Key news
- Exhibits183: Dell Technologies Inc. - Key offerings
- Exhibits184: Dell Technologies Inc. - Segment focus
- Exhibits185: SWOT
- Exhibits186: Eaton Corp. plc - Overview
- Exhibits187: Eaton Corp. plc - Business segments
- Exhibits188: Eaton Corp. plc - Key news
- Exhibits189: Eaton Corp. plc - Key offerings
- Exhibits190: Eaton Corp. plc - Segment focus
- Exhibits191: SWOT
- Exhibits192: Hitachi Ltd. - Overview
- Exhibits193: Hitachi Ltd. - Business segments
- Exhibits194: Hitachi Ltd. - Key news
- Exhibits195: Hitachi Ltd. - Key offerings
- Exhibits196: Hitachi Ltd. - Segment focus
- Exhibits197: SWOT
- Exhibits198: Honeywell International Inc. - Overview
- Exhibits199: Honeywell International Inc. - Business segments
- Exhibits200: Honeywell International Inc. - Key news
- Exhibits201: Honeywell International Inc. - Key offerings
- Exhibits202: Honeywell International Inc. - Segment focus
- Exhibits203: SWOT
- Exhibits204: Intel Corp. - Overview
- Exhibits205: Intel Corp. - Business segments
- Exhibits206: Intel Corp. - Key news
- Exhibits207: Intel Corp. - Key offerings
- Exhibits208: Intel Corp. - Segment focus
- Exhibits209: SWOT
- Exhibits210: Koninklijke Philips NV - Overview
- Exhibits211: Koninklijke Philips NV - Business segments
- Exhibits212: Koninklijke Philips NV - Key news
- Exhibits213: Koninklijke Philips NV - Key offerings
- Exhibits214: Koninklijke Philips NV - Segment focus
- Exhibits215: SWOT
- Exhibits216: Molex LLC - Overview
- Exhibits217: Molex LLC - Product / Service
- Exhibits218: Molex LLC - Key offerings
- Exhibits219: SWOT
- Exhibits220: Nordost - Overview
- Exhibits221: Nordost - Product / Service
- Exhibits222: Nordost - Key offerings
- Exhibits223: SWOT
- Exhibits224: Panasonic Holdings Corp. - Overview
- Exhibits225: Panasonic Holdings Corp. - Business segments
- Exhibits226: Panasonic Holdings Corp. - Key news
- Exhibits227: Panasonic Holdings Corp. - Key offerings
- Exhibits228: Panasonic Holdings Corp. - Segment focus
- Exhibits229: SWOT
- Exhibits230: RGB Systems Inc. - Overview
- Exhibits231: RGB Systems Inc. - Product / Service
- Exhibits232: RGB Systems Inc. - Key offerings
- Exhibits233: SWOT
- Exhibits234: Sony Group Corp. - Overview
- Exhibits235: Sony Group Corp. - Business segments
- Exhibits236: Sony Group Corp. - Key offerings
- Exhibits237: Sony Group Corp. - Segment focus
- Exhibits238: SWOT
- Exhibits239: Inclusions checklist
- Exhibits240: Exclusions checklist
- Exhibits241: Currency conversion rates for US$
- Exhibits242: Research methodology
- Exhibits243: Information sources
- Exhibits244: Data validation
- Exhibits245: Validation techniques employed for market sizing
- Exhibits246: Data synthesis
- Exhibits247: 360 degree market analysis
- Exhibits248: List of abbreviations
The hdmi cable market is forecasted to grow by USD 898.8 mn during 2024-2029, accelerating at a CAGR of 4.9% during the forecast period. The report on the hdmi cable market provides a holistic analysis, market size and forecast, trends, growth drivers, and challenges, as well as vendor analysis covering around 25 vendors.
The report offers an up-to-date analysis regarding the current market scenario, the latest trends and drivers, and the overall market environment. The market is driven by increasing penetration of smart devices, increased gaming use of hdmi cables, ar-vr applications and 4k content display on tvs, and increased usage of economical hdmi cables.
| Market Scope | |
|---|---|
| Base Year | 2025 |
| End Year | 2029 |
| Series Year | 2025-2029 |
| Growth Momentum | Accelerate |
| YOY 2025 | 4.6% |
| CAGR | 4.9% |
| Incremental Value | $898.8 mn |
The study was conducted using an objective combination of primary and secondary information including inputs from key participants in the industry. The report contains a comprehensive market size data, segment with regional analysis and vendor landscape in addition to an analysis of the key companies. Reports have historic and forecast data.
Technavio's hdmi cable market is segmented as below:
By Type
- Standard
- High-speed
- Ultra-high-speed
By Distribution Channel
- Offline
- Online
By Grade Type
- HDMI 1.4
- HDMI 2.0
- HDMI 2.1
By Geographical Landscape
- APAC
- North America
- Europe
- South America
- Middle East and Africa
This study identifies the growing popularity of hdmi 2.1 as one of the prime reasons driving the hdmi cable market growth during the next few years. Also, increased adoption of ar/vr/mr and growing popularity of hdmi with ethernet will lead to sizable demand in the market.
The report on the hdmi cable market covers the following areas:
- HDMI Cable Market sizing
- HDMI Cable Market forecast
- HDMI Cable Market industry analysis
The robust vendor analysis is designed to help clients improve their market position, and in line with this, this report provides a detailed analysis of several leading hdmi cable market vendors that include Amphenol Communications Solutions, Aten International Co. Ltd., Belkin International Inc., Best Buy Co. Inc., Broadcom Inc., Ce Link, Cheng Uei Precision Industry Co. Ltd., Dell Technologies Inc., Eaton Corp. plc, Hitachi Ltd., Honeywell International Inc., Intel Corp., Koninklijke Philips NV, Kramer Electronics Ltd., Molex LLC, Nordost, Panasonic Holdings Corp., RGB Systems Inc., Sony Group Corp., and Tragant Handels und Beteiligungs GmbH Co.. Also, the hdmi cable market analysis report includes information on upcoming trends and challenges that will influence market growth. This is to help companies strategize and leverage all forthcoming growth opportunities.
The publisher presents a detailed picture of the market by the way of study, synthesis, and summation of data from multiple sources by an analysis of key parameters such as profit, pricing, competition, and promotions. It presents various market facets by identifying the key industry influencers. The data presented is comprehensive, reliable, and a result of extensive primary and secondary research. The market research reports provide a complete competitive landscape and an in-depth vendor selection methodology and analysis using qualitative and quantitative research to forecast accurate market growth.
Table of Contents
1 Executive Summary
- 1.1 Market overview
- Executive Summary - Chart on Market Overview
- Executive Summary - Data Table on Market Overview
- Executive Summary - Chart on Global Market Characteristics
- Executive Summary - Chart on Market By Geographical Landscape
- Executive Summary - Chart on Market Segmentation by Type
- Executive Summary - Chart on Market Segmentation by Distribution Channel
- Executive Summary - Chart on Market Segmentation by Grade Type
- Executive Summary - Chart on Incremental Growth
- Executive Summary - Data Table on Incremental Growth
- Executive Summary - Chart on Company Market Positioning
2 Technavio Analysis
- 2.1 Analysis of price sensitivity, lifecycle, customer purchase basket, adoption rates, and purchase criteria
- Analysis of price sensitivity, lifecycle, customer purchase basket, adoption rates, and purchase criteria
- 2.2 Criticality of inputs and Factors of differentiation
- Overview on criticality of inputs and factors of differentiation
- 2.3 Factors of disruption
- Overview on factors of disruption
- 2.4 Impact of drivers and challenges
- Impact of drivers and challenges in 2024 and 2029
3 Market Landscape
- 3.1 Market ecosystem
- Parent Market
- Data Table on - Parent Market
- 3.2 Market characteristics
- Market characteristics analysis
- 3.3 Value chain analysis
- Value chain analysis
4 Market Sizing
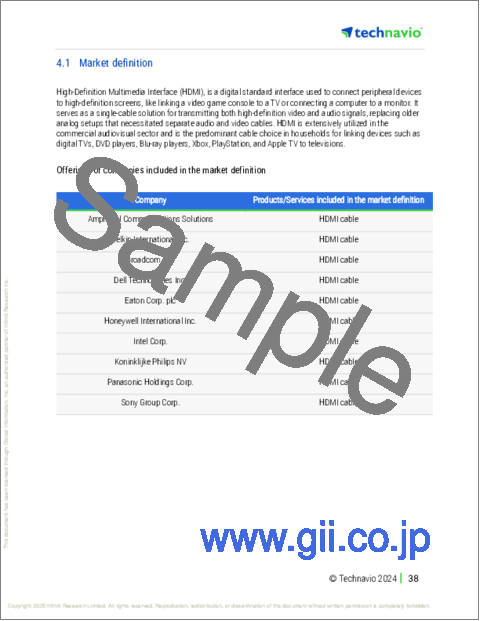
- 4.1 Market definition
- Offerings of companies included in the market definition
- 4.2 Market segment analysis
- Market segments
- 4.3 Market size 2024
- 4.4 Market outlook: Forecast for 2024-2029
- Chart on Global - Market size and forecast 2024-2029 ($ million)
- Data Table on Global - Market size and forecast 2024-2029 ($ million)
- Chart on Global Market: Year-over-year growth 2024-2029 (%)
- Data Table on Global Market: Year-over-year growth 2024-2029 (%)
5 Historic Market Size
- 5.1 Global HDMI Cable Market 2019 - 2023
- Historic Market Size - Data Table on Global HDMI Cable Market 2019 - 2023 ($ million)
- 5.2 Type segment analysis 2019 - 2023
- Historic Market Size - Type Segment 2019 - 2023 ($ million)
- 5.3 Distribution Channel segment analysis 2019 - 2023
- Historic Market Size - Distribution Channel Segment 2019 - 2023 ($ million)
- 5.4 Grade Type segment analysis 2019 - 2023
- Historic Market Size - Grade Type Segment 2019 - 2023 ($ million)
- 5.5 Geography segment analysis 2019 - 2023
- Historic Market Size - Geography Segment 2019 - 2023 ($ million)
- 5.6 Country segment analysis 2019 - 2023
- Historic Market Size - Country Segment 2019 - 2023 ($ million)
6 Qualitative Analysis
- 6.1 Impact of AI on Global HDMI Cable Market
7 Five Forces Analysis
- 7.1 Five forces summary
- Five forces analysis - Comparison between 2024 and 2029
- 7.2 Bargaining power of buyers
- Bargaining power of buyers - Impact of key factors 2024 and 2029
- 7.3 Bargaining power of suppliers
- Bargaining power of suppliers - Impact of key factors in 2024 and 2029
- 7.4 Threat of new entrants
- Threat of new entrants - Impact of key factors in 2024 and 2029
- 7.5 Threat of substitutes
- Threat of substitutes - Impact of key factors in 2024 and 2029
- 7.6 Threat of rivalry
- Threat of rivalry - Impact of key factors in 2024 and 2029
- 7.7 Market condition
- Chart on Market condition - Five forces 2024 and 2029
8 Market Segmentation by Type
- 8.1 Market segments
- Chart on Type - Market share 2024-2029 (%)
- Data Table on Type - Market share 2024-2029 (%)
- 8.2 Comparison by Type
- Chart on Comparison by Type
- Data Table on Comparison by Type
- 8.3 Standard - Market size and forecast 2024-2029
- Chart on Standard - Market size and forecast 2024-2029 ($ million)
- Data Table on Standard - Market size and forecast 2024-2029 ($ million)
- Chart on Standard - Year-over-year growth 2024-2029 (%)
- Data Table on Standard - Year-over-year growth 2024-2029 (%)
- 8.4 High-speed - Market size and forecast 2024-2029
- Chart on High-speed - Market size and forecast 2024-2029 ($ million)
- Data Table on High-speed - Market size and forecast 2024-2029 ($ million)
- Chart on High-speed - Year-over-year growth 2024-2029 (%)
- Data Table on High-speed - Year-over-year growth 2024-2029 (%)
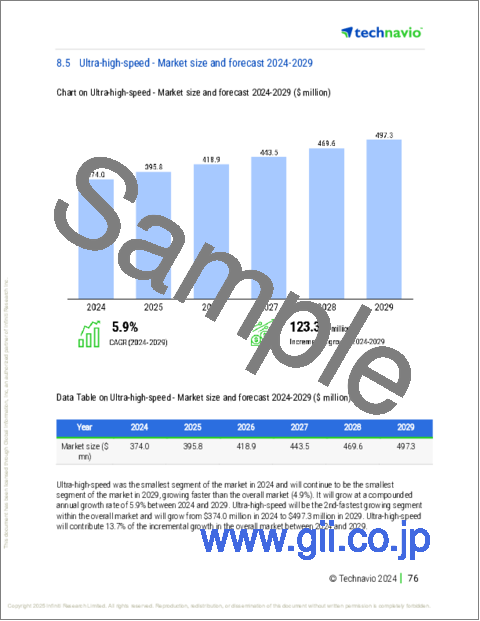
- 8.5 Ultra-high-speed - Market size and forecast 2024-2029
- Chart on Ultra-high-speed - Market size and forecast 2024-2029 ($ million)
- Data Table on Ultra-high-speed - Market size and forecast 2024-2029 ($ million)
- Chart on Ultra-high-speed - Year-over-year growth 2024-2029 (%)
- Data Table on Ultra-high-speed - Year-over-year growth 2024-2029 (%)
- 8.6 Market opportunity by Type
- Market opportunity by Type ($ million)
- Data Table on Market opportunity by Type ($ million)
9 Market Segmentation by Distribution Channel
- 9.1 Market segments
- Chart on Distribution Channel - Market share 2024-2029 (%)
- Data Table on Distribution Channel - Market share 2024-2029 (%)
- 9.2 Comparison by Distribution Channel
- Chart on Comparison by Distribution Channel
- Data Table on Comparison by Distribution Channel
- 9.3 Offline - Market size and forecast 2024-2029
- Chart on Offline - Market size and forecast 2024-2029 ($ million)
- Data Table on Offline - Market size and forecast 2024-2029 ($ million)
- Chart on Offline - Year-over-year growth 2024-2029 (%)
- Data Table on Offline - Year-over-year growth 2024-2029 (%)
- 9.4 Online - Market size and forecast 2024-2029
- Chart on Online - Market size and forecast 2024-2029 ($ million)
- Data Table on Online - Market size and forecast 2024-2029 ($ million)
- Chart on Online - Year-over-year growth 2024-2029 (%)
- Data Table on Online - Year-over-year growth 2024-2029 (%)
- 9.5 Market opportunity by Distribution Channel
- Market opportunity by Distribution Channel ($ million)
- Data Table on Market opportunity by Distribution Channel ($ million)
10 Market Segmentation by Grade Type
- 10.1 Market segments
- Chart on Grade Type - Market share 2024-2029 (%)
- Data Table on Grade Type - Market share 2024-2029 (%)
- 10.2 Comparison by Grade Type
- Chart on Comparison by Grade Type
- Data Table on Comparison by Grade Type
- 10.3 HDMI 1.4 - Market size and forecast 2024-2029
- Chart on HDMI 1.4 - Market size and forecast 2024-2029 ($ million)
- Data Table on HDMI 1.4 - Market size and forecast 2024-2029 ($ million)
- Chart on HDMI 1.4 - Year-over-year growth 2024-2029 (%)
- Data Table on HDMI 1.4 - Year-over-year growth 2024-2029 (%)
- 10.4 HDMI 2.0 - Market size and forecast 2024-2029
- Chart on HDMI 2.0 - Market size and forecast 2024-2029 ($ million)
- Data Table on HDMI 2.0 - Market size and forecast 2024-2029 ($ million)
- Chart on HDMI 2.0 - Year-over-year growth 2024-2029 (%)
- Data Table on HDMI 2.0 - Year-over-year growth 2024-2029 (%)
- 10.5 HDMI 2.1 - Market size and forecast 2024-2029
- Chart on HDMI 2.1 - Market size and forecast 2024-2029 ($ million)
- Data Table on HDMI 2.1 - Market size and forecast 2024-2029 ($ million)
- Chart on HDMI 2.1 - Year-over-year growth 2024-2029 (%)
- Data Table on HDMI 2.1 - Year-over-year growth 2024-2029 (%)
- 10.6 Market opportunity by Grade Type
- Market opportunity by Grade Type ($ million)
- Data Table on Market opportunity by Grade Type ($ million)
11 Customer Landscape
- 11.1 Customer landscape overview
- Analysis of price sensitivity, lifecycle, customer purchase basket, adoption rates, and purchase criteria
12 Geographic Landscape
- 12.1 Geographic segmentation
- Chart on Market share By Geographical Landscape 2024-2029 (%)
- Data Table on Market share By Geographical Landscape 2024-2029 (%)
- 12.2 Geographic comparison
- Chart on Geographic comparison
- Data Table on Geographic comparison
- 12.3 APAC - Market size and forecast 2024-2029
- Chart on APAC - Market size and forecast 2024-2029 ($ million)
- Data Table on APAC - Market size and forecast 2024-2029 ($ million)
- Chart on APAC - Year-over-year growth 2024-2029 (%)
- Data Table on APAC - Year-over-year growth 2024-2029 (%)
- 12.4 North America - Market size and forecast 2024-2029
- Chart on North America - Market size and forecast 2024-2029 ($ million)
- Data Table on North America - Market size and forecast 2024-2029 ($ million)
- Chart on North America - Year-over-year growth 2024-2029 (%)
- Data Table on North America - Year-over-year growth 2024-2029 (%)
- 12.5 Europe - Market size and forecast 2024-2029
- Chart on Europe - Market size and forecast 2024-2029 ($ million)
- Data Table on Europe - Market size and forecast 2024-2029 ($ million)
- Chart on Europe - Year-over-year growth 2024-2029 (%)
- Data Table on Europe - Year-over-year growth 2024-2029 (%)
- 12.6 South America - Market size and forecast 2024-2029
- Chart on South America - Market size and forecast 2024-2029 ($ million)
- Data Table on South America - Market size and forecast 2024-2029 ($ million)
- Chart on South America - Year-over-year growth 2024-2029 (%)
- Data Table on South America - Year-over-year growth 2024-2029 (%)
- 12.7 Middle East and Africa - Market size and forecast 2024-2029
- Chart on Middle East and Africa - Market size and forecast 2024-2029 ($ million)
- Data Table on Middle East and Africa - Market size and forecast 2024-2029 ($ million)
- Chart on Middle East and Africa - Year-over-year growth 2024-2029 (%)
- Data Table on Middle East and Africa - Year-over-year growth 2024-2029 (%)
- 12.8 US - Market size and forecast 2024-2029
- Chart on US - Market size and forecast 2024-2029 ($ million)
- Data Table on US - Market size and forecast 2024-2029 ($ million)
- Chart on US - Year-over-year growth 2024-2029 (%)
- Data Table on US - Year-over-year growth 2024-2029 (%)
- 12.9 China - Market size and forecast 2024-2029
- Chart on China - Market size and forecast 2024-2029 ($ million)
- Data Table on China - Market size and forecast 2024-2029 ($ million)
- Chart on China - Year-over-year growth 2024-2029 (%)
- Data Table on China - Year-over-year growth 2024-2029 (%)
- 12.10 Japan - Market size and forecast 2024-2029
- Chart on Japan - Market size and forecast 2024-2029 ($ million)
- Data Table on Japan - Market size and forecast 2024-2029 ($ million)
- Chart on Japan - Year-over-year growth 2024-2029 (%)
- Data Table on Japan - Year-over-year growth 2024-2029 (%)
- 12.11 India - Market size and forecast 2024-2029
- Chart on India - Market size and forecast 2024-2029 ($ million)
- Data Table on India - Market size and forecast 2024-2029 ($ million)
- Chart on India - Year-over-year growth 2024-2029 (%)
- Data Table on India - Year-over-year growth 2024-2029 (%)
- 12.12 South Korea - Market size and forecast 2024-2029
- Chart on South Korea - Market size and forecast 2024-2029 ($ million)
- Data Table on South Korea - Market size and forecast 2024-2029 ($ million)
- Chart on South Korea - Year-over-year growth 2024-2029 (%)
- Data Table on South Korea - Year-over-year growth 2024-2029 (%)
- 12.13 Germany - Market size and forecast 2024-2029
- Chart on Germany - Market size and forecast 2024-2029 ($ million)
- Data Table on Germany - Market size and forecast 2024-2029 ($ million)
- Chart on Germany - Year-over-year growth 2024-2029 (%)
- Data Table on Germany - Year-over-year growth 2024-2029 (%)
- 12.14 Canada - Market size and forecast 2024-2029
- Chart on Canada - Market size and forecast 2024-2029 ($ million)
- Data Table on Canada - Market size and forecast 2024-2029 ($ million)
- Chart on Canada - Year-over-year growth 2024-2029 (%)
- Data Table on Canada - Year-over-year growth 2024-2029 (%)
- 12.15 UK - Market size and forecast 2024-2029
- Chart on UK - Market size and forecast 2024-2029 ($ million)
- Data Table on UK - Market size and forecast 2024-2029 ($ million)
- Chart on UK - Year-over-year growth 2024-2029 (%)
- Data Table on UK - Year-over-year growth 2024-2029 (%)
- 12.16 France - Market size and forecast 2024-2029
- Chart on France - Market size and forecast 2024-2029 ($ million)
- Data Table on France - Market size and forecast 2024-2029 ($ million)
- Chart on France - Year-over-year growth 2024-2029 (%)
- Data Table on France - Year-over-year growth 2024-2029 (%)
- 12.17 Australia - Market size and forecast 2024-2029
- Chart on Australia - Market size and forecast 2024-2029 ($ million)
- Data Table on Australia - Market size and forecast 2024-2029 ($ million)
- Chart on Australia - Year-over-year growth 2024-2029 (%)
- Data Table on Australia - Year-over-year growth 2024-2029 (%)
- 12.18 Market opportunity By Geographical Landscape
- Market opportunity By Geographical Landscape ($ million)
- Data Tables on Market opportunity By Geographical Landscape ($ million)
13 Drivers, Challenges, and Opportunity/Restraints
- 13.1 Market drivers
- 13.2 Market challenges
- 13.3 Impact of drivers and challenges
- Impact of drivers and challenges in 2024 and 2029
- 13.4 Market opportunities/restraints
14 Competitive Landscape
- 14.1 Overview
- 14.2 Competitive Landscape
- Overview on criticality of inputs and factors of differentiation
- 14.3 Landscape disruption
- Overview on factors of disruption
- 14.4 Industry risks
- Impact of key risks on business
15 Competitive Analysis
- 15.1 Companies profiled
- Companies covered
- 15.2 Company ranking index
- Company ranking index
- 15.3 Market positioning of companies
- Matrix on companies position and classification
- 15.4 Amphenol Communications Solutions
- Amphenol Communications Solutions - Overview
- Amphenol Communications Solutions - Product / Service
- Amphenol Communications Solutions - Key offerings
- SWOT
- 15.5 Belkin International Inc.
- Belkin International Inc. - Overview
- Belkin International Inc. - Product / Service
- Belkin International Inc. - Key offerings
- SWOT
- 15.6 Broadcom Inc.
- Broadcom Inc. - Overview
- Broadcom Inc. - Business segments
- Broadcom Inc. - Key news
- Broadcom Inc. - Key offerings
- Broadcom Inc. - Segment focus
- SWOT
- 15.7 Ce Link
- Ce Link - Overview
- Ce Link - Product / Service
- Ce Link - Key offerings
- SWOT
- 15.8 Dell Technologies Inc.
- Dell Technologies Inc. - Overview
- Dell Technologies Inc. - Business segments
- Dell Technologies Inc. - Key news
- Dell Technologies Inc. - Key offerings
- Dell Technologies Inc. - Segment focus
- SWOT
- 15.9 Eaton Corp. plc
- Eaton Corp. plc - Overview
- Eaton Corp. plc - Business segments
- Eaton Corp. plc - Key news
- Eaton Corp. plc - Key offerings
- Eaton Corp. plc - Segment focus
- SWOT
- 15.10 Hitachi Ltd.
- Hitachi Ltd. - Overview
- Hitachi Ltd. - Business segments
- Hitachi Ltd. - Key news
- Hitachi Ltd. - Key offerings
- Hitachi Ltd. - Segment focus
- SWOT
- 15.11 Honeywell International Inc.
- Honeywell International Inc. - Overview
- Honeywell International Inc. - Business segments
- Honeywell International Inc. - Key news
- Honeywell International Inc. - Key offerings
- Honeywell International Inc. - Segment focus
- SWOT
- 15.12 Intel Corp.
- Intel Corp. - Overview
- Intel Corp. - Business segments
- Intel Corp. - Key news
- Intel Corp. - Key offerings
- Intel Corp. - Segment focus
- SWOT
- 15.13 Koninklijke Philips NV
- Koninklijke Philips NV - Overview
- Koninklijke Philips NV - Business segments
- Koninklijke Philips NV - Key news
- Koninklijke Philips NV - Key offerings
- Koninklijke Philips NV - Segment focus
- SWOT
- 15.14 Molex LLC
- Molex LLC - Overview
- Molex LLC - Product / Service
- Molex LLC - Key offerings
- SWOT
- 15.15 Nordost
- Nordost - Overview
- Nordost - Product / Service
- Nordost - Key offerings
- SWOT
- 15.16 Panasonic Holdings Corp.
- Panasonic Holdings Corp. - Overview
- Panasonic Holdings Corp. - Business segments
- Panasonic Holdings Corp. - Key news
- Panasonic Holdings Corp. - Key offerings
- Panasonic Holdings Corp. - Segment focus
- SWOT
- 15.17 RGB Systems Inc.
- RGB Systems Inc. - Overview
- RGB Systems Inc. - Product / Service
- RGB Systems Inc. - Key offerings
- SWOT
- 15.18 Sony Group Corp.
- Sony Group Corp. - Overview
- Sony Group Corp. - Business segments
- Sony Group Corp. - Key offerings
- Sony Group Corp. - Segment focus
- SWOT
16 Appendix
- 16.1 Scope of the report
- 16.2 Inclusions and exclusions checklist
- Inclusions checklist
- Exclusions checklist
- 16.3 Currency conversion rates for US$
- Currency conversion rates for US$
- 16.4 Research methodology
- Research methodology
- 16.5 Data procurement
- Information sources
- 16.6 Data validation
- Data validation
- 16.7 Validation techniques employed for market sizing
- Validation techniques employed for market sizing
- 16.8 Data synthesis
- Data synthesis
- 16.9 360 degree market analysis
- 360 degree market analysis
- 16.10 List of abbreviations
- List of abbreviations

