|
|
市場調査レポート
商品コード
1502397
骨移植片と代替品の世界市場 2024-2028Global bone grafts and substitutes market 2024-2028 |
||||||
|
|||||||
カスタマイズ可能
|
|||||||


| 骨移植片と代替品の世界市場 2024-2028 |
|
出版日: 2024年05月21日
発行: TechNavio
ページ情報: 英文 183 Pages
納期: 即納可能
|

全表示
- 概要
- 図表
- 目次
Technavio社は、骨移植片と代替品市場を調査し、2023年から2028年にかけて17億1,940万米ドル、予測期間中のCAGRは9.45%で成長すると予測しています。
当レポートでは、骨移植片と代替品市場の全体的な分析、市場規模・予測、動向、成長促進要因、課題、約25のベンダーを網羅したベンダー分析などを掲載しています。
現在の市場シナリオ、最新動向と促進要因、市場環境全体に関する最新分析を提供しています。市場は、整形外科疾患や外科症例の増加、歯科用骨移植片の需要増加、臨床試験への投資増加によって牽引されています。
| 市場範囲 | |
|---|---|
| 基準年 | 2024 |
| 終了年 | 2028 |
| 予測期間 | 2024-2028 |
| 成長モメンタム | 加速 |
| 前年比2024年 | 8.42% |
| CAGR | 9.45% |
| 増分額 | 17億1,940万米ドル |
本調査では、今後数年間の骨移植片と代替品市場成長を牽引する主要因の1つとして、低侵襲手術の採用拡大を挙げています。また、骨移植における3Dプリンティングの出現や新興国市場におけるデンタルツーリズムの増加も、市場の大きな需要につながると思われます。
目次
第1章 エグゼクティブサマリー
- 市場概要
第2章 市場情勢
- 市場エコシステム
- 市場の特徴
- バリューチェーン分析
第3章 市場規模の評価
- 市場の定義
- 市場セグメント分析
- 市場規模 2023
- 市場の見通し 2023-2028
第4章 市場規模実績
- 世界骨移植片と代替品市場 2018-2022
- 製品セグメント別分析別 2018-2022
- 用途別セグメント分析 2018-2022
- 地域別セグメント分析 2018-2022
- 国別セグメント分析 2018-2022
第5章 ファイブフォース分析
- ファイブフォースの要約
- 買い手の交渉力
- 供給企業の交渉力
- 新規参入業者の脅威
- 代替品の脅威
- 競争の脅威
- 市況
第6章 市場セグメンテーション:製品別
- 市場セグメンテーション
- 比較:製品別
- 異種移植:市場規模と予測 2023-2028
- 同種移植:市場規模と予測 2023-2028
- 合成骨移植:市場規模と予測 2023-2028
- ヒト脱灰骨基質:市場規模と予測 2023-2028
- 市場機会:製品別
第7章 市場セグメンテーション:用途別
- 市場セグメンテーション
- 比較:用途別
- 脊椎固定術:市場規模と予測 2023-2028
- トラウマ:市場規模と予測 2023-2028
- 頭蓋顎顔面:市場規模と予測 2023-2028
- 関節再建:市場規模と予測 2023-2028
- 歯科骨移植:市場規模と予測 2023-2028
- 市場機会:用途別
第8章 顧客情勢
- 顧客情勢の概要
第9章 地域別情勢
- 地域別セグメンテーション
- 地域別比較
- 北米:市場規模と予測 2023-2028
- 欧州:市場規模と予測 2023-2028
- アジア:市場規模と予測 2023-2028
- 世界のその他の地域:市場規模と予測 2023-2028
- 米国:市場規模と予測 2023-2028
- ドイツ:市場規模と予測 2023-2028
- 英国:市場規模と予測 2023-2028
- 中国:市場規模と予測 2023-2028
- 日本:市場規模と予測 2023-2028
- 市場機会:地域別
第10章 促進要因・課題・機会・抑制要因
- 市場促進要因
- 市場の課題
- 促進要因と課題の影響
- 市場の機会・抑制要因
第11章 競合情勢
- 概要
- 競合情勢
- 混乱の状況
- 業界のリスク
第12章 競合分析
- 企業プロファイル
- 企業の市場ポジショニング
- AlloSource
- Arthrex Inc.
- Baxter International Inc.
- Bioventus LLC
- Ed. Geistlich Sohne AG
- Integra Lifesciences Corp.
- Johnson and Johnson Services Inc.
- Medtronic Plc
- MTF Biologics
- NovaBone Products LLC
- Nuvasive Inc.
- Orthofix Medical Inc.
- OST Laboratories
- Smith and Nephew plc
- Stryker Corp.
第13章 付録
Exhibits:
- Exhibits1: Executive Summary - Chart on Market Overview
- Exhibits2: Executive Summary - Data Table on Market Overview
- Exhibits3: Executive Summary - Chart on Global Market Characteristics
- Exhibits4: Executive Summary - Chart on Market by Geography
- Exhibits5: Executive Summary - Chart on Market Segmentation by Product
- Exhibits6: Executive Summary - Chart on Market Segmentation by Application
- Exhibits7: Executive Summary - Chart on Incremental Growth
- Exhibits8: Executive Summary - Data Table on Incremental Growth
- Exhibits9: Executive Summary - Chart on Company Market Positioning
- Exhibits10: Parent Market
- Exhibits11: Data Table on - Parent Market
- Exhibits12: Market characteristics analysis
- Exhibits13: Value Chain Analysis
- Exhibits14: Offerings of companies included in the market definition
- Exhibits15: Market segments
- Exhibits16: Chart on Global - Market size and forecast 2023-2028 ($ million)
- Exhibits17: Data Table on Global - Market size and forecast 2023-2028 ($ million)
- Exhibits18: Chart on Global Market: Year-over-year growth 2023-2028 (%)
- Exhibits19: Data Table on Global Market: Year-over-year growth 2023-2028 (%)
- Exhibits20: Historic Market Size - Data Table on Global Bone Grafts And Substitutes Market 2018 - 2022 ($ million)
- Exhibits21: Historic Market Size - Product Segment 2018 - 2022 ($ million)
- Exhibits22: Historic Market Size - Application Segment 2018 - 2022 ($ million)
- Exhibits23: Historic Market Size - Geography Segment 2018 - 2022 ($ million)
- Exhibits24: Historic Market Size - Country Segment 2018 - 2022 ($ million)
- Exhibits25: Five forces analysis - Comparison between 2023 and 2028
- Exhibits26: Bargaining power of buyers - Impact of key factors 2023 and 2028
- Exhibits27: Bargaining power of suppliers - Impact of key factors in 2023 and 2028
- Exhibits28: Threat of new entrants - Impact of key factors in 2023 and 2028
- Exhibits29: Threat of substitutes - Impact of key factors in 2023 and 2028
- Exhibits30: Threat of rivalry - Impact of key factors in 2023 and 2028
- Exhibits31: Chart on Market condition - Five forces 2023 and 2028
- Exhibits32: Chart on Product - Market share 2023-2028 (%)
- Exhibits33: Data Table on Product - Market share 2023-2028 (%)
- Exhibits34: Chart on Comparison by Product
- Exhibits35: Data Table on Comparison by Product
- Exhibits36: Chart on Xenografts - Market size and forecast 2023-2028 ($ million)
- Exhibits37: Data Table on Xenografts - Market size and forecast 2023-2028 ($ million)
- Exhibits38: Chart on Xenografts - Year-over-year growth 2023-2028 (%)
- Exhibits39: Data Table on Xenografts - Year-over-year growth 2023-2028 (%)
- Exhibits40: Chart on Allografts - Market size and forecast 2023-2028 ($ million)
- Exhibits41: Data Table on Allografts - Market size and forecast 2023-2028 ($ million)
- Exhibits42: Chart on Allografts - Year-over-year growth 2023-2028 (%)
- Exhibits43: Data Table on Allografts - Year-over-year growth 2023-2028 (%)
- Exhibits44: Chart on Synthetic bone grafts - Market size and forecast 2023-2028 ($ million)
- Exhibits45: Data Table on Synthetic bone grafts - Market size and forecast 2023-2028 ($ million)
- Exhibits46: Chart on Synthetic bone grafts - Year-over-year growth 2023-2028 (%)
- Exhibits47: Data Table on Synthetic bone grafts - Year-over-year growth 2023-2028 (%)
- Exhibits48: Chart on DBM - Market size and forecast 2023-2028 ($ million)
- Exhibits49: Data Table on DBM - Market size and forecast 2023-2028 ($ million)
- Exhibits50: Chart on DBM - Year-over-year growth 2023-2028 (%)
- Exhibits51: Data Table on DBM - Year-over-year growth 2023-2028 (%)
- Exhibits52: Market opportunity by Product ($ million)
- Exhibits53: Data Table on Market opportunity by Product ($ million)
- Exhibits54: Chart on Application - Market share 2023-2028 (%)
- Exhibits55: Data Table on Application - Market share 2023-2028 (%)
- Exhibits56: Chart on Comparison by Application
- Exhibits57: Data Table on Comparison by Application
- Exhibits58: Chart on Spinal fusion - Market size and forecast 2023-2028 ($ million)
- Exhibits59: Data Table on Spinal fusion - Market size and forecast 2023-2028 ($ million)
- Exhibits60: Chart on Spinal fusion - Year-over-year growth 2023-2028 (%)
- Exhibits61: Data Table on Spinal fusion - Year-over-year growth 2023-2028 (%)
- Exhibits62: Chart on Trauma - Market size and forecast 2023-2028 ($ million)
- Exhibits63: Data Table on Trauma - Market size and forecast 2023-2028 ($ million)
- Exhibits64: Chart on Trauma - Year-over-year growth 2023-2028 (%)
- Exhibits65: Data Table on Trauma - Year-over-year growth 2023-2028 (%)
- Exhibits66: Chart on Craniomaxillofacial - Market size and forecast 2023-2028 ($ million)
- Exhibits67: Data Table on Craniomaxillofacial - Market size and forecast 2023-2028 ($ million)
- Exhibits68: Chart on Craniomaxillofacial - Year-over-year growth 2023-2028 (%)
- Exhibits69: Data Table on Craniomaxillofacial - Year-over-year growth 2023-2028 (%)
- Exhibits70: Chart on Joint reconstruction - Market size and forecast 2023-2028 ($ million)
- Exhibits71: Data Table on Joint reconstruction - Market size and forecast 2023-2028 ($ million)
- Exhibits72: Chart on Joint reconstruction - Year-over-year growth 2023-2028 (%)
- Exhibits73: Data Table on Joint reconstruction - Year-over-year growth 2023-2028 (%)
- Exhibits74: Chart on Dental bone grafting - Market size and forecast 2023-2028 ($ million)
- Exhibits75: Data Table on Dental bone grafting - Market size and forecast 2023-2028 ($ million)
- Exhibits76: Chart on Dental bone grafting - Year-over-year growth 2023-2028 (%)
- Exhibits77: Data Table on Dental bone grafting - Year-over-year growth 2023-2028 (%)
- Exhibits78: Market opportunity by Application ($ million)
- Exhibits79: Data Table on Market opportunity by Application ($ million)
- Exhibits80: Analysis of price sensitivity, lifecycle, customer purchase basket, adoption rates, and purchase criteria
- Exhibits81: Chart on Market share By Geographical Landscape2023-2028 (%)
- Exhibits82: Data Table on Market share By Geographical Landscape2023-2028 (%)
- Exhibits83: Chart on Geographic comparison
- Exhibits84: Data Table on Geographic comparison
- Exhibits85: Chart on North America - Market size and forecast 2023-2028 ($ million)
- Exhibits86: Data Table on North America - Market size and forecast 2023-2028 ($ million)
- Exhibits87: Chart on North America - Year-over-year growth 2023-2028 (%)
- Exhibits88: Data Table on North America - Year-over-year growth 2023-2028 (%)
- Exhibits89: Chart on Europe - Market size and forecast 2023-2028 ($ million)
- Exhibits90: Data Table on Europe - Market size and forecast 2023-2028 ($ million)
- Exhibits91: Chart on Europe - Year-over-year growth 2023-2028 (%)
- Exhibits92: Data Table on Europe - Year-over-year growth 2023-2028 (%)
- Exhibits93: Chart on Asia - Market size and forecast 2023-2028 ($ million)
- Exhibits94: Data Table on Asia - Market size and forecast 2023-2028 ($ million)
- Exhibits95: Chart on Asia - Year-over-year growth 2023-2028 (%)
- Exhibits96: Data Table on Asia - Year-over-year growth 2023-2028 (%)
- Exhibits97: Chart on Rest of World (ROW) - Market size and forecast 2023-2028 ($ million)
- Exhibits98: Data Table on Rest of World (ROW) - Market size and forecast 2023-2028 ($ million)
- Exhibits99: Chart on Rest of World (ROW) - Year-over-year growth 2023-2028 (%)
- Exhibits100: Data Table on Rest of World (ROW) - Year-over-year growth 2023-2028 (%)
- Exhibits101: Chart on US - Market size and forecast 2023-2028 ($ million)
- Exhibits102: Data Table on US - Market size and forecast 2023-2028 ($ million)
- Exhibits103: Chart on US - Year-over-year growth 2023-2028 (%)
- Exhibits104: Data Table on US - Year-over-year growth 2023-2028 (%)
- Exhibits105: Chart on Germany - Market size and forecast 2023-2028 ($ million)
- Exhibits106: Data Table on Germany - Market size and forecast 2023-2028 ($ million)
- Exhibits107: Chart on Germany - Year-over-year growth 2023-2028 (%)
- Exhibits108: Data Table on Germany - Year-over-year growth 2023-2028 (%)
- Exhibits109: Chart on UK - Market size and forecast 2023-2028 ($ million)
- Exhibits110: Data Table on UK - Market size and forecast 2023-2028 ($ million)
- Exhibits111: Chart on UK - Year-over-year growth 2023-2028 (%)
- Exhibits112: Data Table on UK - Year-over-year growth 2023-2028 (%)
- Exhibits113: Chart on China - Market size and forecast 2023-2028 ($ million)
- Exhibits114: Data Table on China - Market size and forecast 2023-2028 ($ million)
- Exhibits115: Chart on China - Year-over-year growth 2023-2028 (%)
- Exhibits116: Data Table on China - Year-over-year growth 2023-2028 (%)
- Exhibits117: Chart on Japan - Market size and forecast 2023-2028 ($ million)
- Exhibits118: Data Table on Japan - Market size and forecast 2023-2028 ($ million)
- Exhibits119: Chart on Japan - Year-over-year growth 2023-2028 (%)
- Exhibits120: Data Table on Japan - Year-over-year growth 2023-2028 (%)
- Exhibits121: Market opportunity By Geographical Landscape($ million)
- Exhibits122: Data Tables on Market opportunity By Geographical Landscape($ million)
- Exhibits123: Impact of drivers and challenges in 2023 and 2028
- Exhibits124: Overview on criticality of inputs and factors of differentiation
- Exhibits125: Overview on factors of disruption
- Exhibits126: Impact of key risks on business
- Exhibits127: Companies covered
- Exhibits128: Matrix on companies position and classification
- Exhibits129: AlloSource - Overview
- Exhibits130: AlloSource - Product / Service
- Exhibits131: AlloSource - Key offerings
- Exhibits132: Arthrex Inc. - Overview
- Exhibits133: Arthrex Inc. - Product / Service
- Exhibits134: Arthrex Inc. - Key offerings
- Exhibits135: Baxter International Inc. - Overview
- Exhibits136: Baxter International Inc. - Business segments
- Exhibits137: Baxter International Inc. - Key news
- Exhibits138: Baxter International Inc. - Key offerings
- Exhibits139: Baxter International Inc. - Segment focus
- Exhibits140: Bioventus LLC - Overview
- Exhibits141: Bioventus LLC - Business segments
- Exhibits142: Bioventus LLC - Key news
- Exhibits143: Bioventus LLC - Key offerings
- Exhibits144: Bioventus LLC - Segment focus
- Exhibits145: Ed. Geistlich Sohne AG - Overview
- Exhibits146: Ed. Geistlich Sohne AG - Product / Service
- Exhibits147: Ed. Geistlich Sohne AG - Key offerings
- Exhibits148: Integra Lifesciences Corp. - Overview
- Exhibits149: Integra Lifesciences Corp. - Business segments
- Exhibits150: Integra Lifesciences Corp. - Key news
- Exhibits151: Integra Lifesciences Corp. - Key offerings
- Exhibits152: Integra Lifesciences Corp. - Segment focus
- Exhibits153: Johnson and Johnson Services Inc. - Overview
- Exhibits154: Johnson and Johnson Services Inc. - Business segments
- Exhibits155: Johnson and Johnson Services Inc. - Key news
- Exhibits156: Johnson and Johnson Services Inc. - Key offerings
- Exhibits157: Johnson and Johnson Services Inc. - Segment focus
- Exhibits158: Medtronic Plc - Overview
- Exhibits159: Medtronic Plc - Business segments
- Exhibits160: Medtronic Plc - Key news
- Exhibits161: Medtronic Plc - Key offerings
- Exhibits162: Medtronic Plc - Segment focus
- Exhibits163: MTF Biologics - Overview
- Exhibits164: MTF Biologics - Product / Service
- Exhibits165: MTF Biologics - Key offerings
- Exhibits166: NovaBone Products LLC - Overview
- Exhibits167: NovaBone Products LLC - Product / Service
- Exhibits168: NovaBone Products LLC - Key offerings
- Exhibits169: Nuvasive Inc. - Overview
- Exhibits170: Nuvasive Inc. - Business segments
- Exhibits171: Nuvasive Inc. - Key news
- Exhibits172: Nuvasive Inc. - Key offerings
- Exhibits173: Nuvasive Inc. - Segment focus
- Exhibits174: Orthofix Medical Inc. - Overview
- Exhibits175: Orthofix Medical Inc. - Business segments
- Exhibits176: Orthofix Medical Inc. - Key news
- Exhibits177: Orthofix Medical Inc. - Key offerings
- Exhibits178: Orthofix Medical Inc. - Segment focus
- Exhibits179: OST Laboratories - Overview
- Exhibits180: OST Laboratories - Product / Service
- Exhibits181: OST Laboratories - Key offerings
- Exhibits182: Smith and Nephew plc - Overview
- Exhibits183: Smith and Nephew plc - Business segments
- Exhibits184: Smith and Nephew plc - Key news
- Exhibits185: Smith and Nephew plc - Key offerings
- Exhibits186: Smith and Nephew plc - Segment focus
- Exhibits187: Stryker Corp. - Overview
- Exhibits188: Stryker Corp. - Business segments
- Exhibits189: Stryker Corp. - Key news
- Exhibits190: Stryker Corp. - Key offerings
- Exhibits191: Stryker Corp. - Segment focus
- Exhibits192: Inclusions checklist
- Exhibits193: Exclusions checklist
- Exhibits194: Currency conversion rates for US$
- Exhibits195: Research methodology
- Exhibits196: Information sources
- Exhibits197: Data validation
- Exhibits198: Validation techniques employed for market sizing
- Exhibits199: Data synthesis
- Exhibits200: 360 degree market analysis
- Exhibits201: List of abbreviations
Technavio has been monitoring the bone grafts and substitutes market and is forecast to grow by USD 1719.4 mn during 2023-2028, accelerating at a CAGR of 9.45% during the forecast period. Our report on the bone grafts and substitutes market provides a holistic analysis, market size and forecast, trends, growth drivers, and challenges, as well as vendor analysis covering around 25 vendors.
The report offers an up-to-date analysis regarding the current market scenario, the latest trends and drivers, and the overall market environment. The market is driven by growing orthopedic conditions and surgical cases, increasing demand for dental bone grafts, and rising investment in clinical trials.
Technavio's bone grafts and substitutes market is segmented as below:
| Market Scope | |
|---|---|
| Base Year | 2024 |
| End Year | 2028 |
| Series Year | 2024-2028 |
| Growth Momentum | Accelerate |
| YOY 2024 | 8.42% |
| CAGR | 9.45% |
| Incremental Value | $1719.4mn |
By Product
- Xenografts
- Allografts
- Synthetic bone grafts
- DBM
By Application
- Spinal fusion
- Trauma
- Craniomaxillofacial
- Joint reconstruction
- Dental bone grafting
By Geography
- North America
- Europe
- Asia
- Rest of World (ROW)
This study identifies the growing adoption of minimally invasive surgeries as one of the prime reasons driving the bone grafts and substitutes market growth during the next few years. Also, emergence of 3d printing in bone grafting and increasing dental tourism in developing countries will lead to sizable demand in the market.
Technavio presents a detailed picture of the market by the way of study, synthesis, and summation of data from multiple sources by an analysis of key parameters. Our report on the bone grafts and substitutes market covers the following areas:
- Bone grafts and substitutes market sizing
- Bone grafts and substitutes market forecast
- Bone grafts and substitutes market industry analysis
Technavio's robust vendor analysis is designed to help clients improve their market position, and in line with this, this report provides a detailed analysis of several leading bone grafts and substitutes market vendors that include AlloSource, Arthrex Inc., Baxter International Inc., Bioventus LLC, Ed. Geistlich Sohne AG, Institut Straumann AG, Integra Lifesciences Corp., Johnson and Johnson Services Inc., Medtronic Plc, MTF Biologics, NovaBone Products LLC, Nuvasive Inc., Orthofix Medical Inc., OST Laboratories, RTI Surgical Inc., Smith and Nephew plc, Stryker Corp., TBF TISSUE ENGINEERING, Xtant Medical Holdings Inc., and Zimmer Biomet Holdings Inc.. Also, the bone grafts and substitutes market analysis report includes information on upcoming trends and challenges that will influence market growth. This is to help companies strategize and leverage all forthcoming growth opportunities.
The study was conducted using an objective combination of primary and secondary information including inputs from key participants in the industry. The report contains a comprehensive market and vendor landscape in addition to an analysis of the key vendors.
Technavio presents a detailed picture of the market by the way of study, synthesis, and summation of data from multiple sources by an analysis of key parameters such as profit, pricing, competition, and promotions. It presents various market facets by identifying the key industry influencers. The data presented is comprehensive, reliable, and a result of extensive research - both primary and secondary. Technavio's market research reports provide a complete competitive landscape and an in-depth vendor selection methodology and analysis using qualitative and quantitative research to forecast accurate market growth.
Table of Contents
1 Executive Summary
- 1.1 Market overview
- Executive Summary - Chart on Market Overview
- Executive Summary - Data Table on Market Overview
- Executive Summary - Chart on Global Market Characteristics
- Executive Summary - Chart on Market by Geography
- Executive Summary - Chart on Market Segmentation by Product
- Executive Summary - Chart on Market Segmentation by Application
- Executive Summary - Chart on Incremental Growth
- Executive Summary - Data Table on Incremental Growth
- Executive Summary - Chart on Company Market Positioning
2 Market Landscape
- 2.1 Market ecosystem
- Parent Market
- Data Table on - Parent Market
- 2.2 Market characteristics
- Market characteristics analysis
- 2.3 Value chain analysis
- Value Chain Analysis
3 Market Sizing
- 3.1 Market definition
- Offerings of companies included in the market definition
- 3.2 Market segment analysis
- Market segments
- 3.3 Market size 2023
- 3.4 Market outlook: Forecast for 2023-2028
- Chart on Global - Market size and forecast 2023-2028 ($ million)
- Data Table on Global - Market size and forecast 2023-2028 ($ million)
- Chart on Global Market: Year-over-year growth 2023-2028 (%)
- Data Table on Global Market: Year-over-year growth 2023-2028 (%)
4 Historic Market Size
- 4.1 Global Bone Grafts And Substitutes Market 2018 - 2022
- Historic Market Size - Data Table on Global Bone Grafts And Substitutes Market 2018 - 2022 ($ million)
- 4.2 Product segment analysis 2018 - 2022
- Historic Market Size - Product Segment 2018 - 2022 ($ million)
- 4.3 Application segment analysis 2018 - 2022
- Historic Market Size - Application Segment 2018 - 2022 ($ million)
- 4.4 Geography segment analysis 2018 - 2022
- Historic Market Size - Geography Segment 2018 - 2022 ($ million)
- 4.5 Country segment analysis 2018 - 2022
- Historic Market Size - Country Segment 2018 - 2022 ($ million)
5 Five Forces Analysis
- 5.1 Five forces summary
- Five forces analysis - Comparison between 2023 and 2028
- 5.2 Bargaining power of buyers
- Bargaining power of buyers - Impact of key factors 2023 and 2028
- 5.3 Bargaining power of suppliers
- Bargaining power of suppliers - Impact of key factors in 2023 and 2028
- 5.4 Threat of new entrants
- Threat of new entrants - Impact of key factors in 2023 and 2028
- 5.5 Threat of substitutes
- Threat of substitutes - Impact of key factors in 2023 and 2028
- 5.6 Threat of rivalry
- Threat of rivalry - Impact of key factors in 2023 and 2028
- 5.7 Market condition
- Chart on Market condition - Five forces 2023 and 2028
6 Market Segmentation by Product
- 6.1 Market segments
- Chart on Product - Market share 2023-2028 (%)
- Data Table on Product - Market share 2023-2028 (%)
- 6.2 Comparison by Product
- Chart on Comparison by Product
- Data Table on Comparison by Product
- 6.3 Xenografts - Market size and forecast 2023-2028
- Chart on Xenografts - Market size and forecast 2023-2028 ($ million)
- Data Table on Xenografts - Market size and forecast 2023-2028 ($ million)
- Chart on Xenografts - Year-over-year growth 2023-2028 (%)
- Data Table on Xenografts - Year-over-year growth 2023-2028 (%)
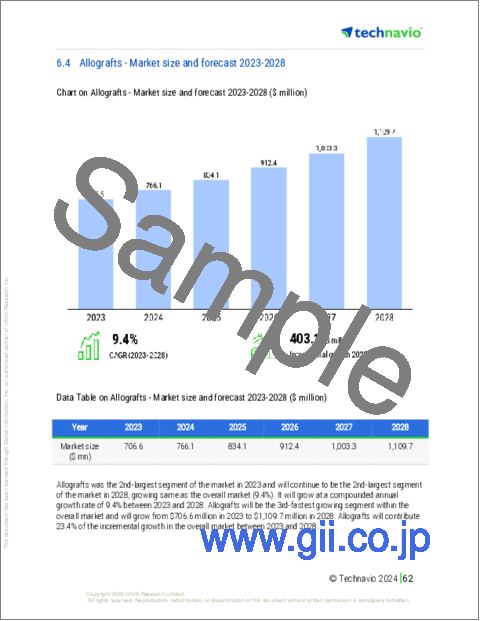
- 6.4 Allografts - Market size and forecast 2023-2028
- Chart on Allografts - Market size and forecast 2023-2028 ($ million)
- Data Table on Allografts - Market size and forecast 2023-2028 ($ million)
- Chart on Allografts - Year-over-year growth 2023-2028 (%)
- Data Table on Allografts - Year-over-year growth 2023-2028 (%)
- 6.5 Synthetic bone grafts - Market size and forecast 2023-2028
- Chart on Synthetic bone grafts - Market size and forecast 2023-2028 ($ million)
- Data Table on Synthetic bone grafts - Market size and forecast 2023-2028 ($ million)
- Chart on Synthetic bone grafts - Year-over-year growth 2023-2028 (%)
- Data Table on Synthetic bone grafts - Year-over-year growth 2023-2028 (%)
- 6.6 DBM - Market size and forecast 2023-2028
- Chart on DBM - Market size and forecast 2023-2028 ($ million)
- Data Table on DBM - Market size and forecast 2023-2028 ($ million)
- Chart on DBM - Year-over-year growth 2023-2028 (%)
- Data Table on DBM - Year-over-year growth 2023-2028 (%)
- 6.7 Market opportunity by Product
- Market opportunity by Product ($ million)
- Data Table on Market opportunity by Product ($ million)
7 Market Segmentation by Application
- 7.1 Market segments
- Chart on Application - Market share 2023-2028 (%)
- Data Table on Application - Market share 2023-2028 (%)
- 7.2 Comparison by Application
- Chart on Comparison by Application
- Data Table on Comparison by Application
- 7.3 Spinal fusion - Market size and forecast 2023-2028
- Chart on Spinal fusion - Market size and forecast 2023-2028 ($ million)
- Data Table on Spinal fusion - Market size and forecast 2023-2028 ($ million)
- Chart on Spinal fusion - Year-over-year growth 2023-2028 (%)
- Data Table on Spinal fusion - Year-over-year growth 2023-2028 (%)
- 7.4 Trauma - Market size and forecast 2023-2028
- Chart on Trauma - Market size and forecast 2023-2028 ($ million)
- Data Table on Trauma - Market size and forecast 2023-2028 ($ million)
- Chart on Trauma - Year-over-year growth 2023-2028 (%)
- Data Table on Trauma - Year-over-year growth 2023-2028 (%)
- 7.5 Craniomaxillofacial - Market size and forecast 2023-2028
- Chart on Craniomaxillofacial - Market size and forecast 2023-2028 ($ million)
- Data Table on Craniomaxillofacial - Market size and forecast 2023-2028 ($ million)
- Chart on Craniomaxillofacial - Year-over-year growth 2023-2028 (%)
- Data Table on Craniomaxillofacial - Year-over-year growth 2023-2028 (%)
- 7.6 Joint reconstruction - Market size and forecast 2023-2028
- Chart on Joint reconstruction - Market size and forecast 2023-2028 ($ million)
- Data Table on Joint reconstruction - Market size and forecast 2023-2028 ($ million)
- Chart on Joint reconstruction - Year-over-year growth 2023-2028 (%)
- Data Table on Joint reconstruction - Year-over-year growth 2023-2028 (%)
- 7.7 Dental bone grafting - Market size and forecast 2023-2028
- Chart on Dental bone grafting - Market size and forecast 2023-2028 ($ million)
- Data Table on Dental bone grafting - Market size and forecast 2023-2028 ($ million)
- Chart on Dental bone grafting - Year-over-year growth 2023-2028 (%)
- Data Table on Dental bone grafting - Year-over-year growth 2023-2028 (%)
- 7.8 Market opportunity by Application
- Market opportunity by Application ($ million)
- Data Table on Market opportunity by Application ($ million)
8 Customer Landscape
- 8.1 Customer landscape overview
- Analysis of price sensitivity, lifecycle, customer purchase basket, adoption rates, and purchase criteria
9 Geographic Landscape
- 9.1 Geographic segmentation
- Chart on Market share By Geographical Landscape2023-2028 (%)
- Data Table on Market share By Geographical Landscape2023-2028 (%)
- 9.2 Geographic comparison
- Chart on Geographic comparison
- Data Table on Geographic comparison
- 9.3 North America - Market size and forecast 2023-2028
- Chart on North America - Market size and forecast 2023-2028 ($ million)
- Data Table on North America - Market size and forecast 2023-2028 ($ million)
- Chart on North America - Year-over-year growth 2023-2028 (%)
- Data Table on North America - Year-over-year growth 2023-2028 (%)
- 9.4 Europe - Market size and forecast 2023-2028
- Chart on Europe - Market size and forecast 2023-2028 ($ million)
- Data Table on Europe - Market size and forecast 2023-2028 ($ million)
- Chart on Europe - Year-over-year growth 2023-2028 (%)
- Data Table on Europe - Year-over-year growth 2023-2028 (%)
- 9.5 Asia - Market size and forecast 2023-2028
- Chart on Asia - Market size and forecast 2023-2028 ($ million)
- Data Table on Asia - Market size and forecast 2023-2028 ($ million)
- Chart on Asia - Year-over-year growth 2023-2028 (%)
- Data Table on Asia - Year-over-year growth 2023-2028 (%)
- 9.6 Rest of World (ROW) - Market size and forecast 2023-2028
- Chart on Rest of World (ROW) - Market size and forecast 2023-2028 ($ million)
- Data Table on Rest of World (ROW) - Market size and forecast 2023-2028 ($ million)
- Chart on Rest of World (ROW) - Year-over-year growth 2023-2028 (%)
- Data Table on Rest of World (ROW) - Year-over-year growth 2023-2028 (%)
- 9.7 US - Market size and forecast 2023-2028
- Chart on US - Market size and forecast 2023-2028 ($ million)
- Data Table on US - Market size and forecast 2023-2028 ($ million)
- Chart on US - Year-over-year growth 2023-2028 (%)
- Data Table on US - Year-over-year growth 2023-2028 (%)
- 9.8 Germany - Market size and forecast 2023-2028
- Chart on Germany - Market size and forecast 2023-2028 ($ million)
- Data Table on Germany - Market size and forecast 2023-2028 ($ million)
- Chart on Germany - Year-over-year growth 2023-2028 (%)
- Data Table on Germany - Year-over-year growth 2023-2028 (%)
- 9.9 UK - Market size and forecast 2023-2028
- Chart on UK - Market size and forecast 2023-2028 ($ million)
- Data Table on UK - Market size and forecast 2023-2028 ($ million)
- Chart on UK - Year-over-year growth 2023-2028 (%)
- Data Table on UK - Year-over-year growth 2023-2028 (%)
- 9.10 China - Market size and forecast 2023-2028
- Chart on China - Market size and forecast 2023-2028 ($ million)
- Data Table on China - Market size and forecast 2023-2028 ($ million)
- Chart on China - Year-over-year growth 2023-2028 (%)
- Data Table on China - Year-over-year growth 2023-2028 (%)
- 9.11 Japan - Market size and forecast 2023-2028
- Chart on Japan - Market size and forecast 2023-2028 ($ million)
- Data Table on Japan - Market size and forecast 2023-2028 ($ million)
- Chart on Japan - Year-over-year growth 2023-2028 (%)
- Data Table on Japan - Year-over-year growth 2023-2028 (%)
- 9.12 Market opportunity by geography
- Market opportunity By Geographical Landscape($ million)
- Data Tables on Market opportunity By Geographical Landscape($ million)
10 Drivers, Challenges, and Opportunity/Restraints
- 10.1 Market drivers
- 10.2 Market challenges
- 10.3 Impact of drivers and challenges
- Impact of drivers and challenges in 2023 and 2028
- 10.4 Market opportunities/restraints
11 Competitive Landscape
- 11.1 Overview
- 11.2 Competitive Landscape
- Overview on criticality of inputs and factors of differentiation
- 11.3 Landscape disruption
- Overview on factors of disruption
- 11.4 Industry risks
- Impact of key risks on business
12 Competitive Analysis
- 12.1 Companies profiled
- Companies covered
- 12.2 Market positioning of companies
- Matrix on companies position and classification
- 12.3 AlloSource
- AlloSource - Overview
- AlloSource - Product / Service
- AlloSource - Key offerings
- 12.4 Arthrex Inc.
- Arthrex Inc. - Overview
- Arthrex Inc. - Product / Service
- Arthrex Inc. - Key offerings
- 12.5 Baxter International Inc.
- Baxter International Inc. - Overview
- Baxter International Inc. - Business segments
- Baxter International Inc. - Key news
- Baxter International Inc. - Key offerings
- Baxter International Inc. - Segment focus
- 12.6 Bioventus LLC
- Bioventus LLC - Overview
- Bioventus LLC - Business segments
- Bioventus LLC - Key news
- Bioventus LLC - Key offerings
- Bioventus LLC - Segment focus
- 12.7 Ed. Geistlich Sohne AG
- Ed. Geistlich Sohne AG - Overview
- Ed. Geistlich Sohne AG - Product / Service
- Ed. Geistlich Sohne AG - Key offerings
- 12.8 Integra Lifesciences Corp.
- Integra Lifesciences Corp. - Overview
- Integra Lifesciences Corp. - Business segments
- Integra Lifesciences Corp. - Key news
- Integra Lifesciences Corp. - Key offerings
- Integra Lifesciences Corp. - Segment focus
- 12.9 Johnson and Johnson Services Inc.
- Johnson and Johnson Services Inc. - Overview
- Johnson and Johnson Services Inc. - Business segments
- Johnson and Johnson Services Inc. - Key news
- Johnson and Johnson Services Inc. - Key offerings
- Johnson and Johnson Services Inc. - Segment focus
- 12.10 Medtronic Plc
- Medtronic Plc - Overview
- Medtronic Plc - Business segments
- Medtronic Plc - Key news
- Medtronic Plc - Key offerings
- Medtronic Plc - Segment focus
- 12.11 MTF Biologics
- MTF Biologics - Overview
- MTF Biologics - Product / Service
- MTF Biologics - Key offerings
- 12.12 NovaBone Products LLC
- NovaBone Products LLC - Overview
- NovaBone Products LLC - Product / Service
- NovaBone Products LLC - Key offerings
- 12.13 Nuvasive Inc.
- Nuvasive Inc. - Overview
- Nuvasive Inc. - Business segments
- Nuvasive Inc. - Key news
- Nuvasive Inc. - Key offerings
- Nuvasive Inc. - Segment focus
- 12.14 Orthofix Medical Inc.
- Orthofix Medical Inc. - Overview
- Orthofix Medical Inc. - Business segments
- Orthofix Medical Inc. - Key news
- Orthofix Medical Inc. - Key offerings
- Orthofix Medical Inc. - Segment focus
- 12.15 OST Laboratories
- OST Laboratories - Overview
- OST Laboratories - Product / Service
- OST Laboratories - Key offerings
- 12.16 Smith and Nephew plc
- Smith and Nephew plc - Overview
- Smith and Nephew plc - Business segments
- Smith and Nephew plc - Key news
- Smith and Nephew plc - Key offerings
- Smith and Nephew plc - Segment focus
- 12.17 Stryker Corp.
- Stryker Corp. - Overview
- Stryker Corp. - Business segments
- Stryker Corp. - Key news
- Stryker Corp. - Key offerings
- Stryker Corp. - Segment focus
13 Appendix
- 13.1 Scope of the report
- 13.2 Inclusions and exclusions checklist
- Inclusions checklist
- Exclusions checklist
- 13.3 Currency conversion rates for US$
- Currency conversion rates for US$
- 13.4 Research methodology
- Research methodology
- 13.5 Data procurement
- Information sources
- 13.6 Data validation
- Data validation
- 13.7 Validation techniques employed for market sizing
- Validation techniques employed for market sizing
- 13.8 Data synthesis
- Data synthesis
- 13.9 360 degree market analysis
- 360 degree market analysis
- 13.10 List of abbreviations
- List of abbreviations

